New uses for batteries, including providing power for everything from automobiles to medical devices to consumer products, are leading to rapid growth in their use. The growth of alternative energy sources also requires batteries to store excess energy and release it when needed.
New battery materials, technologies and types are constantly being developed as a result of this varied and rapid demand.
Some commonly-used elements in these new batteries include zinc (Zn), phosphorus (P), nickel (Ni), manganese (Mn) and lithium (Li), among others. Depending on the battery, the percentage of these components can range from up to 30% to just a single digit percent.
Accurately knowing the ratios of the major components is an important factor in order to obtain optimum performance because deviations (and the presence of impurities) can negatively affect the performance of a battery.
This means major battery components must be measured with precision and accuracy while simultaneously having their impurity levels measured.
ICP-OES has a high tolerance to matrices but is still able to accurately measure impurities down to the μg/L level with high precision, making it the ideal analytical technique to meet these needs.
HP-ICP-OES, or high precision ICP-OES, provides unparalleled accuracy (RSDs of 0.1% or less) and is only available on fully simultaneous ICP-OES systems like PerkinElmer’s Avio® 550 Max.
This method measures the internal standard at the same time as the analyte for fully simultaneous measurements that compensate for all sources of noise.
This article will demonstrate the ability of the Avio 550 Mac ICP OES for measuring elements commonly found in batteries with both accuracy and high precision while simultaneously measuring common impurities.
Experimental
Materials and Sample Preparation
Table 1 shows the concentrations at which standards containing Zn, Ni, Li, P and Mn were prepared in 2% nitric acid (v/v) to mimic digestion of battery materials.
Common impurities were also added to solutions with the concentrations listed above. A 100x dilution of starting materials used in batteries was simulated by the concentrations shown in Table 1.
Table 1. Elements and Concentrations. Source: PerkinElmer, Inc.
| Major Components |
| Element |
Concentrations (mg/L) |
| Mn, P |
500, 1000, 2000 |
| Li |
125, 250, 500 |
| Ni, Zn |
50, 100, 200 |
| Impurities |
| Element |
Concentrations (μg/L) |
| Cu, Cd, Hg, Mo, Pb |
50, 100, 200 |
Instrumental Parameters
Analysis was completed using the parameters shown in Table 2, using the Avio 550 Max ICP-OES. Table 3 shows the timings, plasma views and wavelengths. Internal standards are read with the same integration time as the analytes for optimum precision with HP-ICP-OES.
More readings were able to be acquired by increasing precision through the use of a 10-second read time. Linear bracketing calibration curves were measured against the majors, and linear-through-zero regressions were used to measure impurities; all calibration standards used for measurement were prepared in 2% HNO3.
Table 2. Instrumental Parameters. Source: PerkinElmer, Inc.
| Parameter |
Value |
| Nebulizer |
SeaSpray™ |
| Spray Chamber |
Baffled Glass Cyclonic |
| Sample Uptake Rate |
1.0 mL/min |
| RF Power |
1500 W |
| Injector |
2.0 mm id Alumina |
| Nebulizer Gas Flow |
0.65 L/min |
| Auxiliary Gas Flow |
0.2 L/min |
| Plasma Gas Flow |
10 L/min |
| Torch Position |
-3 |
| Replicates |
3 |
Table 3. Method Parameters. Source: PerkinElmer, Inc.
| Category |
Analyte |
Plasma
View |
Internal
Standard |
Plasma View
Height |
Integration
Time (s) |
Read
Time (s) |
| Majors |
Li 610.362 |
Radial |
Sc 361.383 |
20 |
0.01 |
10 |
| Ni 232.003 |
Axial |
Sc 361.383 |
15 |
0.01 |
10 |
| Zn 334.501 |
Axial |
Sc 361.383 |
15 |
0.01 |
10 |
| Mn 347.413 |
Radial |
Sc 361.383 |
20 |
0.01 |
10 |
| P 213.623 |
Radial |
Sc 361.383 |
15 |
0.01 |
10 |
| Impurities |
Cd 214.440 |
Axial |
Sc 361.383 |
15 |
0.05 |
1 |
| Cu 327.393 |
Axial |
Sc 361.383 |
15 |
0.05 |
1 |
| Hg 194.168 |
Axial |
Sc 361.383 |
15 |
0.05 |
1 |
| Mo 202.031 |
Axial |
Sc 361.383 |
15 |
0.05 |
1 |
| Pb 220.353 |
Axial |
Sc 361.383 |
15 |
0.05 |
1 |
Results and Discussion
The middle standard was measured ten times against the constructed calibration curves. The RSDs, or relative standard deviations, for all the major elements of the samples are shown in Figure 1; they were all less than or equal to 0.2%.
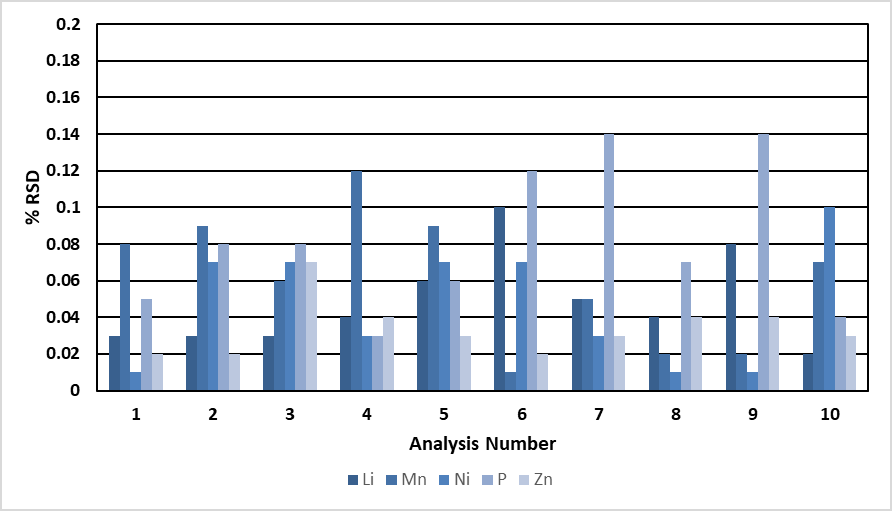
Figure 1. Precision (%RSD) for major elements during 10 analyses of the middle calibration standard (Mn, P = 1000 mg/L; Li = 500 ppm; Ni, Zn = 100 ppm). Image Credit: PerkinElmer, Inc.
Most of the results were <0.1%. This level of precision was enabled by the analyte being read at the exact same integration time (0.01 sec) as the internal standard.
The internal standard corrected for flicker and shot noise through having true simultaneous measurements, which resulted in exceptionally precise measurements.
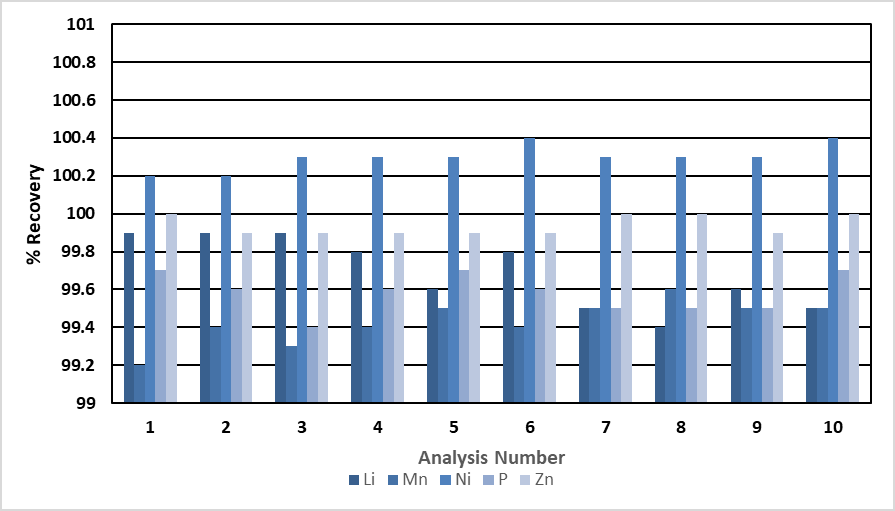
Figure 2. Recovery of major elements over 10 analyses (Mn, P = 1000 mg/L; Li = 500 ppm; Ni, Zn = 100 ppm). Image Credit: PerkinElmer, Inc.
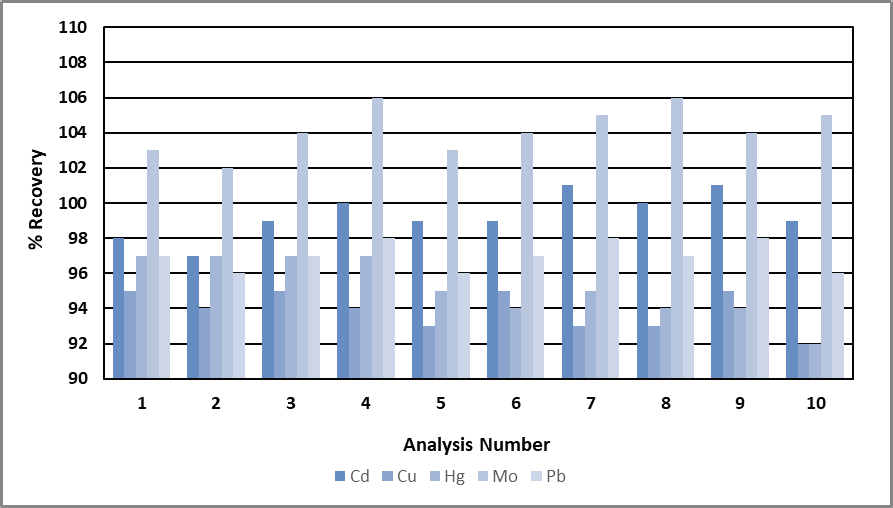
Figure 3. Recovery of minor elements (0.1 mg/L) over 10 analyses. Image Credit: PerkinElmer, Inc.
Concentrations of the majors and impurities were both measured during the same analysis. The impurities are shown in Figure 3, and the recoveries for the majors are shown in Figure 2. The impurities recovered within 6% of their expected values, and the major elements recovered within 2%.
Table 4. Precision (% RSD) over 10 Analyses of Major and Impurity Elements. Source: PerkinElmer, Inc.
| Major Components |
| Element |
RSD |
| Mn |
0.12% |
| P |
0.10% |
| Li |
0.19% |
| Ni |
0.07% |
| Zn |
0.05% |
| Impurities |
| Element |
RSD |
| Cu |
1.3% |
| Cd |
1.2% |
| Hg |
1.8% |
| Mo |
1.3% |
| Pb |
0.84% |
The precision of both the major and impurity elements over the ten analyses evidence the stability of the methodology. Table 4 shows that the RSDs are less than 2% for the impurity elements and less than 0.2% for the major elements.
The use of HP-ICP-OES is the reason for the reproducibility of the major elements. 'Normal' and HP-ICP-OES analyses can both be implemented within the same method without the sacrifice of data quality, as demonstrated by the precision for the impurities.
Conclusion
This article shows how HP-ICP-OES can be provided using the Avio 550 Max ICP-OES through its ability to fully measure internal standards and analytes simultaneously and with high precision.
This results in high precisions/low RSDs (usually <0.10%) through its ability to provide real-time corrections of variations in the analytical signal.
Both impurities and matrix components can be measured together in a single method because HP-ICP-OES can be implemented in the same method along with analytes measured conventionally.
This is demonstrated in the above analysis of impurities and matrix components in common battery materials. HP-ICP-OES allows for exceptional accuracy and precision in the measurement of matrix materials when combined with bracketing calibrations.
Reference
- "HP-ICP-OES: Using the Avio 550/560 Max to Achieve the Highest Possible Precisions", Technical Note, PerkinElmer, 2020.
Consumables Used
Table 5. Source: PerkinElmer, Inc.
| Component |
Part Number |
Sample Uptake Tubing:
Black/Black (0.76 mm id) PVC, Flared |
N0777043 |
Drain Tubing:
Gray/Gray (1.30 mm id), Santoprene |
N0777444 |
| Lithium Standard, 10,000 μg/mL |
N9304323 (125 mL)
N9304324 (500 mL) |
| Manganese Standard, 10,000 μg/mL |
N9304115 (125 mL) |
| Nickel Standard, 10,000 μg/mL |
N9304117 (125 mL)
N9304116 (500 mL) |
| Phosphorus Standard, 10,000 μg/mL |
N9304119 (125 mL)
N9304118 (500 mL) |
| Zinc Standard, 10,000 μg/mL |
N9304129 (125 mL) |
| Cadmium Standard, 1000 μg/mL |
N9300176 (125 mL)
N9300107 (500 mL) |
Table 6. Source: PerkinElmer, Inc.
| Component |
Part Number |
| Copper Standard, 1000 μg/mL |
N9300183 (125 mL)
N9300114 (500 mL) |
| Lead Standard, 1000 μg/mL |
N9300175 (125 mL)
N9300128 (500 mL) |
| Mercury Standard, 1000 μg/mL |
N9300174 (125 mL)
N9300133 (500 mL) |
| Molybdenum Standard, 1000 μg/mL |
N9303784 (125 mL)
N9300134 (500 mL) |
| Scandium Standard, 1000 μg/mL |
N9303798 (125 mL)
N9300148 (500 mL) |
| Autosampler Tubes, case of 500 |
B0193233 (15 mL)
B0193234 (50 mL) |

This information has been sourced, reviewed and adapted from materials provided by PerkinElmer, Inc.
For more information on this source, please visit PerkinElmer, Inc.