It is important that water pollution be both prevented and controlled in order to ensure the protection of both human and environmental health. Water must be monitored for pollutants at several stages, commencing with waste and wastewater discharge through to the production of drinking water.
Various methods and techniques are employed in this testing, with the choice highly dependent on the type of water under analysis and the pollutant in question.
The U.S. Environmental Protection Agency (EPA) has developed Method 200.7 (the current version being Revision 4.4.1) – an approach for the determination of metals and trace elements in waters and wastes via ICP-OES.1
While the scope of this method makes it suitable for use with a variety of sample types, one of the most common applications of Method 200.7 lies in wastewater analysis.
This article explores the use of the Avio® 550 Max ICP-OES instrument in the analysis of wastewaters in adherence to U.S. EPA Method 200.7 guidelines.
The Avio 550 Max is a fully simultaneous ICP, highly suited to this application due to its exceptional stability, low-to-no maintenance hardware and minimal argon consumption.
The Avio® 550 Max ICP-OES boasts robust plasma at only 8 L/min flow, offering laboratories significant cost savings over the lifetime of the instrument.
The Syngistix™ software for the Avio 550 Max has been designed with usability at its core, offering smart results viewing and real-time instrument diagnostics. This allows users to easily track sample analysis, quality control (QC), and internal standard performance to ensure sample accuracy.
Experimental
Samples and Sample Preparation
A total of four wastewater reference materials were employed in method development and evaluation. These were:
- Wastewater Low Levels and Wastewater High Levels (Inorganic Ventures™, Christiansburg, Virginia, USA)
- Wastewater C and D (High Purity Standards™, Charleston, South Carolina, USA).
These samples were prepared in line with provided instructions and analyzed with no further dilution.
Table 1. Calibration Standards. Source: PerkinElmer, Inc.
| Element |
Standard 1 (mg/L) |
Standard 2 (mg/L) |
Standard 3 (mg/L) |
| Ag, Al, As, B, Ba, Be, Cd, Ce, Co, Cr, Cu, Fe, Li, Mn, Mo, Ni, P, Pb, Sb, Se, Si, Sn, Sr, Ti, Tl, V, Zn |
0.5 |
1 |
5 |
| Na, Mg, K, Ca |
20.5 |
51 |
105 |
Measurements were performed against external calibration curves prepared in 2% nitric acid (v/v) at a range of concentrations (Table 1). Yttrium (Y) and scandium (Sc) were added on-line to all blanks, samples and standards – these functioned as internal standards.
Instrument Conditions
Analyses were performed using the PerkinElmer Avio® 550 Max ICP optical emission spectrometer (ICP-OES). Conditions and parameters are displayed in Table 2, while analytical wavelengths and view modes are provided in Table 3.
Table 2. Avio 550 Max ICP-OES Instrumental Parameters. Source: PerkinElmer, Inc.
| Parameter |
Value |
| Nebulizer |
MEINHARD® Type K |
| Spray Chamber |
Baffled glass cyclonic |
| Sample Uptake Rate |
1.0 mL/min |
| RF Power |
1500 W |
| Injector |
2.0 mm id Alumina |
| Nebulizer Gas Flow |
0.70 L/min |
| Auxiliary Gas Flow |
0.2 L/min |
| Plasma Gas Flow |
8 L/min |
| Integration Range |
1-10 sec |
| Sample Uptake Tubing |
Black/Black (0.76 mm id) |
| Internal Standard Tubing |
Green/Orange (0.38 mm id) |
| Drain Tubing |
Red/Red (1.14 mm id) |
| Replicates |
4 |
Table 3. Elements, Wavelengths and Plasma View Modes. Source: PerkinElmer, Inc.
| Element |
Wavelength (nm) |
Plasma View |
| Ag |
328.068 |
Radial |
| Al |
394.401 |
Radial |
| As |
188.979 |
Axial |
| B |
249.677 |
Axial |
| Ba |
493.408 |
Radial |
| Be |
313.107 |
Axial |
| Ca |
315.887 |
Radial |
| Cd |
214.440 |
Axial |
| Co |
228.616 |
Axial |
| Cr |
267.716 |
Axial |
| Cu |
324.752 |
Axial |
| Fe |
238.204 |
Radial |
| K |
766.490 |
Radial |
| Li |
670.784 |
Radial |
| Mg |
285.213 |
Radial |
| Mn |
257.610 |
Axial |
| Mo |
203.845 |
Axial |
| Na |
589.592 |
Radial |
| Ni |
231.604 |
Axial |
| P |
178.221 |
Axial |
| Pb |
220.353 |
Axial |
| Sb |
206.836 |
Axial |
| Se |
196.026 |
Axial |
| Si |
251.611 |
Axial |
| Sn |
189.927 |
Axial |
| Sr |
421.552 |
Radial |
| Ti |
334.940 |
Axial |
| Tl |
190.801 |
Axial |
| V |
292.402 |
Axial |
| Zn |
206.200 |
Axial |
| Sc (int std) |
361.383 |
Radial |
| Y (int std) |
371.029 |
Axial |
Standard sample introduction components and conditions were used, including a total argon flow of 9 L/min – despite the heavy wastewater matrix.
Results and Discussion
Method 200.7 provides a number of criteria that must be adhered to; these cover sample handling/preparation and the instrumentation itself.
A number of instrumentation criteria are discussed here, including:
- linear dynamic range
- quality control parameters
- method detection limits (MDLs)
- instrument performance checks (IPC)
- spectral interference checks (SIC)
- accuracy
- stability
Linear Dynamic Range
The linear dynamic range is specified as the highest concentrations, which recover within 10% of their true values when analyzed against the calibration curve employed in the analysis. Table 4 displays the determined linear dynamic ranges for the example presented here.
Table 4. Linear Dynamic Range Pilot. Source: PerkinElmer, Inc.
| Elements |
Linear Range (mg/L) |
| Al, Be, Mn, Ti |
50 |
Ag, As, B, Ba, Cd, Co, Cr, Cu, Fe, Li Mo, Ni, P,
Pb, Sb, Se, Si, Sn, Sr, Tl, V, Zn |
100* |
| Mg |
200 |
| Ca, K, Na |
500* |
* = highest concentration tested
The linear range represents the highest concentration analyzed for most elements. This has been determined using the highest typical sample concentrations for this application rather than the instrument’s linear range capability.
The linear dynamic range of the Avio 550 Max ICP-OES confidently exceeds the range needed for this application.
When working with higher-concentration samples, it is possible to extend the linear range in a number of ways:
- Selection of less sensitive wavelengths
- Torch position variations
- Use of a different viewing mode (for example, axial or radial)
- Use of a less-sensitive sample introduction system
- Altering the viewing height in the plasma.
Initial QC: Initial Performance Check and Quality Control Sample
Two initial QC samples must be analyzed directly after the calibration standards to verify the calibration curve’s quality: an initial performance check (IPC) and a quality control sample (QCS).
It is important that the IPC is created from the same stock standards employed in the calibration standards and the QCS created from second-source standards.
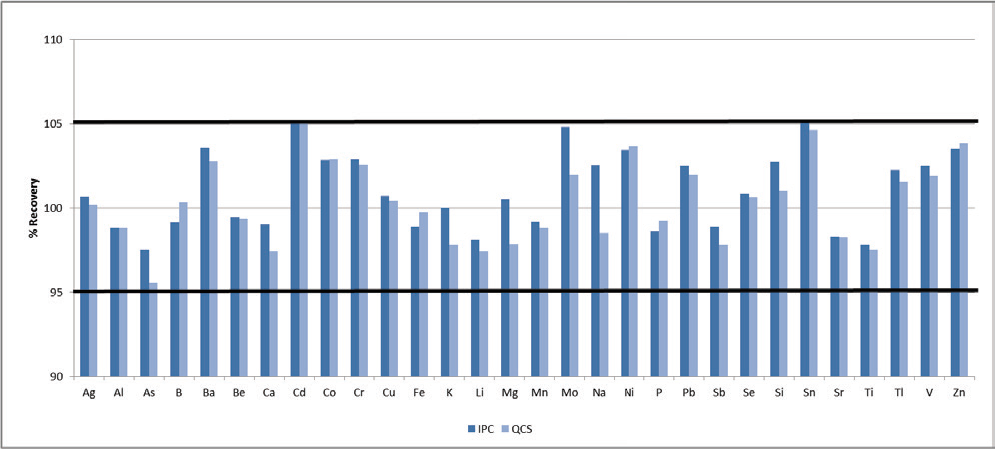
Figure 1. Recoveries for the IPC (dark blue) and QCS (light blue). Image Credit: PerkinElmer, Inc.
Both standards are required to recover within +5% of their true values. To evaluate this recovery, all elements were spiked at 1 ppm, except for the minerals (Na, Mg, K, Ca), which were spiked at 50 ppm. Both the IPC and QCS meet this criterion for all elements (Figure 1).
Method Detection Limits
Method 200.7 stipulates that MDLs should be determined by performing seven measurements of a blank. This blank should be spiked at concentrations of two or three times the instrumental detection limits, and the standard deviation of the seven measurements is multiplied by 3.14 to acquire the 99% confidence level.
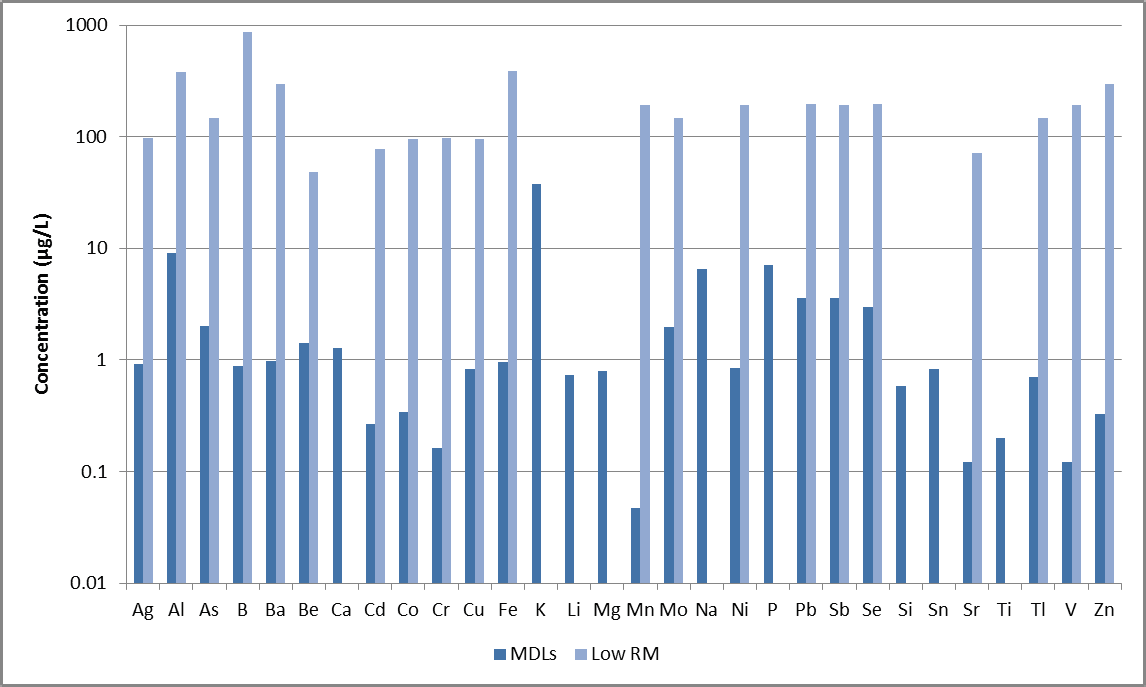
Figure 2. MDLs (dark blue) and certified values for low-level wastewater reference material (light blue). Not all elements in Method 200.7 are certified in the reference material. Image Credit: PerkinElmer, Inc.
MDLs for the examples presented here are shown in Figure 2, including the analyzed wastewater reference material’s lowest certified values. It should be noted that not all elements are certified in this reference material.
The MDLs are significantly lower than the certified values, illustrating the method’s capacity to easily measure low-level elements in wastewaters.
Spectral Interference Check
A spectral interference check standard (SIC) containing 300 mg/L Fe and 200 mg/L Al was analyzed to ascertain if it was necessary to use interelement correction equations (IECs). The excellent spectral resolution of the Avio 550 Max optics mitigated any need for IECs, and no notable interferences were detected.
If samples are analyzed that do contain high concentrations of other potential interferents, however, an IEC table can be created and implemented directly within the Syngistix for ICP software.
Accuracy
A total of four reference materials were analyzed to determine the method’s accuracy. Table 5 displays certified values for each reference material, while Figure 3 plots their recoveries.
Table 5. Certified Values in Wastewater Reference Materials (all units in mg/L). Source: PerkinElmer, Inc.
| Element |
Wastewater
Low |
Wastewater
High |
Wastewater
C |
Wastewater
D |
| Ag |
0.098 |
0.927 |
0.15 |
0.25 |
| Al |
0.384 |
3.95 |
0.5 |
1 |
| As |
0.147 |
0.824 |
0.15 |
0.25 |
| B |
0.864 |
1.87 |
0.5 |
1 |
| Ba |
0.294 |
2.37 |
0.5 |
1 |
| Be |
0.048 |
0.832 |
0.15 |
0.25 |
| Cd |
0.078 |
0.927 |
0.15 |
0.25 |
| Co |
0.096 |
0.936 |
0.5 |
1 |
| Cr |
0.098 |
0.927 |
0.5 |
1 |
| Cu |
0.096 |
0.936 |
0.5 |
1 |
| Fe |
0.392 |
3.91 |
0.5 |
1 |
| Mn |
0.192 |
3.95 |
0.5 |
1 |
| Mo |
0.147 |
0.515 |
0.5 |
1 |
| Ni |
0.192 |
2.91 |
0.5 |
1 |
| Pb |
0.196 |
2.88 |
0.5 |
1 |
| Sb |
0.192 |
0.832 |
0.15 |
0.25 |
| Se |
0.196 |
1.85 |
0.15 |
0.25 |
| Sr |
0.072 |
0.468 |
0.5 |
1 |
| Tl |
0.147 |
0.824 |
0.15 |
0.25 |
| V |
0.192 |
1.87 |
0.5 |
1 |
| Zn |
0.294 |
1.85 |
0.5 |
1 |
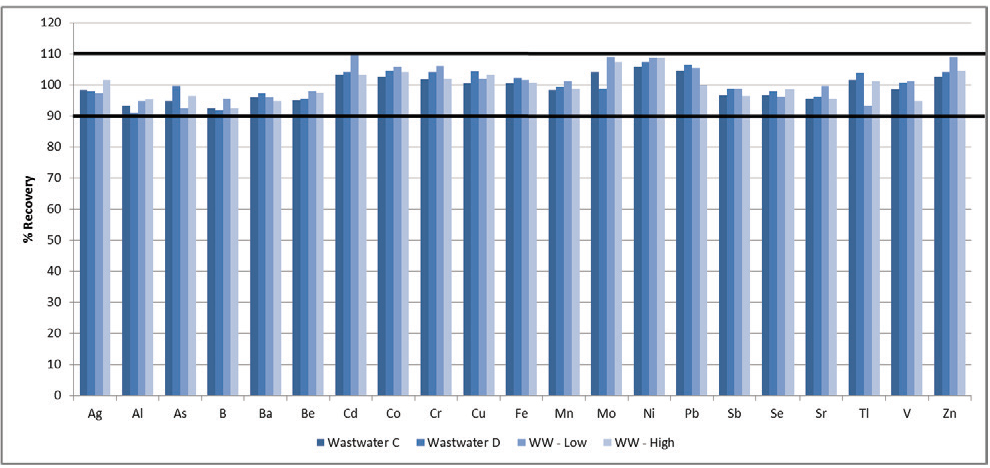
Figure 3. Recoveries in wastewater reference materials. Image Credit: PerkinElmer, Inc.
All recoveries were found to be within 10% of the certified values, confirming the accuracy of the methodology. It should be noted, however, that not every element listed in Method 200.7 has been certified in the reference materials.
It was necessary to assess the instrument and methodology’s capacity to accurately measure the elements in Method 200.7 not present in the reference materials. To achieve this, spikes of non-certified elements were added to wastewater reference materials and then analyzed.
Table 6. Spike Levels of Non-Certified Elements. Source: PerkinElmer, Inc.
| Element |
Spike (mg/L) |
Reference Material to which Spike was Added |
| Li, P, Si, Sn, Ti |
0.6 |
Wastewater C, Wastewater Low |
| 1.2 |
Wastewater D, Wastewater High |
| Ca, K, Mg, Na |
75 |
Wastewater C, Wastewater Low |
| 150 |
Wastewater D, Wastewater High |
Two distinct spike levels of each element were added to specific reference materials (Table 6), with their recoveries then plotted (Figure 4). All recoveries were found to be within 10% of their true values, further highlighting the methodology’s robustness.
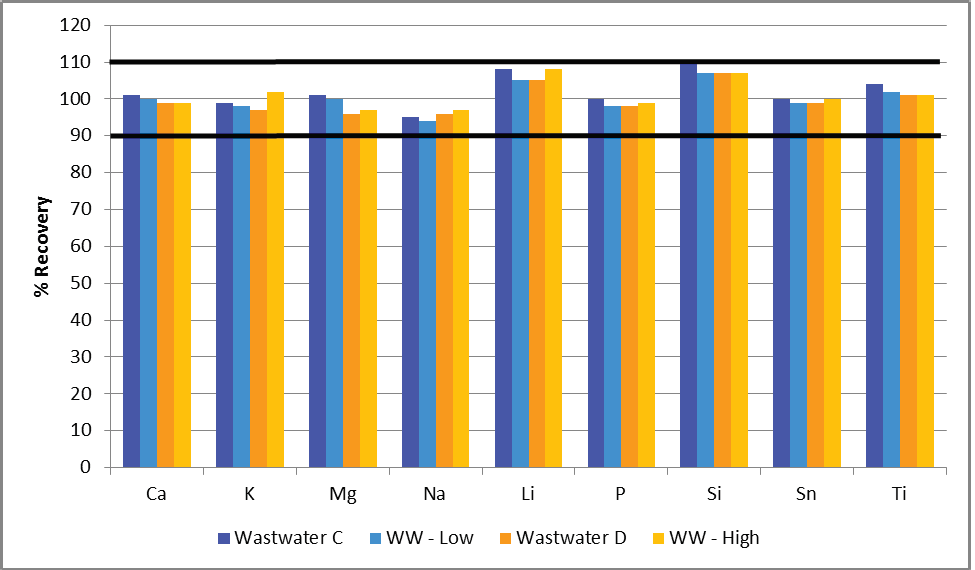
Figure 4. Spike recoveries of both lower (shades of blue) and higher (shades of orange) concentrations added to the wastewater reference materials. Image Credit: PerkinElmer, Inc.
Stability
Having established the accuracy of the methodology, it was necessary to assess its stability. This was done by analyzing wastewater samples over a 10-hour period, with a QC check (the IPC) analyzed every ten samples.

Figure 5. IPC recoveries during a 10-hour wastewater analysis. Image Credit: PerkinElmer, Inc.
The plot in Figure 5 displays these results, with all QC recoveries found to fall within 10% of their true value.
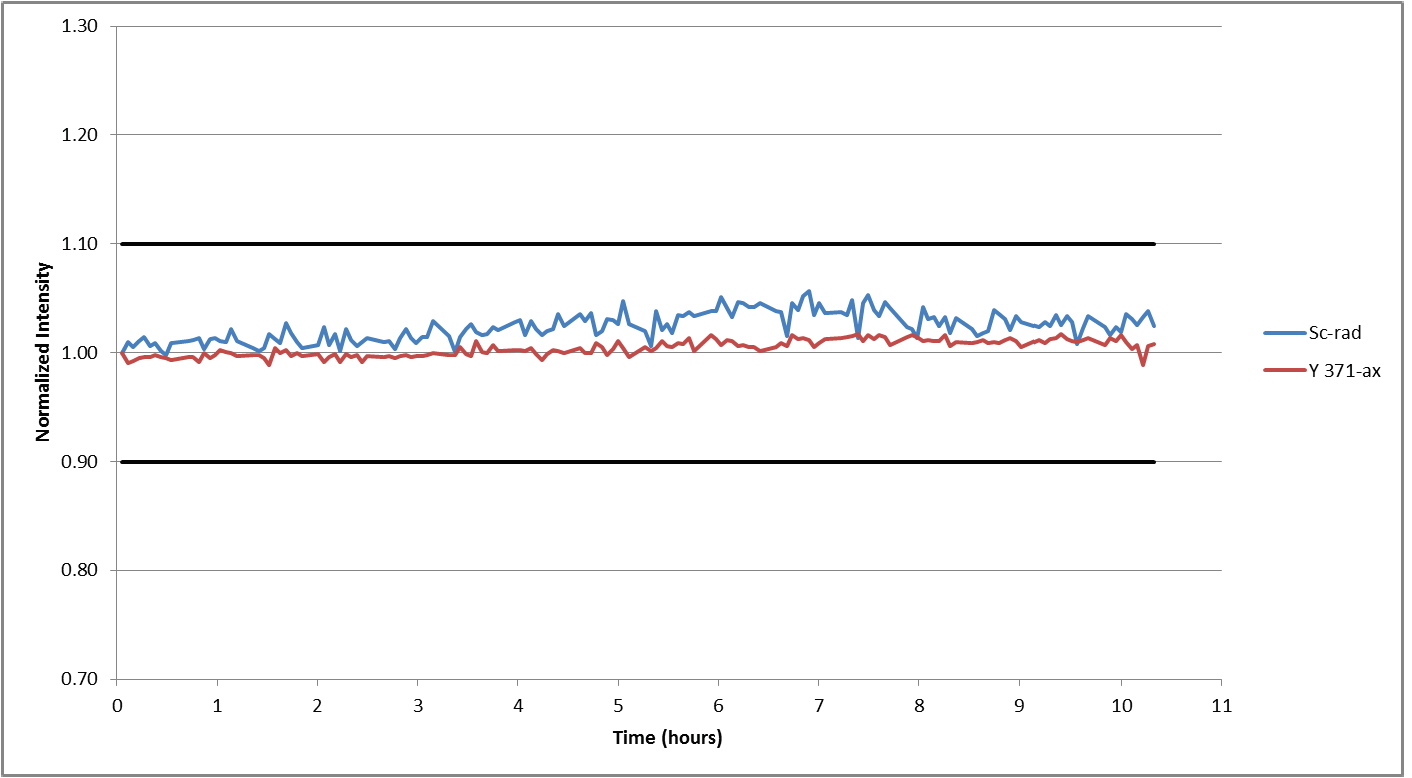
Figure 6. Internal standard recoveries in wastewater samples during a 10-hour analysis. Image Credit: PerkinElmer, Inc.
The stability of the internal standard was monitored during the same analysis process to investigate overall instrumental drift. Internal standards were found to vary by less than 7% (Figure 6), demonstrating the exceptional stability of the system.
Several instrumental design considerations contribute to this excellent stability, including the vertical torch and Flat Plate™ Plasma Technology. These are central to the instrument’s dual view capability, allowing users to continuously switch between radial and axial plasma viewing modes for each sample.
Conclusions
The study presented here illustrates the capacity of the Avio 550 Max ICP-OES to analyze wastewater in line with the guidelines provided in U.S. EPA Method 200.7.
Offering a powerful combination of accuracy, reliability, robustness and stability, the Avio 550 Max ICP-OES provides a strong solution for wastewater analysis, all while maintaining a total argon flow of 9 L/min. This low argon consumption provides a faster return on investment for all laboratories.
These features have been successfully demonstrated via the analysis of reference materials and QC checks throughout this study.
References
- Method 200.7, Revision 4.4: Determination of Metals and Trace Elements in Water and Wastes by Inductively Coupled Plasma- Atomic Emission Spectrometry”, United States Environmental Protection Agency, 1994.
Acknowledgments
Produced from materials originally authored by Ken Neubauer and Angela LaCroix-Fralish from PerkinElmer Inc.
Consumables Used
Table 7. Source: PerkinElmer, Inc.
| Component |
Part Number |
| Sample Uptake Tubing, Black/Black (0.76 mm id), PVC |
N0777043 (flared)
09908587 (non-flared) |
| Drain Tubing, Red/Red (1.14 mm id), PVC |
09908585 |
| Internal Standard Tubing, Orange/Green (0.38 mm id), PVC |
N0773111 (flared) |
| Instrument Calibration Standard 1: 5000 mg/L Ca, K, Mg, Na |
N9300218 (125 mL) |
| Instrument Calibration Standard 2: 100 mg/L Ag, As, As, Ba, Be, Ca, Cd, Co, Cr, Cu, Fe, K, Mg, Mn, Mo, Na, Ni, Pb, Sb, Se, Sn, Sr, Ti, Tl V, Zn |
N9301721 (125 mL) |
| Boron Standard, 1000 mg/L |
N9300016 (125 mL)
N9303760 (500 mL) |
| Cerium Standard, 1000 mg/L |
N9303765 (125 mL)
N9300110 (500 mL) |
| Lithium Standard, 1000 mg/L |
N9303781 (125 mL)
N9300129 (500 mL) |
| Cadmium Standard, 1000 mg/L |
N9300176 (125 mL)
N9300107 (500 mL) |
| Phosphorus Standard, 1000 mg/L |
N9303788 (125 mL)
N9300139 (500 mL) |
| Silicon Standard, 1000 mg/L |
N9303799 (125 mL)
N9300150 (500 mL) |
| Scandium Standard 1000 mg/L |
N9303798 (125 mL)
N9300148 (500 mL) |
| Yttrium Standard, 1000 mg/L |
N9303810 (125 mL)
N9300167 (500 mL) |
| Autosampler Tubes |
B0193233 (15 mL)
B0193234 (50 mL) |

This information has been sourced, reviewed and adapted from materials provided by PerkinElmer, Inc.
For more information on this source, please visit PerkinElmer, Inc.