A robust, low-power mobile instrument that measures VOCs in air in real time, the Vocus PTR-TOF addresses industrial and environmental problems which are not accessible by traditional mass spectrometry.

Image Credit: TOFWERK
This article explores patterns of VOC emissions from a Vocus PTR-TOF S mobile laboratory, which are shown around a Chinese megacity and near a petrochemical facility.
Characterization of VOC Emissions: Urban Areas
People live and work in an atmosphere rich with volatile organic compounds (VOCs) in dense urban and industrial areas. "Air toxics" like certain VOCs, which include single-ring aromatics, can cause complaints by nearby residents and harm human health due to odors.
There are strict regulations that control compounds that contribute to ozone and fine particulate formation through photochemical reactions. In industrial sites or residential areas, large amounts of VOCs can originate from point sources, and from non-point anthropogenic activities in populated areas.
Regulatory compliance, waste reduction and tighter manufacturing systems can all be facilitated by discovering and locating the VOCs' sources as an indicator of leaks or other inefficiencies. Considering the high density and vicinity of industrial zones to residential districts of the region, this is particularly important in Eastern China. For example, suburban industrial activities and the transport of pollutants from neighboring cities often heavily affect Shanghai city's air quality.
Proton-transfer-reaction time-of-flight mass spectrometry (PTR-TOF) is an analytical technique that is uniquely situated to point-source chemical fingerprinting and mobile monitoring.
A robust instrument platform, the Vocus PTR-TOF measures ambient air directly at a rate of several times per second, which offers a real-time measurement of the VOC environment. Simultaneous measurement of tens to thousands of VOC species, identifiable by their exact mass-to-charge ratios is facilitated by a high-resolution time-of-flight mass analyzer.
A Vocus S PTR-TOF operating in H3O+ mode was mobilized in this study in a van that was 3.8 meters high. At a flow rate of ~2 L/min, a 1/8′ sampling line drew ambient air ~0.5 meter above the van top. The total sampling line length was approximately 3 meters in front of the Vocus PTR instrument inlet. Both measurements – that is, zero air and calibration - were performed both before and after daily drives. The acquisition rate of the instrument was set to 1 second and the mass range was set to 1-500 Th.
VOC Hotspot and Point Source Detection
A large multi-institution campaign saw the mobile Vocus S driven in a search pattern in Shanghai. The drive path of the Vocus S included industrial, urban and rural urban areas. Figure 1 depicts detected hotspots for selected VOCs in an area of 57.000 km2. If you would like to explore aromatic VOCs in Shanghai using Google Earth or LocaSpace Viewer, download data set (.kmz) here.
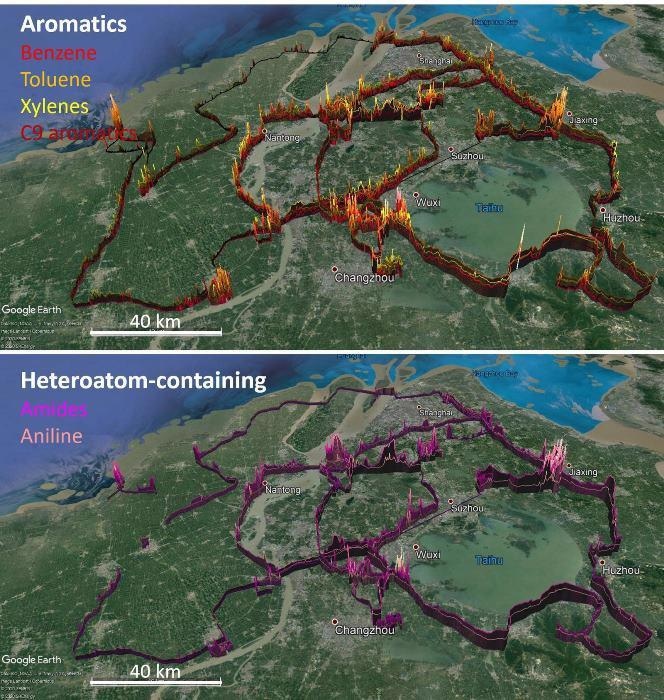
Figure 1. Figure 1 displays concentrations of selected VOCs which are shown above baseline detected in Shanghai. Different colors indicate different VOC. The scale runs from 100 ppt to 1.6 ppm and is logarithmic, with the mixing ratio marked by the height and color intensity. Points with mixing ratio less than 100 ppt are not shown. Image Credit: TOFWERK
Point sources in a much smaller area can be targeted by mobile PTR-TOF. The Vocus S was driven through a petrochemical plant in Eastern China in a search pattern. Hundreds of VOCs were then detected, in mixing ratios ranging from a few parts-per-trillion (ppt) to over a part-per-million (ppm) (Figure 2 A).
Figure 2A: Figure 2A shows a subset of the detected VOCs, which displays the need for simultaneous acquisition of a large number of VOC masses and a large dynamic range. Several isobaric masses are displayed. An instrument with high mass resolving power is needed to measure these separately.
There was a dramatic variation from point to point composition of the VOC mixture. Top ten sources of VOC mixtures present at the facility were determined by correlation analysis of VOCs, and this was then used to quantify the contribution of each source to total VOC (Figure 2). The VOCs shown in Figure 2A were selected because they have a signal-to-noise ratio higher than 2, and were used for the source apportionment analysis. Given that they may provide the necessary distinction between the chemical fingerprints of two sources even VOCs with smaller mixing ratios are important to include in a source apportionment analysis.
Approximately 92% of the total detected VOC emissions at the site are attributable to the top ten sources of mixed VOCs. The remainder is almost wholly pure benzene. The various sources relate to storage equipment and refinement located in different areas of the facility.
By plotting the measured VOCs on a map (Figure 3) the location of each VOC source can be determined. The characterization of this site using a mobile laboratory took under an hour.
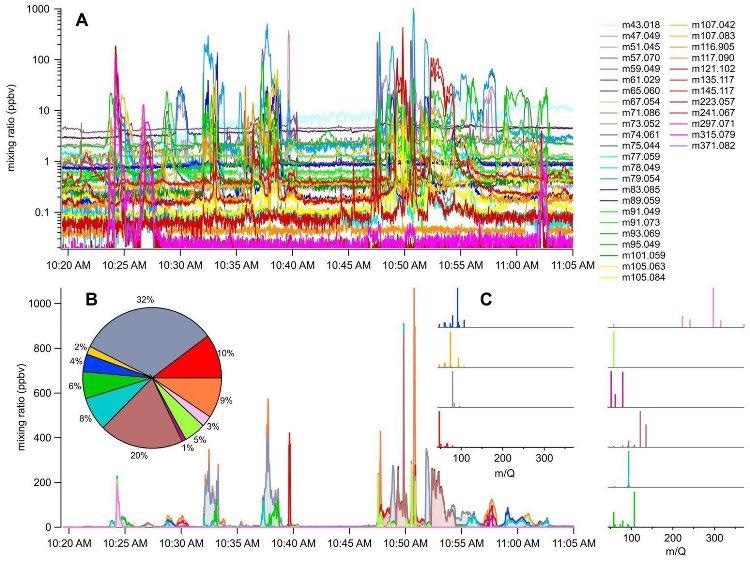
Figure 2. Figure 2A displays an overwhelming variety of VOCs observed at the petrochemical industrial park, with concentrations ranging from 10 ppt to 1000 ppb. Figure 2B displays actor analysis of the observed VOCs uncovers a smaller number of sources, each with a distinct VOC composition. The contribution of each source to total VOC is shown by the pie chart. Figure 2C shows mass spectra of the sources containing mixed VOCs. Image Credit: TOFWERK

Figure 3. Figure 3 shows locations of compositionally-distinct VOC plumes at the petrochemical facility. Image Credit: TOFWERK

This information has been sourced, reviewed and adapted from materials provided by TOFWERK.
For more information on this source, please visit TOFWERK.