The ships in the Great Lakes-St. Lawrence Seaway (GL-SLS) has used over 500,000 tons of fuel and liberated more than 1.6 million tons (Mt) of CO2 in 2019, evaluates a new study performed at the International Council on Clean Transportation (ICCT).
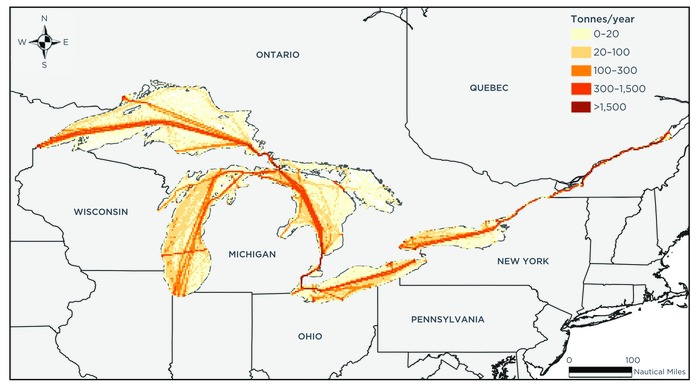 CO2 emissions from ships in the GL-SLS in 2019. Created with AIS data from exactEarth, ship characteristics data from IHS Markit, and base maps from ArcGIS Online. Image Credit: International Council on Clean Transportation
Also, the new and extensive emissions inventory for 2019 displays that ships flagged to the United States and Canada were collectively accountable for almost 80% of total CO2 emissions, each around 40%.
While ships that were flagged to the Marshall Islands ranked second regarding the number of vessels in the GL-SLS, they also liberated less CO2 compared to the U.S.-flagged ships.
Knowing the number of ships only tells you so much, and this underscores the importance of more granular analyses like this that help us understand ship activity.
Zhihang Meng, Study Co-Author and Marine Program Associate Researcher, International Council on Clean Transportation
Even though the St. Lawrence Seaway portion seems to be below 1% of the geographic area of the entire GL-SLS, it was home to 25% of the CO2 emissions in 2019 and had an average CO2 emissions intensity which is 36-times greater compared to the Great Lakes.
By ship type, the majority of the emissions in the GL-SLS came from huge carriers, almost 1 Mt or 62% of the total CO2, and they were followed by chemical tankers. This was responsible for almost 10% of total emissions, and tugs, which accounted for nearly 9%.
This inventory can be a baseline for a variety of stakeholders, including governments, ports, and community groups, in their efforts to reduce air pollution and mitigate the climate impacts of maritime shipping in the region.
Bryan Comer PhD, Study Co-Author and Marine Program Lead, International Council on Clean Transportation
Comer added, “Such actions could include promoting the use of shore power, shore-based or barge-based emissions capture bonnets, batteries, fuel cells, low-carbon fuels (as measured on a life-cycle basis), wind-assisted propulsion, and more.”
The ICCT plans to update periodically the analysis of this significant commercial waterway as more recent data becomes available.
Also, extra data is reported with the study: a statistics file consisting of data of emissions of non-CO2 climate and air pollutants such as black carbon, methane (CH4), sulfur oxides (SOx), particulate matter, and more; and an ArcGIS shapefile with the gridded CO2 emissions inventory for the GL-SLS at a resolution of 0.05° × 0.05°.
The emission factors utilized were the same as those used in the Fourth IMO Greenhouse Gas Study by the International Maritime Organization. This excluded ships that utilized bulky fuel oil with scrubbers. Emission factors developed by the ICCT were employed in the case of a ship with a scrubber.
Source: https://theicct.org/