Contamination of food with mineral oil hydrocarbons (MOH) has been a major issue since 2012. This was when the European Food Safety Authority (EFSA) denoted them as a potential health concern.1
MOH are typically classified into two main sub-classes: MOSH, or Mineral Oil Saturated Hydrocarbons, which include linear, branched and alkyl-substituted cycloalkanes; and MOAH, or Mineral Oil Aromatic Hydrocarbons, which mainly include alkyl-substituted (poly) aromatic hydrocarbons such as the alkylbenzenes, alkyl naphthalenes, etc.
Considering the analytical methods, two options have been presented so far to quantify these substances. They are:
- An off-line method involving a solid phase extraction-SPE, followed by a GC-FID analysis
- The most familiar online LC-GC-FID method
But based on the matrix, both methods can pose qualitative/quantitative challenges and lead to inaccuracies. This is because of the lack of an associated confirmatory method (i.e., GC-MS, GCxGC-MS).
In this context, LECO’s Pegasus® BT 4D GC×GC-TOFMS system can be used to reveal the complexity of contaminated food samples, offering excellent chromatographic resolution and identification abilities. Also, considering the proposal by EFSA, the GCxGC-MS technology should be employed as a piece of confirmatory equipment when results are uncertain.
An example of the extraordinary resolution power is the viability to distinguish the MOSH from the POSH, or Polyolefin Oligomeric Saturated Hydrocarbons, and/or the MOAH from biogenic substances like terpenoids.
Generally, both POSH and the terpenoids are called interferents and can be wrongly quantified as MOSH or MOAH. This occurs when traditional methodologies (i.e. LC-GC-FID) are used, which causes the error in results.
Besides the higher identification confidence and the elevated separation power, the LECO ChromaTOF® software’s “Classifications” attribute can be used regularly to collate data faster from the samples, regarding the existence of a particular class of chemicals such as hopanes or steranes, or the recently emphasized 3-7 rings from MOAH.2
This article explains a GCxGC-TOFMS workflow to isolate and identify the MOSH/MOAH fractions from the biogenic substances that normally occur in a spice sample, namely cumin.
Experiment
After obtaining the cumin extract, the spice was pre-separated into individual MOAH and MOSH fractions, where each fraction was concentrated (via sequential analytical runs) to ~100 µL and injected into a BT 4D GCxGC-TOFMS system through the direct Pegasus LC-GC fractionation and coupling technique.
Before the spice analysis, a standard sample called VGO-IS was injected using the same process as a reference. This sample included a petroleum fraction spiked with the MOSH/MOAH Internal Standard (Restek Corporation, #31070).
Table 1 lists all the GCxGC-TOFMS experimental parameters.
Table 1. Source: LECO Corporation
| GCxGC |
LECO GCxGC QuadJet™ Thermal Modulator |
| Injection |
2 μL, Splitless mode (330 °C) |
| Columns |
1D: Rxi-17 SilMS, 12 m x 0.25 mm i.d. x 0.25 μm coating (Restek)
2D: Rxi-1-HT, 1.05 m x 0.25 mm i.d. x 0.25 μm coating (Restek) |
| Carrier Gas |
He; 1 ml/min constant flow |
| Oven Program |
40 °C (hold 1 min), ramp 5 °C/min to 360 °C, hold 10 min |
| Secondary Oven |
+7 °C |
| Modulation (PM) |
5 s |
| Transfer Line |
340 °C |
| MS |
LECO Pegasus BT 4D |
| Ion Source Temp |
280 °C |
| Mass Range |
40-700 |
| Acquisition Rate |
200 spectra/s |
Results and Discussion
A reference contour plot with all the most relevant chemical classes to be analyzed in the MOSH/MOAH field could be created by analyzing the VGO-IS reference sample (yielded by mixing a Vacuum Gas Oil; VGO- carbon range >C50-) using the MOSH/MOAH Internal standards. The GCxGC contour plot obtained by injecting this sample is shown in Figure 1.
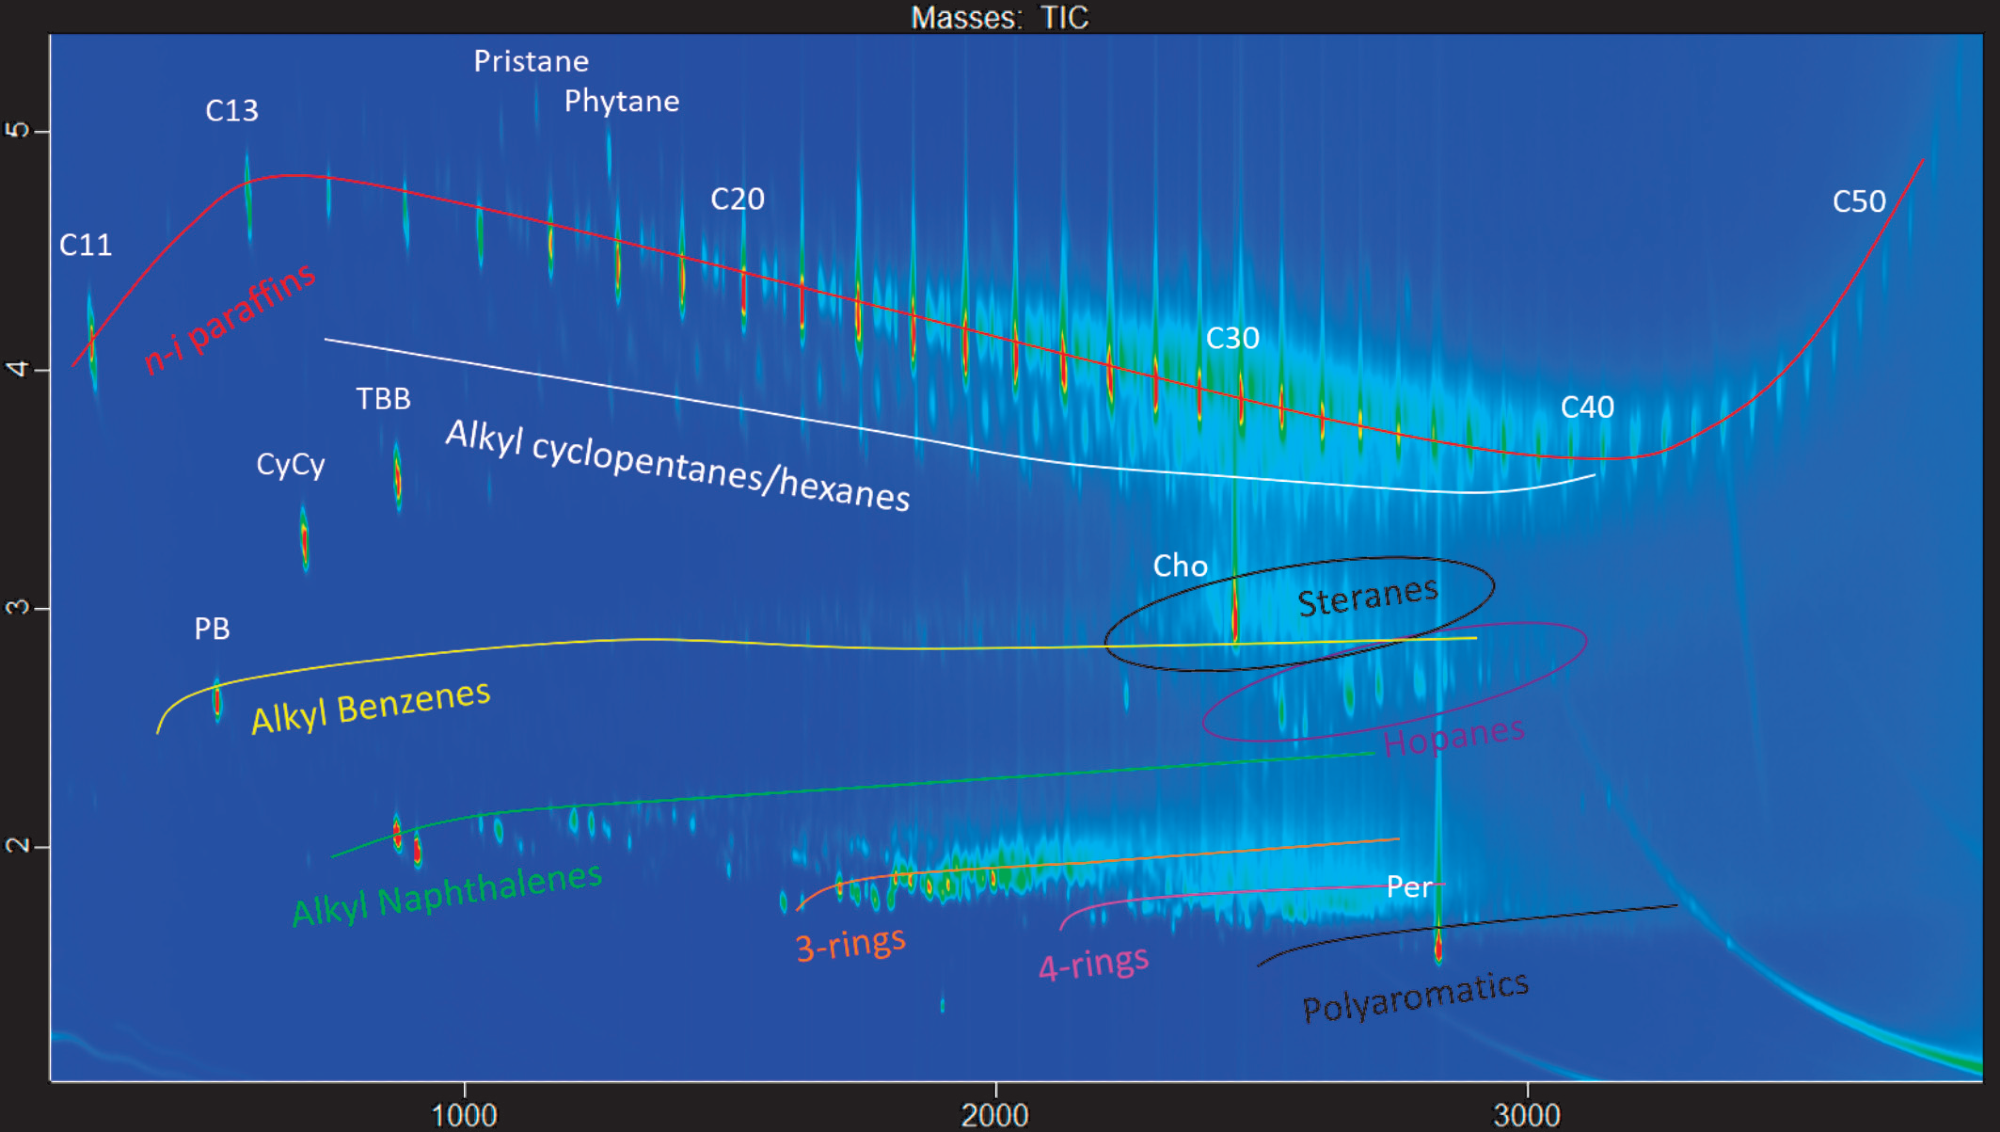
Figure 1. GCxGC-TOFMS contour plot from the VGO sample + the MOSH/MOAH internal standards (VGO-IS). Image Credit: LECO Corporation
As can be seen from Figure 1, the exceptional power of the GCxGC technology enables the separation of different classes of components, leading to a highly structured contour plot.
A reverse column setup was chosen for its ability to resolve chemical classes, which are otherwise challenging to isolate through the traditional “normal” setup (for example, n-i paraffins from the POSH).
The reverse setup facilitates the detailed separation of hopanes (m/z 191), which are regarded to be proof of mineral oil contamination. In general, these markers are found in trace amounts and are challenging to separate and/or detect with the LC-GC-FID procedure.
However, the combination of GCxGC and TOFMS technology helped resolve them in detail and present a higher characteristic pattern of elution. The same can be achieved for the steranes, which elute somewhat above the hopanes and can be targeted easily using the m/z 217.
Lastly, a precise verification of the separation capabilities within the MOAH fraction was executed to ensure sufficient separation of the aromatic ring structures within the fraction. This was required as per the latest suggestion from the EU in 2019, which pinpoints the significance of the 3-7 ring polycyclic aromatic compounds (3-7 PAC) from a toxicological perspective.
Once the analysis of the reference sample was completed, the MOAH and MOSH fractions from the cumin extract were also studied with the help of the same BT 4D GCxGC-TOFMS system arrangement and data analysis technique.
The key scope for the analysis was to screen for the occurrence of the MOAH and MOSH contaminations and the existence of interferents, which could have impacted the LC-GC-FID quantification results.
The presence of hopanes in the MOSH fraction of the cumin is illustrated in Figure 2, which confirms the presence of mineral oil contamination.
Figure 3 reveals the presence of particular MOAH markers like the Diisopropylnaphthalnes (DIPN) and the Dibenzothiophenes (DBT) originating potentially from the cardboard ink of the packaging and jute bags used to transport the spices after the harvest, respectively.
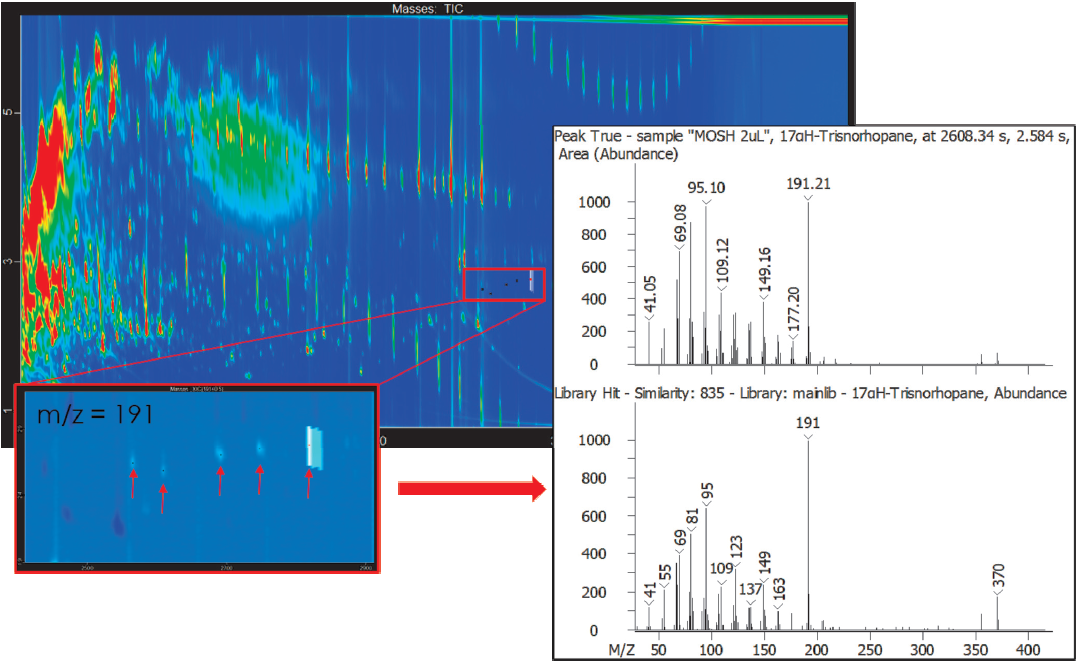
Figure 2. Hopanes detection in the cumin MOSH fraction (m/z 191.21). Image Credit: LECO Corporation
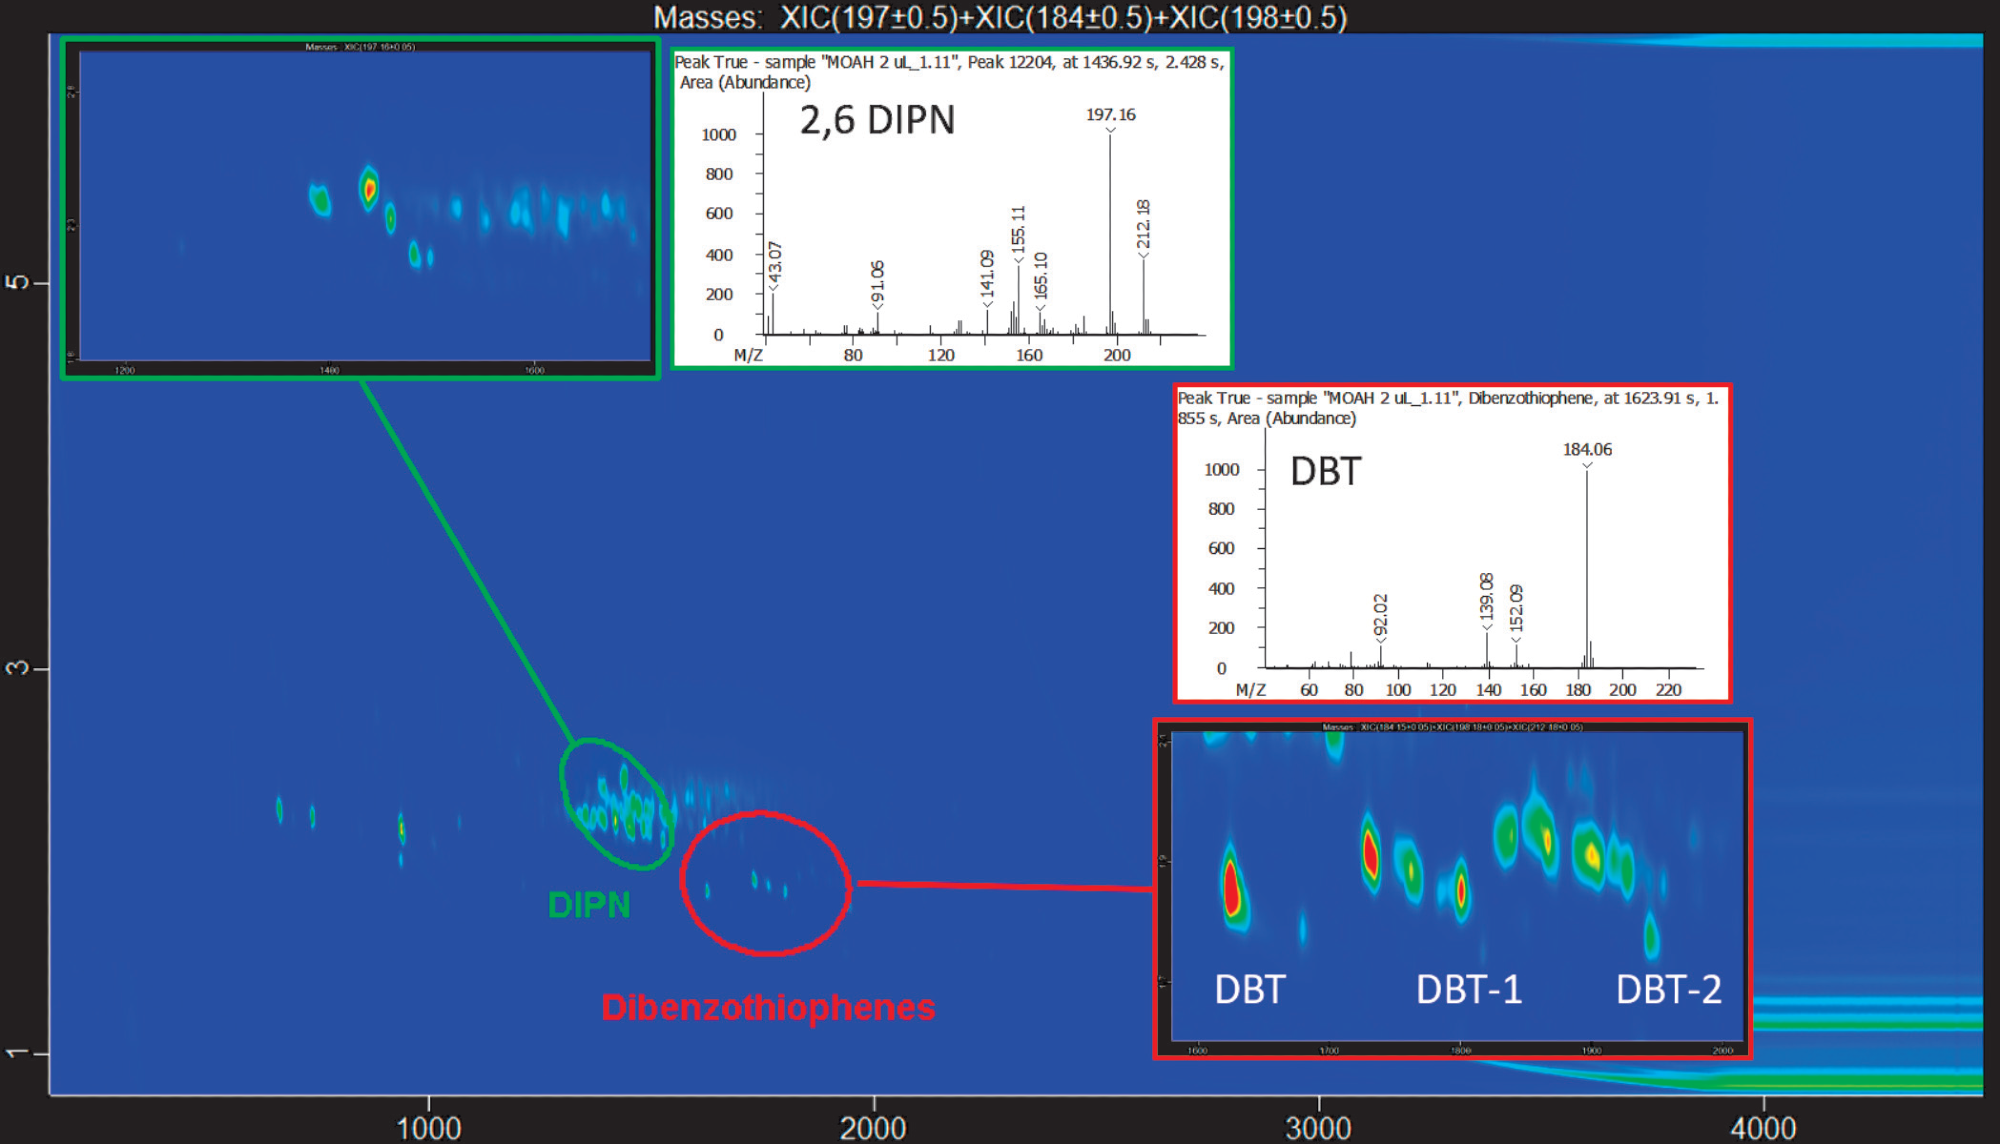
Figure 3. Detection and classification of the DIPN and Dibenzothiophene (DBT) in the MOAH fraction from cumin. Image Credit: LECO Corporation
The presence of the aromatic elements was confirmed along with these markers of contamination. For instance, Figure 4 depicts the classification of mono-, di- and tri- aromatic hydrocarbons in the MOAH fraction.
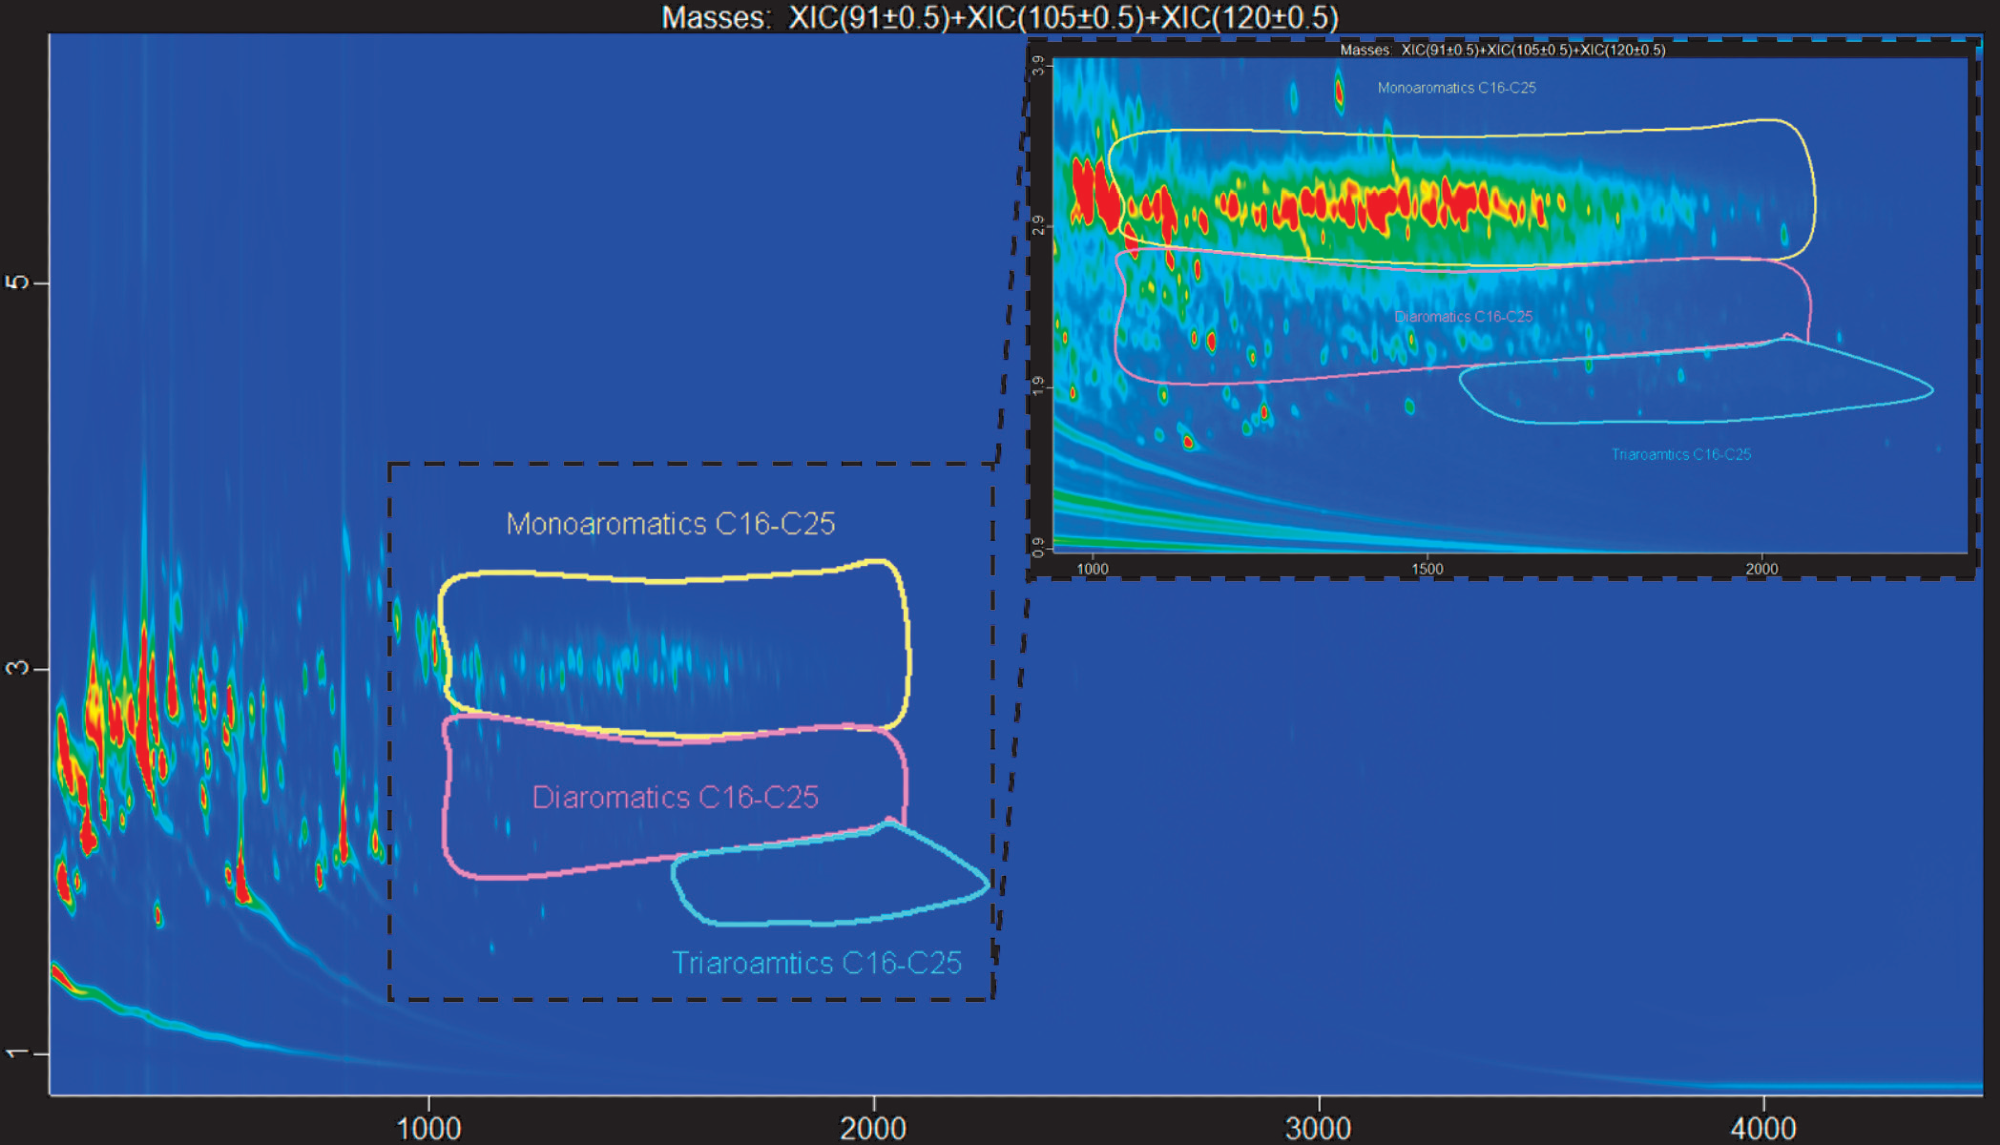
Figure 4. Detection and classification of mono-, di- and, tri- rings aromatics hydrocarbons within the cumin MOAH fraction. Image Credit: LECO Corporation
Automated detection of these chemical families was achieved using LECO’s ChromaTOF “Classifications” feature, where the chemical families were earlier established using the VGO-IS as a benchmark standard.
An extra group of substances was also detected — a kind of biogenic sesquiterpenes that normally occur in the cumin. For example, Figure 5 depicts the position of this group of substances in the contour plot. This lies partially overlapped with the monoaromatic fraction and the identification of one of the components encountered (γ-amorphene, 850/1000).
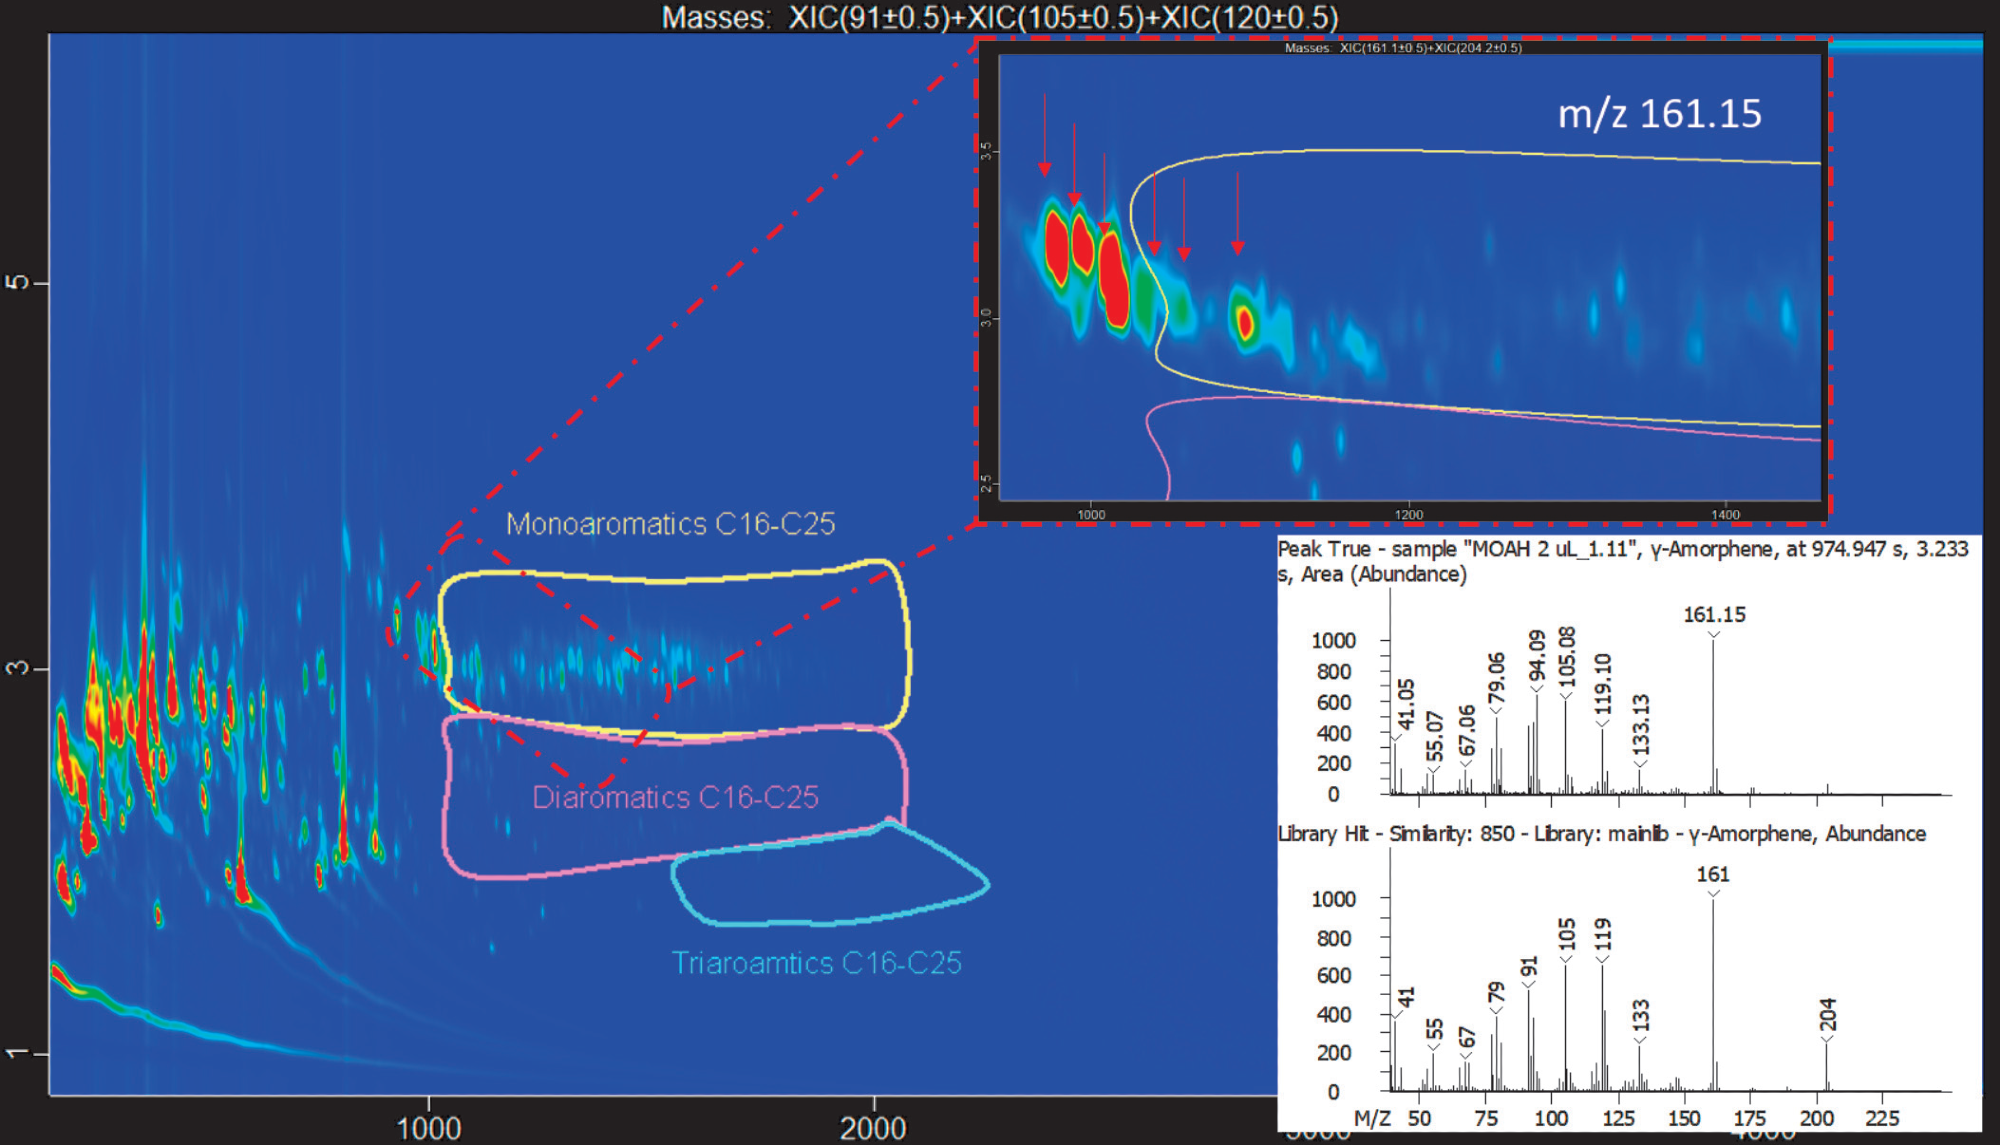
Figure 5. The red circled zone comprises some naturally occurring sesquiterpenes, such as the positively identified γ-amorphene. Image Credit: LECO Corporation
This data is a model of how the GCxGC technology, coupled with the power of LECO’s TOFMS, enhances the confidence of users when MOSH/MOAH samples are quantified and qualified.
Conclusions
This article has shown that LECO’s GCxGC-TOFMS technology is a hassle-free option to confirm the presence of MOSH/MOAH contaminants in food samples. In compliance with the EFSA recommendation, a confirmatory GCxGC-TOFMS analysis of the cumin extract has been executed.
This confirmed the presence of not only MOSH/MOAH contamination but also natural biogenic substances, which do not belong to these fractions and can potentially bias the quantitative results yielded with the traditional techniques.
Existing activities involve a broad range of difficult matrices, employing FID for quantification, and also based on the method explained. These are being executed and verified in tandem with further development and finalization of a customized software tool that can ensure an ideal and complete MOSH/MOAH analysis workflow.
References
- Scientific Opinion on Mineral Oil Hydrocarbons in Food (EFSA). EFSA Journal 2012;10(6):2704. 10.2903/j.efsa.2012.2704
- EFSA Technical Report. Rapid risk assessment on the possible risk for public health due to the contamination of infant formula and follow on formula by mineral oil aromatic hydrocarbons (MOAH). https://doi.org/10.2903/sp.efsa.2019.EN-1741

This information has been sourced, reviewed and adapted from materials provided by LECO Corporation.
For more information on this source, please visit LECO Corporation.