One analytical technique that has shown exceptional potential for both measuring and characterizing metal-containing nanoparticles (NPs) is single particle inductively coupled plasma mass spectrometry (SP-ICP-MS).
This technique is applicable to a diverse array of sample types, including environmental, biological and food samples.
Seawater’s high salt content makes it one of the most challenging matrices, causing serious difficulties in terms of NP analysis due to its potential for cone clogging and matrix suppression.
One simple means of avoiding these issues lies in the use of sample dilution prior to analysis, but this can prompt NP transformation due to changes in ionic strength and/or the seawater matrix’s organic content.
Rather, it is advisable to utilize a sample introduction system that is able to perform these dilutions milliseconds prior to the sample being nebulized into the ICP-MS.
It is also vital that the SP-ICP-MS system employed in monitoring NPs in seawater offers the characteristics necessary to ensure required analytical performance. These include:
- A sample introduction system capable of providing the continuous and high-throughput introduction of undiluted seawater into the ICP-MS
- An ICP-MS quadrupole mass analyzer and detector system that is able to operate under short dwell times (μs) and zero settling time
- Powerful data processing software that is able to automatically process single particle data in close to real-time
This article discusses a study designed to illustrate the capacity to measure and characterize silver (Ag) nanoparticles in seawater samples. These samples were acquired from tanks as part of a large-scale seawater mesocosm experiment.
Other than the seawater matrix, the primary challenge during this study stemmed from the time-sensitive nature of the sample analysis. Ag nanoparticles rapidly transform in seawater, meaning that samples must be analyzed immediately on arriving in the laboratory, with no prior dilution.
The ability to process SP data in close to real-time was essential in effectively monitoring the progress of the overall seawater mesocosm experiment and enabling researchers to take corrective action rapidly when required.
Experimental
Mesocosm Experiment
Samples were acquired from a mesocosm experiment exhibiting several similarities with the previously described experiment.1 Six mesocosm tanks were filled with 3000 L of seawater per tank. Three of these tanks acted as controls, while the other remaining three tanks were spiked daily with Ag NPs at 50 ng/L Ag.
The 60 nm Ag NP material utilized within this study was coated with branched polyethylenimine (BPEI). Seawater samples were acquired daily from each tank, just before the addition of ‘fresh’ Ag NP suspensions.
This process occurred every morning for ten consecutive days before samples were transferred to a laboratory for immediate analysis via SP-ICP-MS.
The 50 mL of seawater was collected daily from each mesocosm tank via silicone tubing that had been permanently situated at the center of each tank, between 1 m and 1.5 m beneath the water surface.
A large-volume syringe was employed in the creation of enough light suction to transfer seawater into sampling tubes via this tubing, with samples then moved to a laboratory for immediate analyses.
Following sampling, an Ag NP suspension (1 L of approximately 150 µg/L Ag, in line with the daily volume of each mesocosm tank) was added daily to each of the three mesocosm tanks via the seawater surface.
The seawater content of each tank was then gently mixed via the use of a dedicated paddle.
Instrumental Conditions
A modified version of the aforementioned sample introduction system was used in this study (Figure 1).2
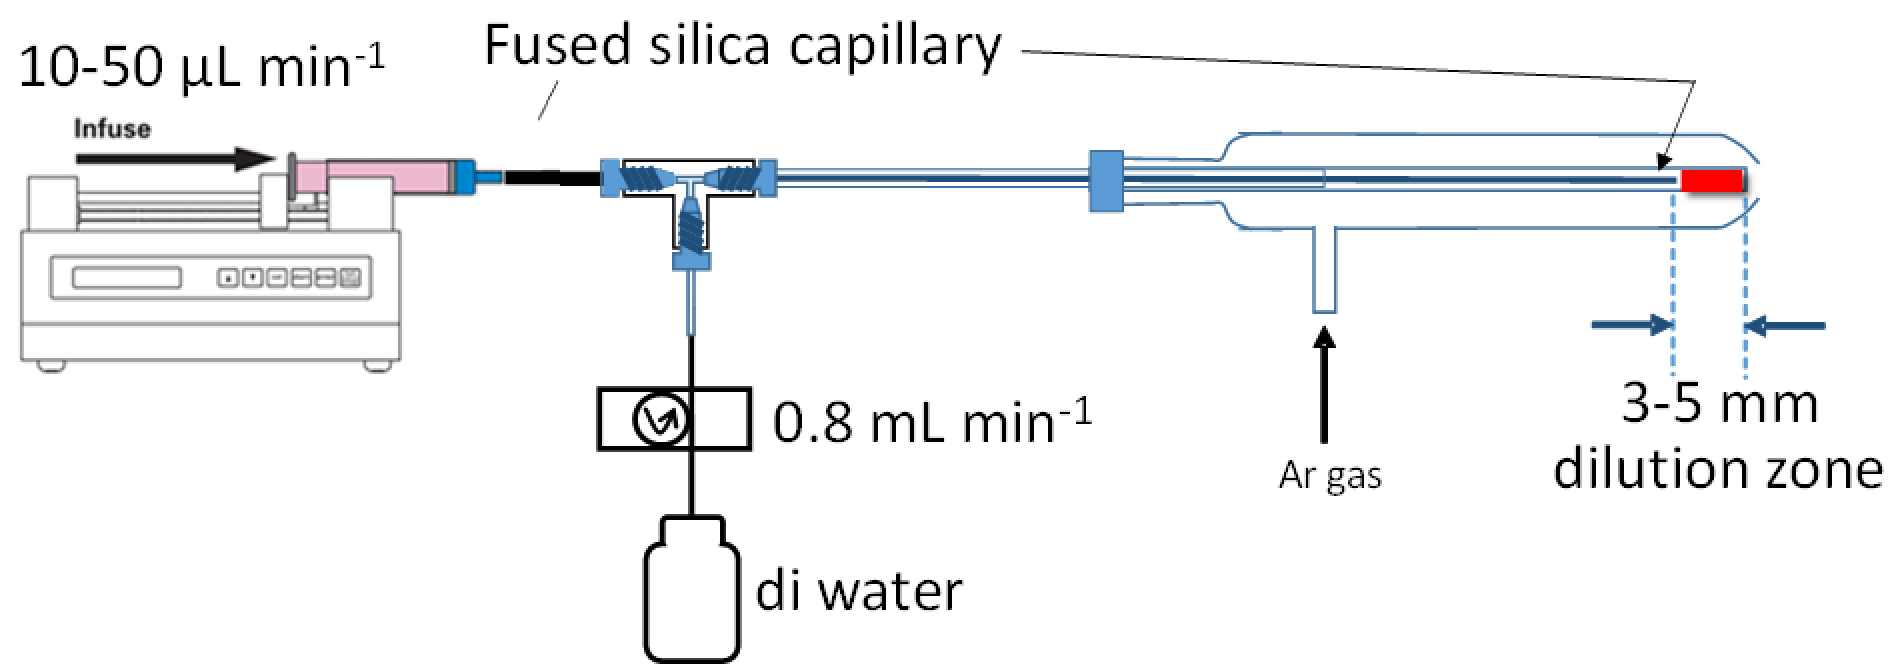
Figure 1. Sample introduction system used for the analysis of Ag NPs in seawater. Image Credit: PerkinElmer, Inc.
The modification in question used a syringe pump and a 500 µL glass syringe, eliminating the need to use a sample injection loop and, therefore, the chance of NP contamination.
This modified sample introduction system was highly efficient while simultaneously offering stability, versatility and ease of cleaning.
These factors afforded the system enhanced robustness and viability for continuous use in the high-throughput determination of NP in seawater samples.
Around 200 μL of each individual seawater sample was collected via a glass syringe and analyzed, with the syringe pump delivering the sample at a flow rate of 20 μL/min.
A T-piece at the tip of the pneumatic nebulizer was used to dilute samples 40x on-line, enabling the sample to be analyzed immediately and allowing no time for Ag NP transformation to take place. Due to dilution, mixing lasts for approximately 200 ms prior to nebulization.
Table 1. NexION ICP-MS Instrumental Parameters for the Determination of Ag NPs in Seawater. Source: PerkinElmer, Inc.
| Parameter |
Value |
Sample delivery rate
via syringe pump |
20 μL/min |
| Deionized water makeup rate via peristaltic pump |
800 μL/min |
| Nebulizer |
Glass Concentric MEINHARD® Type C modified with the insertion of a fused silica capillary (100 μm id, 200 μm od) via the central nebulizer channel (for details, see Figure 1) |
| Spray chamber |
Glass Cyclonic |
| RF power |
1600 W |
| Analyte |
107Ag |
| Analysis time |
2 x 3 min |
| Dwell time |
75 μsec |
A NexION® ICP-MS was utilized for all analyses, using the conditions provided in Table 1. A 75 µs dwell time was used, with data acquisition and analysis performed using the Syngistix™ Nano Application software module.
Samples and Standards
Daily seawater samples were acquired from the mesocosm tanks before being immediately transferred to a laboratory for analysis – 20 to 30 minutes travel time. No filtering or dilution of samples was conducted prior to the analysis via SP-ICP-MS.
This study utilized Ag NPs coated with branched polyethylenimine (BPEI) throughout, using these for both spiking the mesocosm seawater and preparing NP standards.
Ag BPEI NP standards were created by adding 100 ng of 60 nm Ag (Ag BPEI) NPs per L to a control seawater solution, corresponding to approximately 42000 Ag BPEI NPs per mL.
This standard was also analyzed immediately to mitigate the risk of NP dissolution (Figure 2). It was utilized to calibrate for Ag NP size and in conjunction with the counting approach to determine transport efficiency (TE).
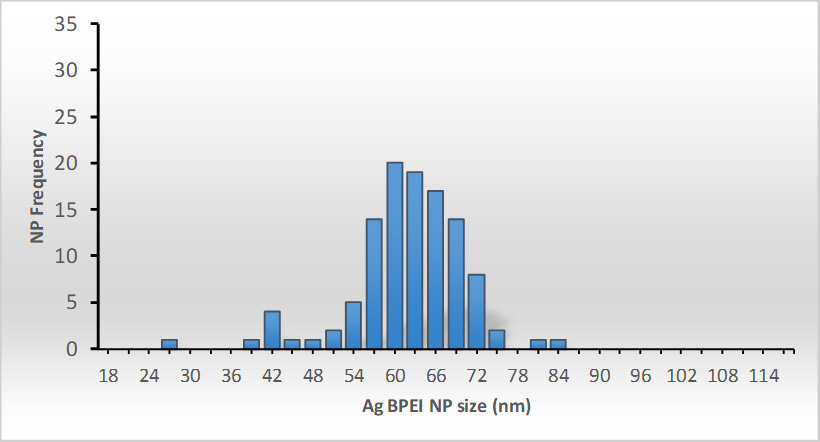
Figure 2. Ag BPEI NPs analyzed immediately after being added to control seawater to make a 100 ng/L Ag containing suspension. This suspension, made daily and immediately prior to sample analysis, was used as a particle calibration standard in the seawater matrix. Image Credit: PerkinElmer, Inc.
Results and Discussion
The results presented here correspond to the analysis of samples acquired from a seawater mesocosm tank. Ag BPEI NPs were introduced into this tank every morning for a total of 10 days.
These samples were taken daily before spiking the seawater with ‘fresh’ Ag NP suspensions.
Ag NPs in each spiking session resulted in the tank gaining a further 50 ng/L Ag each day for a total of 10 days, resulting in a total Ag concentration of 500 ng/L throughout the course of the experiment.
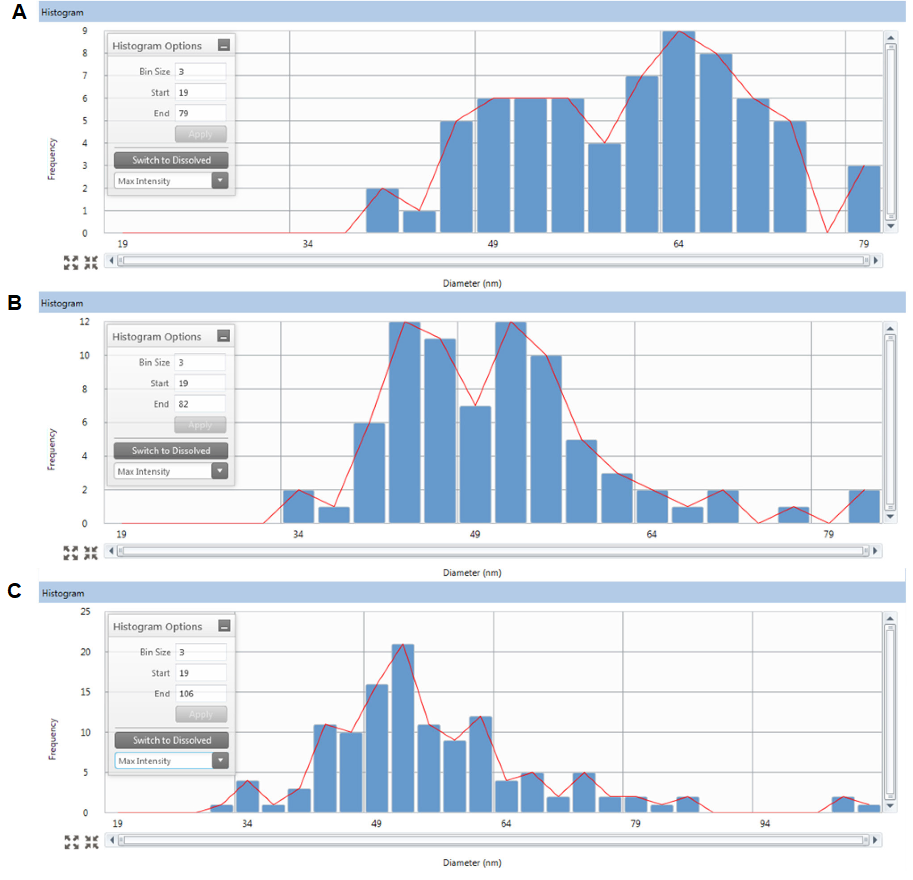
Figure 3. Ag NP size distributions as determined using SP-ICP-MS samples taken on day 0 + 2 hours (top-A), day 5 (center-B) and day 10 (bottom-C). Image Credit: PerkinElmer, Inc.
Figures 3A, 3B and 3C illustrate size (diameter) distributions for the Ag NPs in the tank. These measurements were taken on day 0 + 2 hours, on day 5 and on day 10, in line with the SP-ICP-MS setup displayed in Figure 1.
It is theorized that Ag NPs gradually dissolve into the tank, as illustrated by the appearance of smaller-sized Ag NPs over time.
The addition of daily ‘fresh’ Ag NP suspensions, therefore, contributes to the widening of the NP size distribution with a tendency towards higher sizes.
This results in much broader size distributions being observed the longer NPs are present in the seawater and subjected to continued spiking.
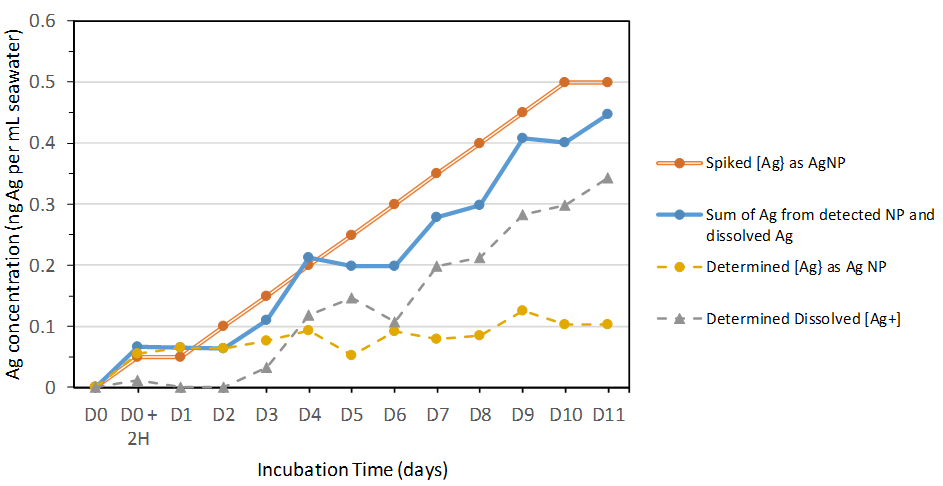
Figure 4. Mass balance diagram showing the levels of Ag spiked daily as Ag NPs, as well as the determined Ag corresponding to Ag NPs (yellow dotted line) and to dissolved Ag+ (grey dotted line). Finally, the sum of the latter two (NP Ag plus dissolved Ag - blue line) are compared to the daily Ag spike levels (orange double line). Image Credit: PerkinElmer, Inc.
Dissolved Ag (Ag+) sample content was also determined during SP-ICP-MS analysis, with dissolved Ag content increasing over the mesocosm experiment’s duration (Figure 4, dotted grey line) as anticipated.
It was also possible to investigate the system’s Ag mass balance using SP-ICP-MS, highlighting that the total Ag mass (blue line) corresponded to the sum of the detected Ag NP (yellow dotted line).
It was also determined that the mass corresponded to the dissolved Ag (grey line) and that this was in good agreement with the total Ag spiked into the mesocosm tank as Ag NPs (orange double line).
These results confirmed that the analytical system employed was able to account for almost all the Ag mass added to the seawater mesocosm tanks, despite this being partly transformed into dissolved Ag.
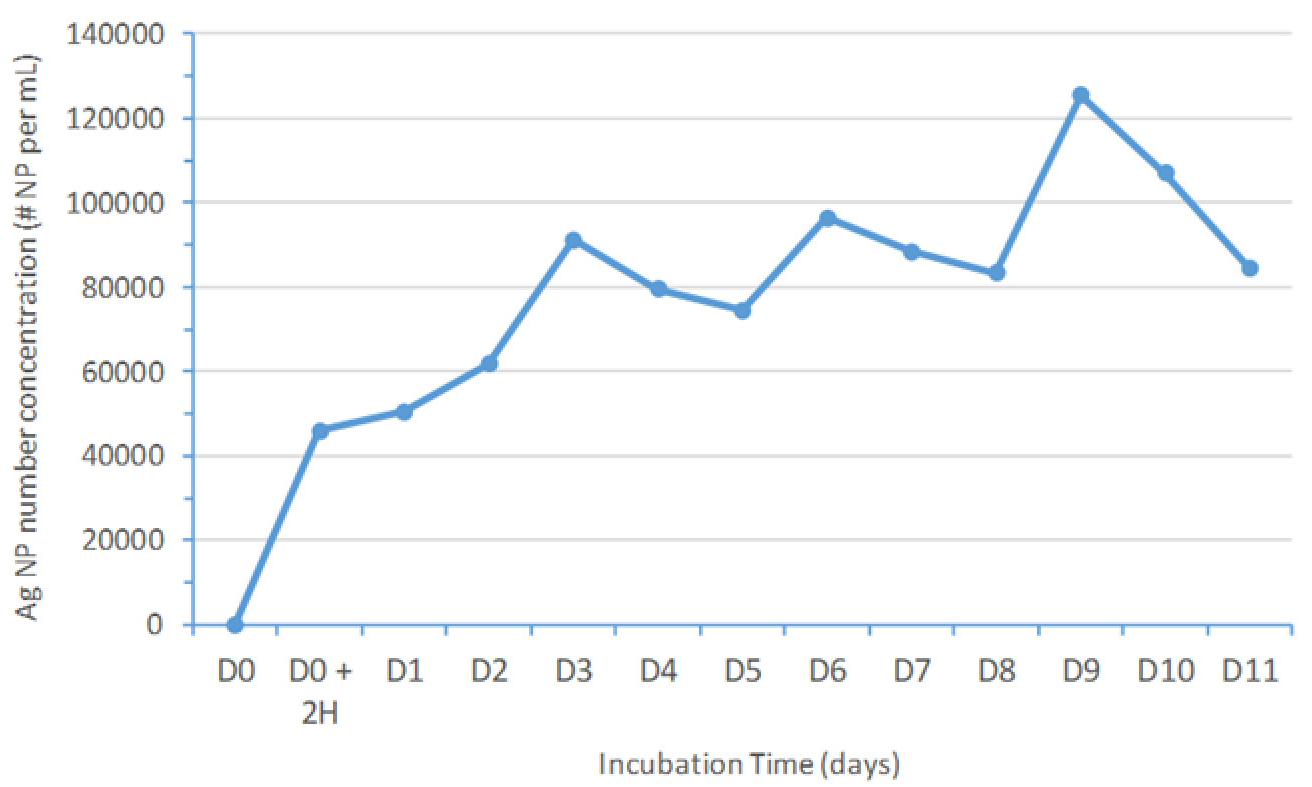
Figure 5. Ag NP number concentration variation with incubation time. On a daily basis, approximately 42000 Ag BPEI NP per mL with a diameter of 60 nm were added from day zero (D0) until day 10 (D10). Image Credit: PerkinElmer, Inc.
The SP-ICP-MS system’s unique capabilities also facilitated the determination of Ag NP number concentrations (Figure 5).
These appeared to demonstrate a net increase up to day 10 - the result of new Ag BPEI NPs being added daily at a higher rate than that of their dissolution.
The excellent stability and rapid computing power of this system cannot be overstated.
The full mesocosm experiment was conducted for 11 days and necessitated the analysis of nine samples per day, with the analysis performed three times per sample as well as calibration standards (particle standard in seawater and dissolved Ag standard in seawater).
The data processing was almost entirely provided in real-time, with seawater samples analyzed continuously throughout the day with no reduction in signal.
Monitoring results in an automated manner was essential for the success of this seawater experiment, which was performed in collaboration with an interdisciplinary team of chemists and marine biologists.
Conclusion
Advances in ICP-MS instrumentation and software enhanced the capacity of this technique and its ability to conduct single particle analysis in very difficult matrices such as seawater.
This has enabled large-scale experiments which would have been extremely challenging using manual data processing alone.
PerkinElmer’s single particle analysis software (Syngistix Nano Application module) can facilitate close to real-time data analysis, an essential capability when conducting large-scale incubation experiments like the one outlined here, with ‘fresh’ Ag NPs added daily.
References
- Tsiola, A.; Toncelli, C.; Fodelianakis, S.; Michoud, G.; Bucheli, T. D.; Gavriilidou, A.; Pitta, P. (2018). Low-dose addition of silver nanoparticles stresses marine plankton communities. Environmental Science: Nano, 5(8), 1965–1980. https://doi. org/10.1039/c8en00195b
- Toncelli, C.; Mylona, K.; Tsapakis, M.; Pergantis, S. A. (2016). Flow injection with on-line dilution and single particle inductively coupled plasma-mass spectrometry for monitoring silver nanoparticles in seawater and in marine microorganisms. Journal of Analytical Atomic Spectrometry, 31(7), 1430–1439. https://doi.org/10.1039/c6ja00011h
Acknowledgments
Produced from materials originally authored by Michail-Ioannis Chronakis, Emmanuil Mavrakis, and Spiros A. Pergantis from the University of Crete; Roberto R. Álvarez-Fernández García from the University of Oviedo and Chady Stephan from PerkinElmer Inc.

This information has been sourced, reviewed and adapted from materials provided by PerkinElmer, Inc.
For more information on this source, please visit PerkinElmer, Inc.