Often, urban areas suffer from poor air quality as a result of anthropogenic emissions of gases. These gases include SO2, NOx, as well as volatile organic compounds (VOCs). These substances are chemical precursors to aerosol and ozone particles, both linked to adverse health effects and environmental damage.

Image Credit: TOFWERK
In order to ensure that they remain under legally-defined limits, these key air pollutants are routinely monitored by the Swiss Ordinance on Air Pollution Control, which defines the limits in Switzerland.
Despite reductions due to vehicle emission control technologies, gasoline and diesel combustion engines remain a significant source of VOCs in cities. In addition, VOCs originating from cooking, paint, heating, solvents, and cleaning agents are gaining importance.
In order to develop a successful strategy to minimize human exposure, it is necessary to obtain detailed knowledge of VOC pollution and emission sources over time and space.
Automatic sampling onto absorption traps, subsequently followed by gas chromatographic separation as well as detection by mass spectrometry using photon, flame, or electron ionization, are all standard analytical methods for the determination of VOCs in air.
Time-averaged data is provided by these methods, which are limited to certain classes of VOCs depending on the choice of the detector and the pre-concentration/separation step. This naturally means that they are not ideal when fast continuous measurements are needed, i.e., for certain important compounds and locations.
Rapid and Consistent Measurements of Urban Organic Emissions
The Vocus CI-TOF mass spectrometer from TOFWERK quantitatively measures VOCs at concentrations well below 1 ppbv (when configured with PTR Reactor using H3O+ ionization). Time varying concentration of most urban VOC pollutants can be simultaneously reported with sub-second time resolution, as air is sampled directly without trapping.
Accurate molecular identification of targeted species is offered by the high mass resolving power of the Vocus. When the averaged values from the conventional measurement methods are insufficient and fast detection of transient pollutant plumes is required, deployment of the Vocus CI-TOF in cities is advantageous.
In the National Air Pollution Monitoring Network (NABEL) station at Bern-Bollwerk, one of the sixteen NABEL stations in Switzerland, TOFWERK deployed a Vocus CI-TOF. The Federal Office for the Environment and the Swiss Federal Laboratories for Materials Science and Technology (Empa) operate these stations.
The Bern-Bollwerk NABEL station experiences high emissions from road traffic and is in the immediate vicinity of a Bern train station.
It routinely measures NOx, CO2, CO, SO2, ozone, PM in addition to meteorological data, and operates a gas chromatograph (GC, Syntech Spectras Analyser GC955) for the measurement of benzene, toluene, and ethylbenzene/xylenes (BTX).
An Experimental Procedure
VOCs are enriched for 15 minutes on a sorption trap for the GC analysis to reach the limits-of-detection (LODs) of the method. The concentrated VOCs are separated by gas chromatography and analyzed by photoionization detection (GC-PID) after fast thermal desorption using clean N2 gas. The entire GC cycle takes 20. Sample for the next GC cycle is collecting during the GC separation, resulting in a net 5 minute sampling dead time across successive measurements.
The proton transfer reactor ionization (PTR, H3O+ reagent ions) was run with the Vocus CI-TOF mass spectrometer, ionizing and detecting all VOCs as a result of having proton affinity greater than water.
With a save rate of 1 mass spectrum every 0.5 seconds, data was continuously acquired. During the duration of each GC measurement, this corresponds to 1800 unique mass and 600 mass spectra during the 5 minute dead time.
Results
Regarding the first comparison, over the 15 minute trapping times of the GC, Vocus CI-TOF data was averaged (in post-processing) in order to produce a single mass spectrum per GC cycle. The Vocus data that was acquired during the dead time of the GC were ignored.
The resulting 12 day time series for BTX (benzene, toluene, and sum of xylenes and ethylbenzene) is shown in Figure 1, as measured by Vocus and GC. The most abundant aromatic volatile hydrocarbons in the urban atmosphere are BTX, of which benzene is known to cause damage to the immune system, worsen respiratory problems and increase the risk of cancer.
There is strong agreement between the averaged BTX concentrations reported by the Vocus CI-TOF and the GC. Note that a lower limit is represented by the Vocus CI-TOF in the xylenes values reported, since the known fragmentation of ethylbenzene was not taken into consideration.
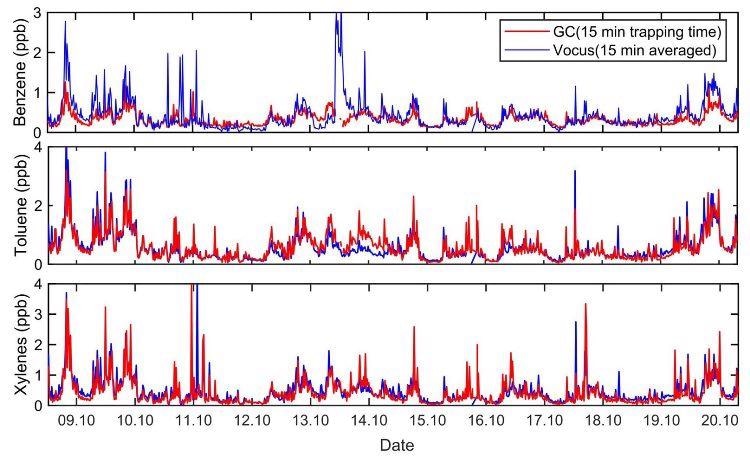
Figure 1. Figure 1 shows the comparison of GC and averaged Vocus CI-TOF time series for three VOCs (Benzene, Toluene and Xylenes) in downtown of Bern measured in October 2020. Image Credit: TOFWERK
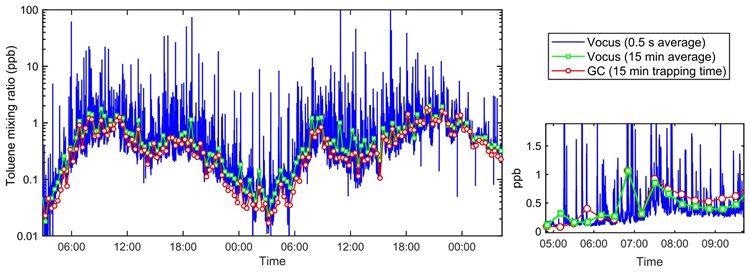
Figure 2. Toluene concentration as measured by GC (red circles) and Vocus CI-TOF (blue) in downtown of Bern. Image Credit: TOFWERK
Figure 2 displays the concentration of toluene for two consecutive days, as it has been measured by the Vocus CI-TOF with 0.5 second time resolution (blue). In addition, it displays the same data averaged to 15 minute time resolution to match the GC trapping time (green), and the GC measurements (red).
Traditionally, a 15 minute averaging is held to be a short-term measurement and is used to indicate short term exposure limits (STEL). It is revealed by the high time resolution of the Vocus data that the real peak concentrations reach up to 20 ppb – a value approximately twenty times greater than the 15 minute averaged peak values reported by the GC for toluene.
For the sum of xylenes, benzene, and tens of other potentially harmful VOCs, similar behavior was seen. Information loss, therefore, results from averaging over longer time periods.
It is shown by fast Vocus CI-TOF measurements that the VOC concentrations at this urban location are highly variable, which can indicate a significant difference in VOC emissions of individual vehicles on the road next to the sampling point. As they are closer to the emitting sources, exposure for pedestrians and cyclists may peak at even higher concentrations.
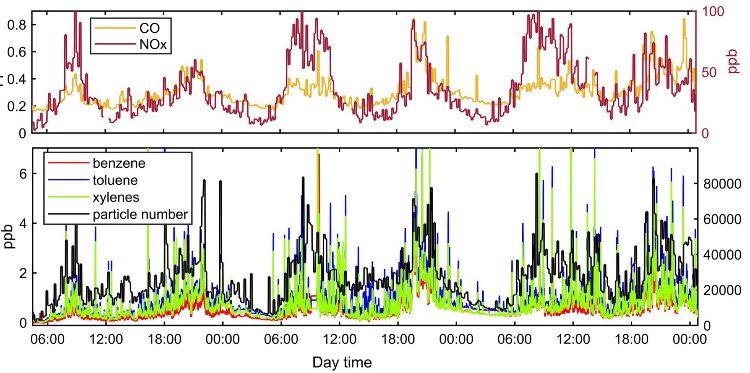
Figure 3. The (upper) measurement of CO and NOx during the measurement campaign in Bern Bollwerk. (Bottom) The concentration of BTX measured by Vocus CI-TOF and total particle number measured by CPC. Image Credit: TOFWERK
Figure 3 displays the time trends of BTX to the measurement of NOx, CO and total particle number with 1 minute time resolution. The Vocus data were also averaged to 1 minute. Similar origin and association with vehicular emissions dominating this location is indicated by the correlation between the daytime transient peaks reported by the Vocus CI-TOF and each of the key air pollutants shown in Figure 3.
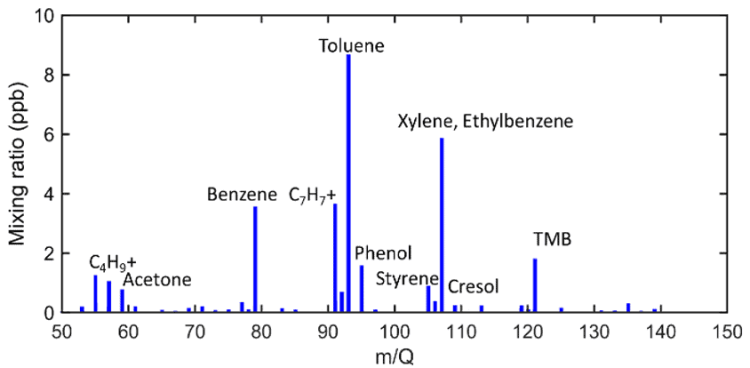
Figure 4A. Typical mass spectrum of a traffic air plume downtown Bern measured by Vocus CI-TOF. Image Credit: TOFWERK
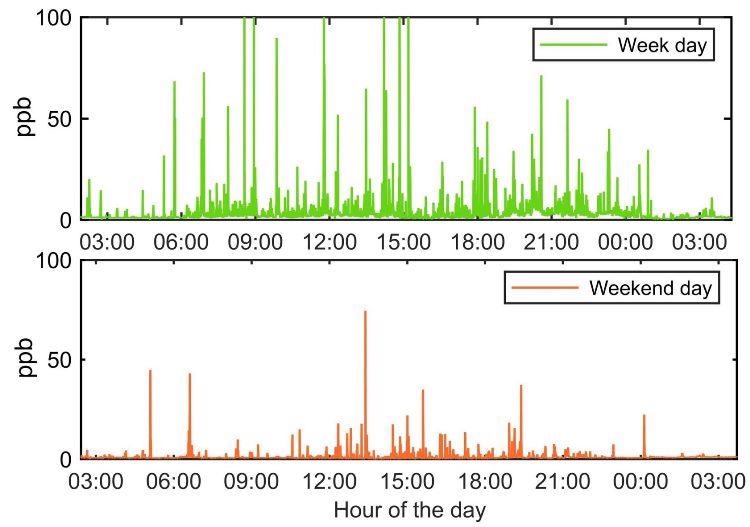
Figure 4B. Summed time series of the main volatile aromatic hydrocarbons (benzene, toluene, xylenes and trimethylbenzene) which were observed during week and weekend days in the air. Image Credit: TOFWERK
The mass spectrum of a typical air plume detected by the Vocus CI-TOF in downtown Bern is displayed by Figure 4A. It is easy to recognize the link between traffic emissions and direct car exhausts with the main peaks observed, such as benzene, toluene, xylene, trimethylbenzene or phenol.
The difference between the time trends in the sum of these main VOC pollutants during a weekday and a weekend day is presented by Figure 4B. It is possible to observe a clear rush-hour pattern as well as generally elevated concentrations during the weekday.
The public could minimize their exposure to harmful pollutants with a solid understanding and accessible presentation of these patterns. For instance, those with sensitive health conditions could manage their routines to avoid exposure at the worst times of day and, more generally, those exercising outdoors could avoid pollution hotspots 1.
Conclusion
Techniques with time resolution on the order of seconds are required for measuring peak pollution concentrations near sources in high-traffic regions. It has been demonstrated by these measurements with the Vocus CI-TOF at the Bern-Bollwerk NABEL station that peak concentrations of BTX can be greater than an order of magnitude higher than what is reported by current “short-time” measurements.
Traffic emissions should not present a health risk, according to current short-term exposure limits (STEL = 15 min). However, it must be noted that these 15 minute averaged concentrations can be significantly lower than peak concentrations. It is recognized by air pollution epidemiology, studies of exposure to toxic chemicals, and European regulatory authorities that both long-term exposure to lower concentrations and short-term exposure to high concentrations can negatively affect health, as well as the fact that the peak concentrations may be more important than the average exposure for certain chemicals2,3,4,5. More research is required to link health effects to peak exposure and average exposure to VOCs.
The Swiss Ordinance on Air Pollution Control states its purpose to be protecting the public not only from harmful pollution and annoying pollution as well: indeed, annoyance is much more related to peak values than to time-averaged values. This same effect is currently in discussion with Swiss noise regulation, in which legal noise levels are reduced by time-averaging and, as such, may no longer present a valid measurement for annoyance.
Finally, it must be noted that the measured BTX peak concentrations cannot explain the annoyance of traffic-related smells. The odor threshold for benzene is far higher than measured peak concentrations, at 1.5 ppmv. This means that there must be other compounds responsible for the unpleasant odors. Given that BTEX are usually the most abundant substances in traffic pollution, those compounds may occur in much lower concentrations. When it comes to the task of linking unpleasant odors to their compounds of origin and their emission sources, more research is required.
Matthias Hill and his coworkers at Empa are gratefully thanked for their collaboration regarding the placement of Vocus CI-TOF at the NABEL station in Bern Bollwerk as well as for providing the complementary monitoring data during Tofwerk’s campaign, which was collected at the station.
References
- Carlsten, C., Salvi, S. Wong, G.W.,K., Chung, K.F. Personal strategies to minimise effects of air pollution on respiratory health: advice for providers, patients and the public. European Respiratory Journal 55: 1902056, 2020.
- Hartwig, A., and MAK Commission. Peak limitation: Limitation of exposure peaks and short‐term exposures [MAK Value Documentation, 2011]. The MAK Collection for Occupational Health and Safety, 2(1), 2017.
- Manisalidis, I., Stavropoulou, E., Stavropoulos, A., Bezirtzoglou, E. Environmental and Health Impacts of Air Pollution: A Review. Frontiers in Public Health, 8(14), 2020.
- Bell, M. L., Peng, R.D., Dominici, F. The Exposure-Response Curve for Ozone and Risk of Mortality and the Adequacy of Current Ozone Regulations. Environmental Health Perspectives, 114(4), 2006.
- Dominici, F., Daniels, M., Zeger, S.L., Samet, J.M. Air Pollution and Mortality: Estimating Regional and National Dose-Response Relationships. Journal of the American Statistical Association, 97(457), 2002.

This information has been sourced, reviewed and adapted from materials provided by TOFWERK.
For more information on this source, please visit TOFWERK.