The Late Ordovician was characterized by glaciation, global cooling, and mass extinction. It was assumed that these events were triggered by increased delivery of the nutrient phosphorus (P). However, why this took place in two pulses is not yet clear. Looking at Longman, J. et al.'s journal paper, this article analyzes the connection between Late Ordovician marine productivity and cooling episodes to subaerial volcanic activity.
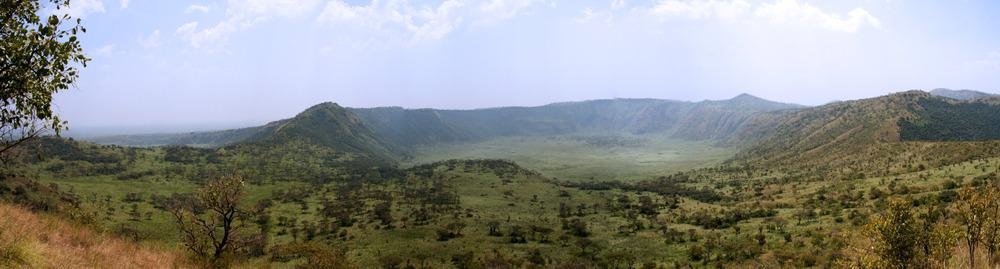
Image Credit: Nick Greaves/Shutterstock.com
The Late Ordovician mass extinction (LOME) took place in two phases and was the second-largest extinction event in Earth’s history in terms of species loss. The Late Ordovician is characterized by numerous carbon isotope excursions (CIEs)—two globally represented ones are the Guttenburg isotopic carbon excursion (GICE) at ~454 million years ago (Ma) and the Hirnantian isotopic carbon excursion (HICE) at ~445 Ma.
However, the major factor behind the CIEs and linked cooling is uncertain. It is assumed that the advent of early non-vascular land plants increased terrestrial weathering and also the delivery of the vital limiting nutrient phosphorus (P). The increased amount of P increases organic carbon burial and marine productivity, inducing a decrease in atmospheric CO2.
There are also other proposals, however, many observations support this concept of the Late Ordovician cooling triggered by organic carbon burial. But it is yet unclear why this took place in two distinct pulses during the GICE and HICE. This article investigates if Late Ordovician marine productivity and cooling episodes were directly related to subaerial volcanic activity. There are numerous records of volcanic eruptions in the Late Ordovician.
Recent studies use total organic carbon to mercury ratio to associate volcanic mercury emissions to Late Ordovician climatic change. It is also not known about the amount of P supplied from ash during the Late Ordovician or its influence on the marine environment. This study collates global data on P depletion in tephra layers as a means of quantifying P release to the ocean at the time of ash deposition and diagenesis.
Results
To analyze the timing of volcanic activity, 43 Ar-Ar, and U–Pb dates from North American and Scandinavian bentonites (see Figure 1a) and 24 dates from Chinese bentonites of the Late Ordovician age (see Figure 1b) were compiled. The reconstruction indicated the occurrence of bentonite deposition in two discrete pulses (see Figure 1c).
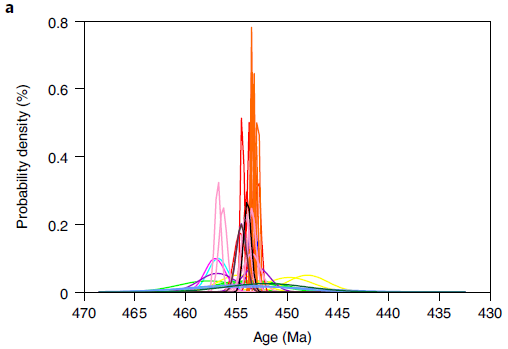
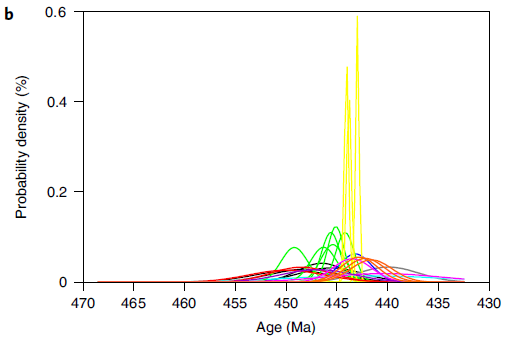
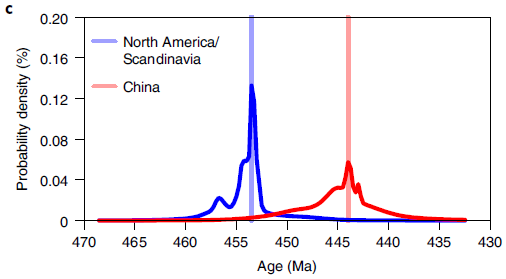
Figure 1. Compilation of Late Ordovician bentonite ages from North America and China. (a, b), Bentonite ages in North America/Scandinavia (a) and China (b). Each age is represented by a probability density curve derived from published mean and standard deviation, from which 10,000 Monte Carlo simulations were completed and binned at 0.25 Myr intervals to attain probability densities of the eruption occurring in each bin. Colors correspond to the studies from which each age is obtained. Average probability densities for each 0.25 Myr bin for the North American (blue) and Chinese (red) bentonites. Vertical lines indicate the bin in which bentonite deposition is most likely. Image Credit: Longman, et al., 2021
Figure 2 depicts the eruption of two geographically diverse volcanic provinces.
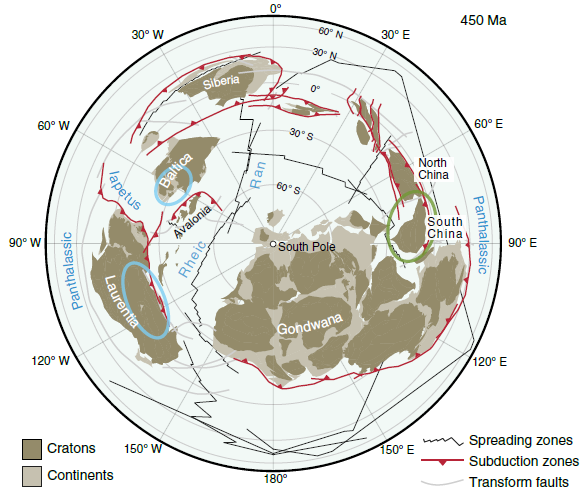
Figure 2. Palaeogeographic reconstruction for the Late Ordovician at ~450 Ma (Katian). Ellipses mark the two volcanic provinces investigated in this study, with blue ellipses representing the North American and Scandinavian provinces and a green ellipse representing the Chinese province. The base map was constructed using the plate tectonic reconstructions from Merdith, et al., 2021 and is based partly on Cocks, and Torsvik, 2020.
The first pulse indicates North American/Scandinavian volcanism and the Chinese bentonite ages showed more spread with less accurate dates. The compilation indicates that the most intense volcanism in the China region took place between 445.25Ma and 442.5Ma and the two volcanic pulses correlate to the two primary CIEs of the Late Ordovician, the GICE and HICE, and would thus assist a connection between volcanism and climate change.
To examine P release at the time of ash deposition, diagenesis, and weathering the amount of P supplied by the two key pulses of volcanism was estimated. Data from marine sediment-hosted tephras were examined and compared to data from eight additional modern volcanic provinces (see Figure 3).
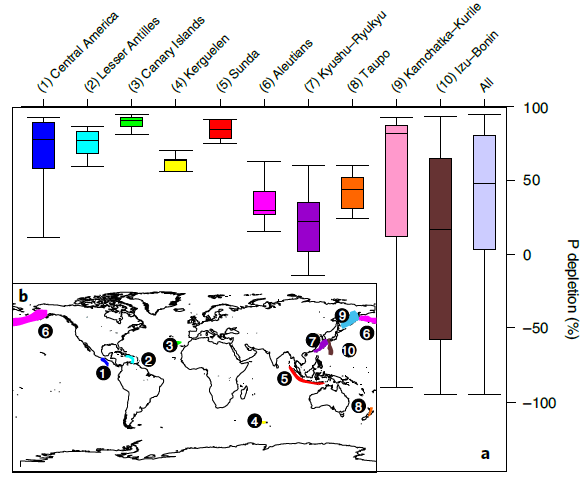
Figure 3. P depletion, an indicator of the amount of P lost to the ocean, from ten present-day representative volcanic provinces. (a) Boxes are defined between the first and third quartiles (the interquartile range), with minimum and maximum whiskers representative of 1.5 times the interquartile range. (b), A map of each volcanic province used for this reconstruction with the provinces identified by the numbers and colors used in a. Image Credit: Basemap from P. Wessel, University of Hawai’i, and W. H. F. Smith, NOAA Laboratory for Satellite Altimetry
The scale of P flux was estimated from a Monte Carlo simulation of inputs and was found that the annual P flux from diagenesis and ash deposition was 3 × 10¹⁰ mol P yr−1.
The depletion factors and analysis of ash supply in the Late Ordovician could be used for the quantification of P supply during the two investigated events. In the case of GICE, the simulations indicated a mean of 2.29 × 10¹⁵ mol P (see Figure 4), which increased further, and for the HICE, a mean supply of 2.89 × 10¹⁵ mol P was noted.
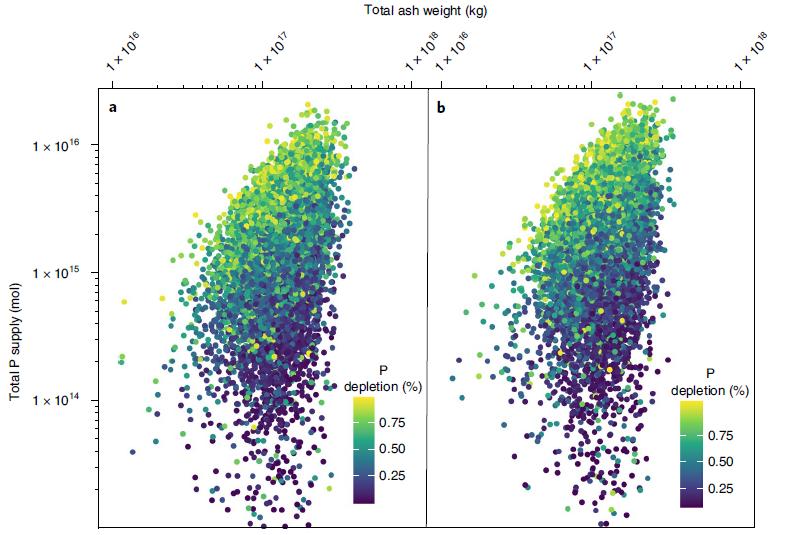
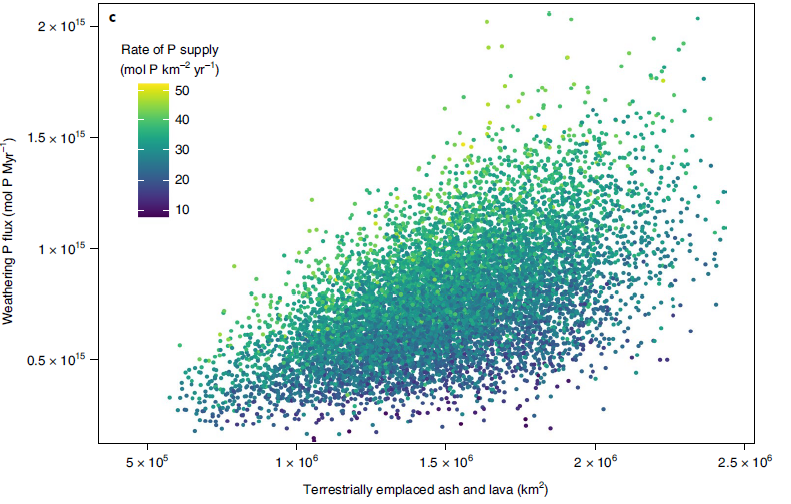
Figure 4. Monte Carlo simulations of P supply from volcanic weathering during the Late Ordovician with variable distributions defined by our ash-depletion and weathering model. (a, b), P supply from ash deposition and diagenesis for the two pulses of volcanism. Amount of P supplied from the volcanism at 453.5 Ma (a) and 444 Ma (b). The total ash weight is presented along the x-axis and the total P supply on the y axis. Each Monte Carlo simulation is indicated by a circle with the color indicating the depletion factor. (c), Estimate of P flux resulting from weathering of terrestrial volcanic matter (y-axis) plotted against the area covered by this ash and lava. Again, each simulation is indicated by a filled circle with the color in this case denoting the rate of P supply. Image Credit: Longman, et al., 2021
Weathering flux of P was estimated and the GICE and HICE P inputs were represented by Gaussian functions with their maxima at the times of greatest depositional intensity. The total P input is evaluated for both the means and 95th percentiles. As the COPSE model does not indicate the feedbacks well, it was concluded that a fivefold-larger P input is needed in COPSE to generate the same spike in marine P concentration seen in the multi-box model.
Figure 5 indicates the model outputs for average surface temperature, atmospheric CO2, marine anoxia, and δ13C of novel sedimentary carbonates.
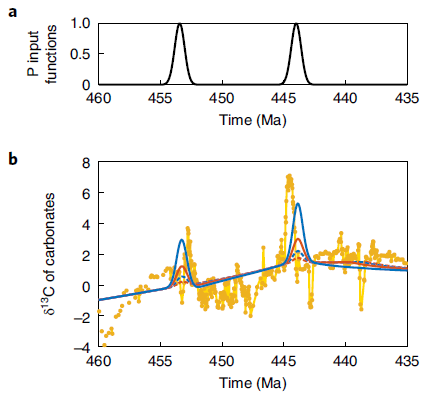
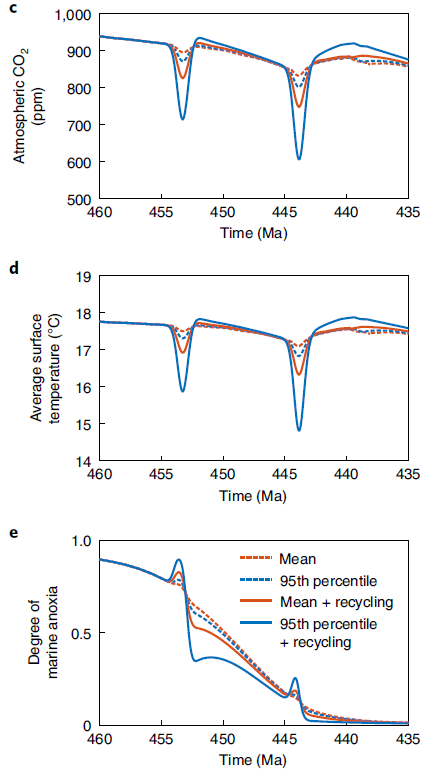
Figure 5. Biogeochemical model outputs for impacts of volcanism during the GICE and HICE. COPSE model baseline runs38 plus P supply from ash. (a) The P input Gaussian functions. The P input magnitude follows the mean or 95th percentile of the values derived for ash supply and weathering combined, with or without recycling of P from sediments. (b) Modeled δ13C of carbonates (lines and colors defined in e) compared with data49 (yellow circles). (c) Modeled atmospheric CO2. (d) Modeled global average surface temperature. (e) Degree of marine anoxia (represented as the modeled proportion of anoxic seafloor). Solid lines show the same simulations as the dashed lines but with additional P input to represent sedimentary recycling of P. Image Credit: Longman, et al., 2021
The outputs indicate that the P release from volcanic ash deposition and weathering, along with the recycling of P from sediments, is adequate to trigger big changes in climate and biogeochemistry as seen in the geological record. The maximum global cooling at the HICE is approximately 3 °C.
The temperature predictions are in accordance with clumped isotope thermometry indicating that the Hirnantian icehouse was relatively short. A key feature of the HICE in the geological record is the extensive formation of organic-rich shales—particularly in China—potentially associated with widespread ocean anoxia.
The observations indicate that volcanic ash diagenesis and weathering performed a major role in the Late Ordovician Earth system. The results might detail various features of the LOME that do not follow trends linked with other mass extinctions particularly the association to cooling instead of warming.
In the Late Ordovician, it seems that the lasting nature of nutrient supply from weathering of eruptive products such as volcanic ash performs a more dominant role compared to the medium-term warming linked with CO2 injection. The super-eruptions indicated by bentonites would have led to initial cooling, followed by warming. These warming/cooling cycles are dangerous for organisms resulting in biodiversity loss explaining the LOME initiation.
Along with nutrients, there is also a possibility of toxic metal release. This is indicated by the evidence for metal-induced malformations in the Hirnantian glaciation. Volcanic ash would have led to the formation of anoxic conditions which further enhanced redox-based recycling of toxic metals.
Methodology
Tephra layers were investigated for their major elemental content—including P content. Tephras were pinpointed visually and microscopically and P was estimated in the layers. The GEOROC database was employed to evaluate the protolith composition of volcanic material from the source regions. The data was filtered and the original composition of altered tephra was calculated along with depletion factors.
Monte Carlo simulations of variables linked with bentonite deposition were employed to evaluate the size of the volcanic eruptions and ash deposition. The study used a state-of-the-art COPSE biogeochemical model.
Conclusion
With the results obtained it was evident that the pulsed nature of global cooling was the result of the eruption of two diverse volcanic provinces—North America and the Baltic and Southern China. The proposed models indicate the deposition of ash blankets and weathering of lavas during Late Ordovician volcanism provided sufficient P to trigger glaciation, global cooling, and the LOME.
Journal Reference:
Longman, J., Mills, B. J. W., Manners, H. R., Gernon, T. M., Palmer, M. R. (2021) Late Ordovician climate change and extinctions driven by elevated volcanic nutrient supply. Nature Geoscience, 14, pp. 924–929. Available online: https://www.nature.com/articles/s41561-021-00855-5.
References and Further Reading
- Harper, D. A. T., et al. (2014) End Ordovician extinctions: a coincidence of causes. Gondwana Research, 25, pp. 1294–1307. doi.org/10.1016/j.gr.2012.12.021.
- Bambach, R. K., et al. (2004) Origination, extinction, and mass depletions of marine diversity. Paleobiology, 30, 522–542.
- Rasmussen, C. M. Ø., et al. (2019) Cascading trend of Early Paleozoic marine radiations paused by Late Ordovician extinctions. Proceedings of the National Academy of Sciences, 116, pp. 7207–7213. doi.org/10.1073/pnas.1821123116.
- Bergström, S. M., et al. (2010) The Upper Ordovician Guttenberg δ13C excursion (GICE) in North America and Baltoscandia: occurrence, chronostratigraphic significance, and paleoenvironmental relationships. Geological Society of America, 466, pp. 37–67. doi.org/10.1130/2010.2466(04).
- Metzger, J. G., et al. (2020) New age constraints on the duration and origin of the Late Ordovician Guttenberg δ13Ccarb excursion from high-precision U–Pb geochronology of K-bentonites. GSA Bulletin. doi.org/10.1130/B35688.1.
- Finnegan, S., et al. (2011) The magnitude and duration of Late Ordovician-Early Silurian glaciation. Science, 331, pp. 903–906. doi.org/10.1126/science.1200803.
- Ainsaar, L., et al. Middle and Upper Ordovician carbon isotope chemostratigraphy in Baltoscandia: a correlation standard and clues to environmental history. Palaeogeography, Palaeoclimatology, Palaeoecology, 294, pp. 189–201. doi.org/10.1016/j.palaeo.2010.01.003.
- Lenton, T. M., et al. (2012) First plants cooled the Ordovician. Nature Geoscience, 5, pp. 86–89. doi.org/10.1038/ngeo1390.
- Mills, B., et al. (2019) Modeling the long-term carbon cycle, atmospheric CO2, and Earth surface temperature from late Neoproterozoic to present day. Gondwana Research, 67, pp. 172–186. doi.org/10.1016/j.gr.2018.12.001.
- Shen, J., et al. (2018) Improved efficiency of the biological pump as a trigger for the Late Ordovician glaciation. Nature Geoscience, 11, pp. 510–514. doi.org/10.1038/s41561-018-0141-5.
- Swanson-Hysell, N L & Macdonald, F A (2017) Tropical weathering of the Taconic orogeny as a driver for Ordovician cooling. Geology, 45, pp. 719–722. doi.org/10.1130/G38985.1.
- Bartlett, R., et al. Abrupt global-ocean anoxia during the Late Ordovician–Early Silurian detected using uranium isotopes of marine carbonates. Proceedings of the National Academy of Sciences, 115, pp. 5896–5901. doi.org/10.1073/pnas.1802438115.
- Morris, J. L., et al. (2018) The timescale of early land plant evolution. Proceedings of the National Academy of Sciences, 115, pp. E2274–E2283. doi.org/10.1073/pnas.1719588115.
- . Buggisch, W., et al. (2010) Did intense volcanism trigger the first Late Ordovician icehouse? Geology, 38, pp. 327–330. doi.org/10.1130/G30577.1.
- Herrmann, A. D., et al. (2011) Did intense volcanism trigger the first Late Ordovician icehouse? Geology, 39, pp. e237–e237. doi.org/10.1130/G30577.1.
- Huf, W. D., et al. (2010) Ordovician explosive volcanism. Geological Society of America Special Papers, 466, pp. 13–28. doi.org/10.1130/2010.2466(02).
- Tao, H., et al. (2019) Volcanic activities triggered the first global cooling event in the Phanerozoic. Journal of Asian Earth Sciences. doi.org/10.1016/j.jseaes.2019.104074.
- Huf, W. D., et al. (1996) Large-magnitude Middle Ordovician volcanic ash falls in North America and Europe: dimensions, emplacement and post-emplacement characteristics. Journal of Volcanology and Geothermal Research, 73, pp. 285–301. doi.org/10.1016/0377-0273(96)00025-X.
- Sell, B. K., et al. (2015) Stratigraphic correlations using trace elements in apatite from Late Ordovician (Sandbian-Katian) K-bentonites of eastern North America. Geological Society of American Bulletin, 127, pp. 1259–1274. doi.org/10.1130/B31194.1.
- Ballo, E. G., et al. (2019) A new age model for the Ordovician (Sandbian) K-bentonites in Oslo, Norway. Palaeogeography, Palaeoclimatology, Palaeoecology, 520, pp. 203–213. doi.org/10.1016/j.palaeo.2019.01.016.
- Liu, W., et al. (2020) K-bentonites in Ordovician-Silurian transition from South China: implications for tectonic evolution in the northern margin of Gondwana. Journal of the Geological Society, 177, pp. 1245–1260. doi.org/10.1144/jgs2020-049.
- Smolarek-Lach, J., et al. (2019) Mercury spikes indicate a volcanic trigger for the Late Ordovician mass extinction event: an example from a deep shelf of the peri-Baltic region. Scientific Reports, 9, p. 3139. doi.org/10.1038/s41598-019-39333-9.
- Jones, D. S., et al. (2017) A volcanic trigger for the Late Ordovician mass extinction? Mercury data from South China and Laurentia. Geology, 45, pp. 631–634. doi.org/10.1130/G38940.1.
- Longman, J., et al. (2019) The role of tephra in enhancing organic carbon preservation in marine sediments. Earth-Science Reviews, 192, pp. 480–490. doi.org/10.1016/j.earscirev.2019.03.018.
- Jones, M T & Gislason, S R (2008) Rapid releases of metal salts and nutrients following the deposition of volcanic ash into aqueous environments. Geochimica et Cosmochimica Acta, 72, pp. 3661–3680. doi.org/10.1016/j.gca.2008.05.030.
- . Sell, B., et al. (2013) Precise timing of the Late Ordovician (Sandbian) super-eruptions and associated environmental, biological, and climatological events. Journal of the Geological Society, 170, pp. 711–714. doi.org/10.1144/jgs2012-148.
- Tucker, R D & McKerrow, W S (1995) Early Paleozoic chronology: a review in light of new U–Pb zircon ages from Newfoundland and Britain. Canadian Journal of Earth Sciences, 32, pp. 368–379. doi.org/10.1139/e95-032.
- Ling, M. X., et al. (2019) An extremely brief end Ordovician mass extinction linked to abrupt onset of glaciation. Solid Earth Sciences, 4, pp. 190–198. doi.org/10.1016/j.sesci.2019.11.001.
- Du, X., et al. (2020) Was volcanic activity during the Ordovician-Silurian transition in South China part of a global phenomenon? Constraints from zircon U–Pb dating of volcanic ash beds in black shales. Marine and Petroleum Geology, 114, p. 104209. doi.org/10.1016/j.marpetgeo.2019.104209.
- Lee, C.-T. A., et al. (2018) Volcanic ash as a driver of enhanced organic carbon burial in the Cretaceous. Scientific Reports, 8, p. 4197. doi.org/10.1038/s41598-018-22576-3.
- Gudmundsson, M. T., et al. (2012) Ash generation and distribution from the April-May 2010 eruption of Eyjafallajökull, Iceland. Scientific Reports, 2, p. 572. doi.org/10.1038/srep00572.
- Laeger, K., et al. (2017) High-resolution geochemistry of volcanic ash highlights complex magma dynamics during the Eyjafallajökull 2010 eruption. American Mineralogist, 102, pp. 1173–1186. doi.org/10.2138/am-2017-5860.
- Paytan, A & McLaughlin, K (2007) The oceanic phosphorus cycle. Chemical Reviews. 107, pp. 563–576. doi.org/10.1021/cr0503613.
- Cao, W., et al. (2017) Episodic nature of continental arc activity since 750 Ma: a global compilation. Earth and Planetary Science Letters, 461, pp. 85–95. doi.org/10.1016/j.epsl.2016.12.044
- . Mills, B. J. W., et al. (2017) Elevated CO2 degassing rates prevented the return of Snowball Earth during the Phanerozoic. Nature Communications, 8, p. 1110. doi.org/10.1038/s41467-017-01456-w.
- Dessert, C., et al. (2003) Basalt weathering laws and the impact of basalt weathering on the global carbon cycle. Chemical Geology, 202, pp. 257–273. doi.org/10.1016/j.chemgeo.2002.10.001.
- Dessert, C., et al. (2001) Erosion of Deccan Traps determined by river geochemistry: impact on the global climate and the 87Sr/86Sr ratio of seawater. Earth and Planetary Science Letters, 188, pp. 459–474. doi.org/10.1016/S0012-821X(01)00317-X.
- Tostevin, R & Mills, B J W (2020) Reconciling proxy records and models of Earth’s oxygenation during the Neoproterozoic and Palaeozoic. Interface Focus, 10, p. 20190137. doi.org/10.1098/rsfs.2019.0137.
- Slomp, C P & Van Cappellen, P (2007) The global marine phosphorus cycle: sensitivity to oceanic circulation. Biogeosciences, 4, pp. 155–171. doi.org/10.5194/bg-4-155-2007.
- Hallam, A (1992) Phanerozoic Sea-Level Changes (Columbia Univ. Press).
- Walker, L. J., et al. (2002) Continental drift and Phanerozoic carbonate accumulation in shallow-shelf and deep-marine settings. Journal of Geology, 110, pp. 75–87. doi.org/10.1086/324318.
- Alcott, L. J., et al. (2019) Stepwise Earth oxygenation is an inherent property of global biogeochemical cycling. Science, 366, pp. 1333–1337. doi.org/10.1126/science.aax6459.
- Berner, R A (1991) A model for atmospheric CO2 over Phanerozoic time. American Journal of Science, 291, pp. 339–376. doi.org/10.2475/ajs.301.2.182.
- Witkowski, C. R., et al. (2018) Molecular fossils from phytoplankton reveal secular pCO2 trend over the Phanerozoic. Science Advances, 4, p. eaat4556. doi.org/10.1126/sciadv.aat4556.
- Goldberg, S. L., et al. (2021) A high-resolution record of early Paleozoic climate. Proceeding of the National Academy of Sciences, 118, p. e2013083118. doi.org/10.1073/pnas.2013083118.
- Zou, C. et al. Organic-matter-rich shales of China. Earth-Science Reviews, 189, pp. 51–78. doi.org/10.1016/j.earscirev.2018.12.002.
- Su, W., et al. (2009) K-bentonite, black-shale and fysch successions at the Ordovician-Silurian transition, South China: possible sedimentary responses to the accretion of Cathaysia to the Yangtze Block and its implications for the evolution of Gondwana. Gondwana Research, 15, pp. 111–130. doi.org/10.1016%2Fj.gr.2008.06.004.
- LaPorte, D. F., et al. (2009) Local and global perspectives on carbon and nitrogen cycling during the Hirnantian glaciations. Palaeogeography, Palaeoclimatology, Palaeoecology, 276, pp. 182–195.
- Saltzman, M R & Tomas, E (2012) The Geologic Time Scale 2012 (eds Gradstein, F. M., et al.) Ch. 11.
- Sobolev, S. V., et al. (2011) Linking mantle plumes, large igneous provinces and environmental catastrophes. Nature, 477, pp. 312–316. doi.org/10.1038/nature10385.
- Black, B. A. et al. (2018) Systemic swings in end-Permian climate from Siberian Traps carbon and sulfur outgassing. Nature Geoscience, 11, pp. 949–954. doi.org/10.1038/s41561-018-0261-y.
- Schoene, B., et al. (2010) Correlating the end-Triassic mass extinction and food basalt volcanism at the 100 ka level. Geology, 38, pp. 387–390. doi.org/10.1130/G30683.1.
- . Fan, J. X. et al. (2020) A high-resolution summary of Cambrian to Early Triassic marine invertebrate biodiversity. Science, 367, pp. 272–277. doi.org/10.1126/science.aax4953.
- Vandenbroucke, T. R. A., et al. (2015) Metal-induced malformations in early Palaeozoic plankton are harbingers of mass extinction. Nature Communications, 6, p. 7966. doi.org/10.1038/ncomms8966.
- Merdith, A. S., et al. (2021) Extending full-plate tectonic models into deep time: linking the Neoproterozoic and the Phanerozoic. Earth-Science Reviews, 214, p. 103477. doi.org/10.1016/j.earscirev.2020.103477.
- Cocks, L R M & Torsvik, T H (2020) Ordovician palaeogeography and climate change. Gondwana Research. doi.org/10.1016/j.gr.2020.09.008.