Urbanization has led to drastic changes to hydrologic systems due to the replacement of vegetated areas with impervious surfaces, modification of overall water and sediment budgets, and a decrease in stream complexity.

Image Credit: Aleksandrs Muiznieks/Shutterstock.com
An increase in impervious surfaces causes more stormwater runoff, carrying pollutants (such as sediments, metals, and nutrients) from built surfaces into adjacent water bodies and eventually to larger watersheds.
Stormwater runoff causes major issues such as flooding, impaired water quality, and eroded stream banks. Managing stormwater runoff is crucial to improve water quality, ensure healthier communities, and avoid urban flooding. Although the mitigation of urban impacts on hydrology has always depended on engineered solutions, recent strategies have led to innovations combining nature-based solutions and ecological design in cities.
Trees and forests exhibit hydrological functions that minimize stormwater runoff, lower flooding risk, and enhance water quality in developed areas. Standard types of green stormwater infrastructure include rain gardens, green roofs, rainwater harvesting systems, bioretention systems, bioswales, and permeable pavement.
Green stormwater infrastructure is engineered to mitigate urban water quantity and quality issues by groundwater recharge, flood control, and bioretention. However, it can also support secondary ecosystem services such as biodiversity enhancement, carbon sequestration, optimization of human well-being, climate change adaptation, and optimized socio-ecological connectivity.
Urban forests and trees can serve several of these ecosystem services and manage stormwater by various ecohydrological mechanisms such as evaporation, transpiration, stormwater storage in the soil, interception of runoff, stemflow, and throughfall.
Ponte, S. et al.'s study identifies whether transpiration rates of urban trees of the same species differ based on various management contexts and whether the relationship between transpiration and environmental drivers varies in these contexts. Management context was used to mean different urban tree configurations in relation to ground cover, canopy structure, stem density, and location in the built environment that would impact sap flux density.
Results
Microclimate data were collected from June to November 2018. As shown in Figures 1a and 1b, for the study sites, the main everyday air temperature varied from 6 °C to 30 °C and the average temperature across the entire period was 22 °C. Figures 1c and 1d show that for the closed canopy site, the average relative humidity was 78.1%, and for the single and cluster sites, it was 78.4%.
The estimated VPD varied from 0.03 to 1.9 kPa, where the average estimated VPD was 0.67 kPa for the study sites (see Figure 1e,f). During the study period, the total amount of rainfall for the closed canopy site was 284 mm, and for the single and cluster sites, it was 251 mm.
For the single, cluster, and closed canopy sites, the average daily soil moisture varied from 16%–45%, 19%–39%, and 14%–40%, respectively (Figure 1i,j). Table 1 illustrates the average soil moisture content for the single, cluster, and closed canopy sites, which were 30.6%, 27.7%, and 29.8%, respectively.
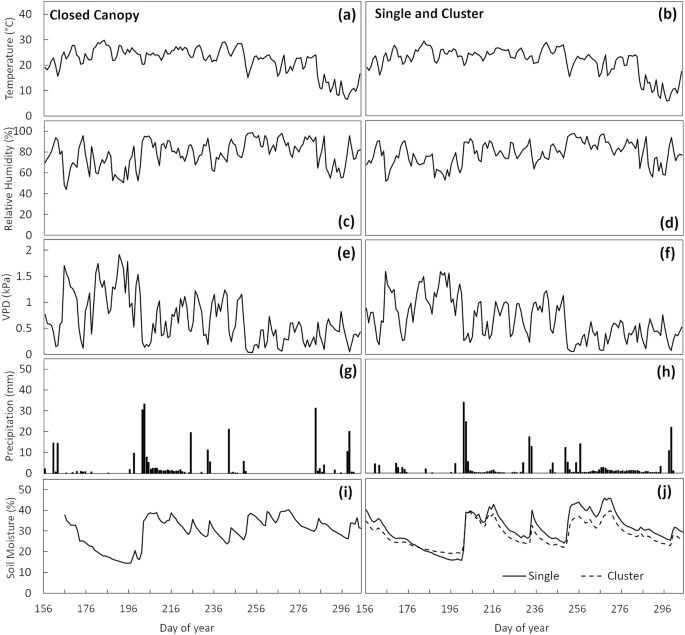
Figure 1. Microclimate in Baltimore, MD and Gaithersburg, MD from June to December of 2018. Mean daily air temperature for closed canopy site (a) and single and cluster sites (b); mean daily relative humidity for closed canopy site (c) and single and cluster sites (d); mean daily vapor-pressure deficit (VPD) for closed canopy site (e) and single and cluster sites (f); daily total precipitation for closed canopy site (g) and single and cluster sites (h); mean daily soil moisture in the closed canopy (i), single and cluster sites (j). Due to the later date of soil moisture sensors installation, there was a gap in the data for the closed canopy site. Image Credit: Ponte, et al., 2021
Table 1. Characteristics of study trees, including tree size, canopy width north–south (N–S) and east–west (E–W), daily sum of sap flux (JS), and daily volumetric water content (VWC). Source: Ponte, et al., 2021
Management
context |
n |
DBH
(cm) |
Height
(m) |
Canopy
width
N–S (m) |
Canopy
width
E–W (m) |
JS (g cm−2
day−1) |
VWC
(%) |
| Single trees |
5 |
22.4 ± 2.4 |
8.2 ± 0.3 |
8.2 ± 0.8 |
8.7 ± 0.7 |
260.4 ± 5.4 |
30.6 ± 0.6 |
| Cluster of trees |
4 |
24.7 ± 0.6 |
12.7 ± 0.5 |
9.8 ± 0.6 |
9.6 ± 0.5 |
195.3 ± 7.7 |
27.7 ± 0.5 |
| Closed canopy |
9 |
34.1 ± 4.4 |
21.0 ± 1.9 |
9.7 ± 1.0 |
9.0 ± 1.0 |
91.5 ± 2.1 |
29.8 ± 0.6 |
Values are mean ± SE.
The management context had a considerable impact on the daily sum of sap flux density (JS; see Figure 2, repeated-measures ANOVA, p-value < 0.0001). The median JS for the single site was more than three times that for the closed canopy site (257.2 as against 78.0 g H20 cm−2 day−1; see Figure 2).
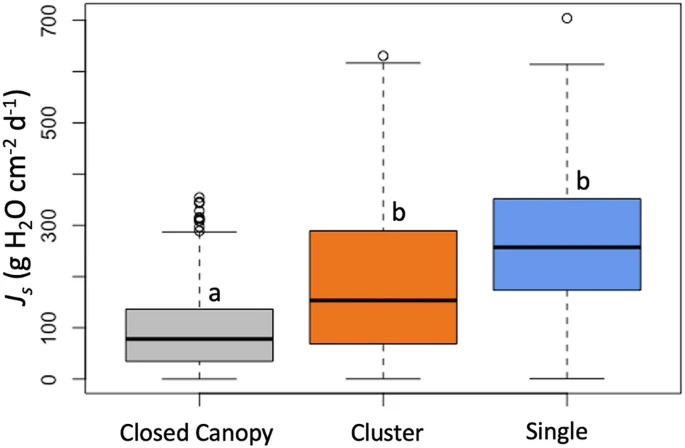
Figure 2. Box plots of the daily sum of sap flux density (JS) across the three management contexts. Unique letters above boxes indicate a significant difference among treatments based on post hoc analysis. (Figure created using R software version 4.0.5). Image Credit: Ponte, et al., 2021
As shown in Figure 3, the single site was found to have the highest JS of all the study sites. From Table 1, it is clear that the mean JS at the single site was almost three times that for the closed canopy site.
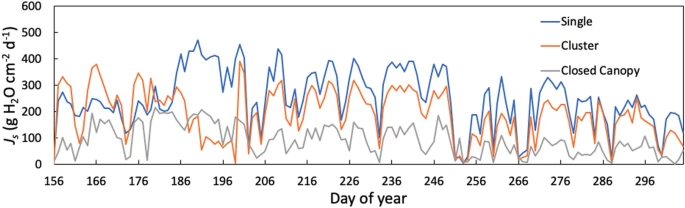
Figure 3. Time-series of the mean daily sum of sap flux density (JS) in the outer 2 cm measured in 2018 for the three management contexts. Image Credit: Ponte, et al., 2021
The seasonal variation of JS in relation to VPD and soil moisture was analyzed by splitting the sap flux data into three seven-week time periods (see Tables 2 and 3). There was no significant relation between JS and soil moisture, besides early and late summer at the closed canopy and single tree sites (see Table 3). From the R2 values of these relationships, soil moisture accounts for very little of the JS variability (R2 values varied from 0.001 to 0.17, see Table 3).
Table 2. Average parameters and R2 of daily sum of sap flux density (JS) versus daily average vapor pressure deficit (VPD) relationships of the form y = a * ln(VPD) + b. Source: Ponte, et al., 2021
Time
period |
Dates |
Single |
Cluster |
Closed Canopy |
| a |
b |
R2 |
a |
b |
R2 |
a |
b |
R2 |
Early
Summer |
June 5–July 24 |
121.9 ± 13.5a |
297.5 ± 38.2a |
0.28 ± 0.10 |
94.6 ± 52.4ab |
270.7 ± 113.6ab |
0.21 ± 0.12 |
66.4 ± 7.7b |
147.3 ± 15.5b |
0.66 ± 0.03 |
Late
Summer |
July 25–Sept 12 |
139.7 ± 12.5a |
370.1 ± 35.8a |
0.88 ± 0.03 |
104.9 ± 46.3ab |
281.9 ± 115.1ab |
0.76 ± 0.16 |
40.5 ± 3.4b |
122.1 ± 12.2b |
0.52 ± 0.04 |
| Fall |
Sept 13–Nov 1 |
117.4 ± 11.5a |
326.5 ± 27.3a |
0.72 ± 0.03 |
96.9 ± 37.8ab |
252.4 ± 92.6ab |
0.61 ± 0.12 |
35.3 ± 4.6b |
93.8 ± 12.1b |
0.58 ± 0.05 |
Values are mean ± SE. Unique letters indicate cross site differences within each time period based on post hoc analysis.
Table 3. Regression parameters and R2 of daily sum of sap flux density (JS) vs. daily average soil moisture content relationships of the form y = a * (soil moisture) + b. Source: Ponte, et al., 2021
Time
period |
Dates |
Single |
Cluster |
Closed canopy |
| a |
b |
R2 |
p |
a |
b |
R2 |
p |
a |
b |
R2 |
p |
Early
Summer |
June 5–
July 24 |
− 9.7 |
509.5 |
0.17 |
<0.001 |
3.1 |
155.5 |
0.01 |
0.40 |
− 3.9 |
225.3 |
0.14 |
<0.001 |
Late
Summer |
July 25–
Sept 12 |
− 5.6 |
476.1 |
0.07 |
<0.001 |
− 4.7 |
353.6 |
0.02 |
0.07 |
− 2.1 |
165.6 |
0.03 |
0.002 |
| Fall |
Sept 13–
Nov 1 |
0.8 |
169.8 |
0.00 |
0.46 |
− 1.2 |
179.4 |
0.00 |
0.58 |
0.2 |
45.0 |
0.00 |
0.69 |
Significant relationships are indicated in bold font.
From the repeated-measures ANOVA of the JS-VPD regression parameters, it was evident that the slope and intercept were considerably different between closed canopy and single sites over all time periods (see Table 2 and Figure 4).
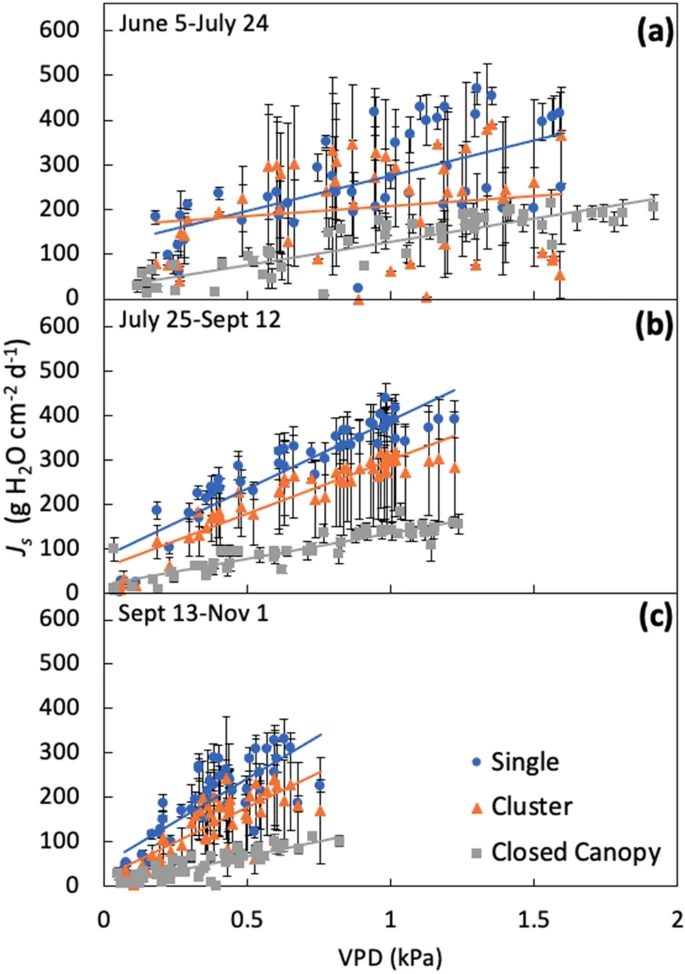
Figure 4. Mean daily sum of sap flux density (JS) as a function of VPD during early summer (a), late summer (b), and fall (c). Values are mean ± SE. Image Credit: Ponte, et al., 2021
Discussion
This study analyzed the effects of management contexts on the transpiration rates of red maple and the connection between transpiration and environmental drivers to identify the effects of various urban tree configurations on JS.
The results of this study are consistent with an earlier study in which California sycamore street trees exhibited the highest sap flux density than trees in unmanaged and irrigated forest sites. The regression analyses in this study showed that the single and cluster sites exhibited a steeper slope compared to the closed canopy site over all time periods (see Table 2).
This study offers an understanding of how various management contexts and microclimate factors impact the ecohydrological fluxes of a regular urban tree species. This is a critical consideration for creating stormwater crediting programs as urban trees can be more precisely combined into planning efforts, enhancing the effectiveness of green stormwater infrastructure networks.
Methodology
This study was performed in 2018 at two cities in Maryland, USA—Baltimore and Gaithersburg —reflecting three urban forest management contexts: single trees found over turfgrass, cluster of trees found over turfgrass, and trees found in a closed canopy forest, including a leaf litter layer (see Figure 5).
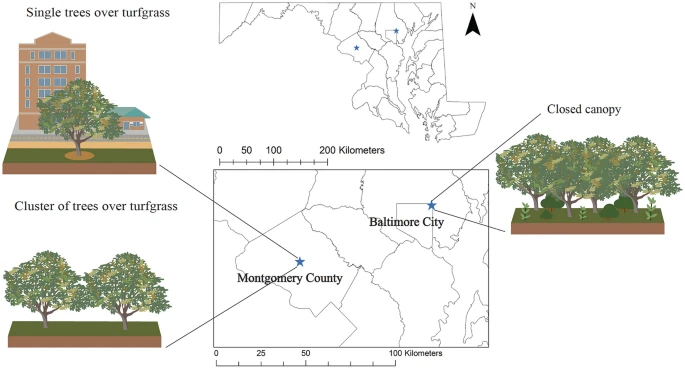
Figure 5. Study site locations in the State of Maryland, USA. Illustrations represent the management contexts in each site. Image Credit: Ponte, et al., 2021
Data collection started in June 2018 and all sites were situated in the Piedmont Plateau physiographic province. The soils in this province are moderately sloping, deep, well-drained upland underlain by semi-basic, acidic, and mixed basic rocks. The dominant piedmont soils in this province are Ultic Hapludalfs.
Maximum evapotranspiration is experienced in the month of July, and groundwater recharge takes place from mid-September to March every year. The field sites were chosen depending upon safety, accessibility of sites, and the potential to provide security for the monitoring equipment.
A weather station was set up in the open at each field location to characterize prospective climate drivers of sap flux density, such as precipitation, air temperature, and relative humidity.
Thermal dissipation Granier sensors developed using two cylindrical probes of 2-mm diameter were inserted 2 cm into the sapwood of the bole of 18 monitored red maple trees at a height of 1.4 m. The probes were located about 15 cm apart.
The sensors were covered with aluminum shielding to avoid any interference from rainwater or thermal heating. They were attached to double-shielded cable wires and linked to a CR 1000 data logger with AM 416 and AM 16/32B multiplexers. The voltage differential (∆V) between the ambient temperature of the below reference probe and the upper heated probe was calculated every 30 seconds and recorded as half-hour averages.
Repeated-measures analysis of variance (ANOVA) with linear mixed-effects models helped compare JS across different management contexts as well as the effect of day of the year. Assumptions of homoscedasticity and normality were checked with the help of QQ and residuals diagnostics plots.
Relationships between VPD and JS were fit for each tree and for each seven-week time period using natural logarithm functions. Repeated-measures ANOVA was used to test the differences across time for the slope and intercept for significance (p-value ≤ 0.05). A linear regression model was used to fit the relationship between JS and soil moisture content (%) for each seven-week time period and investigated for overall significance (p-value ≤ 0.05).
Journal Reference:
Ponte, S., Sonti, N. F., Phillips, T. H., Pavao-Zuckerman, M. A. (2021) Transpiration rates of red maple (Acer rubrum L.) differ between management contexts in urban forests of Maryland, USA. Scientific Reports, 11, p. 22538. https://www.nature.com/articles/s41598-021-01804-3.
References and Further Reading
- Askarizadeh, A., et al. (2015) From rain tanks to catchments: Use of low-impact development to address hydrologic symptoms of the urban stream syndrome. Environmental Science Technology, 49, pp. 11264–11280. doi.org/10.1021/acs.est.5b01635.
- Shuster, W. D., et al. (2005) Impacts of impervious surface on watershed hydrology: A review. Urban Water Journal, 2, pp. 263–275. doi.org/10.1080/15730620500386529.
- Walsh, C. J., et al. (2005) The urban stream syndrome: Current knowledge and the search for a cure. 24, pp. Journal of the North American Benthological Society, 706–723.
- US EPA. (2015) What is Green Infrastructure? US EPA. https://www.epa.gov/green-infrastructure/what-green-infrastructure.
- Hoover, F A & Hopton, M E (2019) Developing a framework for stormwater management: Leveraging ancillary benefits from urban greenspace. Urban Ecosystems. 22, pp. 1139–1148. doi.org/10.1007/s11252-019-00890-6.
- Zölch, T., et al. (2017) Regulating urban surface runoff through nature-based solutions—An assessment at the micro-scale. Environmental Research, 157, pp. 135–144. doi.org/10.1016/j.envres.2017.05.023.
- Konijnendijk, C. C., et al. (2006) Defining urban forestry—A comparative perspective of North America and Europe. Urban Forestry & Urban Greening, 4, pp. 93–103. doi.org/10.1016/j.ufug.2005.11.003.
- Berland, A. et al. (2017) The role of trees in urban stormwater management. Landscape and Urban Planning, 162, pp. 167–177. https://doi.org/10.1016/j.landurbplan.2017.02.017.
- Bartens, J., et al. (2008) Can urban tree roots improve infiltration through compacted subsoils for stormwater management? The Journal of Environmental Quality. doi.org/10.2134/jeq2008.0117.
- Geronimo, F. K. F., et al. (2014) Treatment of suspended solids and heavy metals from urban stormwater runoff by a tree box filter. Water Science and Technology, 69, pp. 2460–2467. doi.org/10.2166/wst.2014.150.
- Jayasooriya, V M & Ng, A W M (2014) Tools for modeling of stormwater management and economics of green infrastructure practices. A review. Water, Air, & Soil Pollution. doi.org/10.2166/wst.2014.150.
- Keeley, M., et al. (2013) Perspectives on the use of green infrastructure for stormwater management in Cleveland and Milwaukee. Environmental Management, 51, pp. 1093–1108. doi.org/10.1007/s00267-013-0032-x.
- Dhakal, K P & Chevalier, L R (2016) Urban stormwater governance: The need for a paradigm. Shift Environmental Management Journal, 57, pp. 1112–1124.
- Dhakal, K. P. & Chevalier, L. R (2017) Managing urban stormwater for urban sustainability: Barriers and policy solutions for green infrastructure application. Journal of Environment Management, 203, pp. 171–181. doi.org/10.1016/j.jenvman.2017.07.065.
- Tzoulas, K. et al. (2007) Promoting ecosystem and human health in urban areas using Green Infrastructure: A literature review. Landscape and Urban Planning, 81, pp. 167–178. doi.org/10.1016/j.landurbplan.2007.02.001.
- Kuehler, E., et al. (2017) Quantifying the benefits of urban forest systems as a component of the green infrastructure stormwater treatment network. Ecohydrology, 10, p. e1813. doi.org/10.1002/eco.1813.
- Law, N L & Hanson, J (2016) Recommendations of the Expert Panel to Define BMP Effectiveness for Urban Tree Canopy Expansion. Center for Watershed Protection and Chesapeake Stormwater Network: Ellicott City, MD, p. 236. Available at: https://owl.cwp.org/.
- Phillips, T. H., et al. (2019) The capacity of urban forest patches to infiltrate stormwater is influenced by soil physical properties and soil moisture. Journal of Environmental Management, 246, pp. 11–18. doi.org/10.1016/j.jenvman.2019.05.127.
- Zipper, S. C., et al. (2017) Urban heat island-induced increases in evapotranspirative demand. Geophysical Research Letters, 44, pp. 873–881. doi.org/10.1002/2016GL072190.
- Riikonen, A., et al. (2016) Environmental and crown related factors affecting street tree transpiration in Helsinki, Finland. Urban Ecosystems, 19, pp. 1693–1715. doi.org/10.1007/s11252-016-0561-1.
- Asawa, T., et al. (2017) Continuous measurement of whole-tree water balance for studying urban tree transpiration. Hydrological Processes, 31, pp. 3056–3068. Hydrological Processes. doi.org/10.1002/hyp.11244.
- Hagishima, A., et al. (2007) Field experiment on transpiration from isolated urban plants. Hydrological Processes, 21, pp. 1217–1222. doi.org/10.1002/hyp.6681.
- Moriwaki, R & Kanda, M (2004) Seasonal and diurnal fluxes of radiation, heat, water vapor, and carbon dioxide over a suburban area. Journal of Applied Meteorology and Climatology, 1988–2005(43), pp. 1700–1710. doi.org/10.1175/JAM2153.1.
- Spronken-Smith, R A (2000) Advection and the surface energy balance across an irrigated urban park. The International Journal of Climatology, 20, pp. 1033–1047. doi.org/10.1002/1097-0088(200007)20:9<1033::AID-JOC508>3.0.CO;2-U.
- Giraldo, M. A., et al. (2015) Suburban Forest Change and Vegetation Water Dynamics in Atlanta, USA. Southeast Georgia, 55, pp. 193–212.
- Peters, E. B., et al. (2010) A. Biological and environmental controls on tree transpiration in a suburban landscape. Journal of Geophysical Research, doi.org/10.1029/2009JG001266.
- Bhaskar, A. S., et al. (2016)Urban base flow with low impact development. Hydrological Processes, 30, pp. 3156–3171. doi.org/10.1002/hyp.10808.
- Peters, E. B., et al. (2011) Seasonal contributions of vegetation types to suburban evapotranspiration. Journal of Geophysical Research Atmospheres, doi.org/10.1029/2010JG001463.
- Zhou, W., et al. (2017) Effects of the spatial configuration of trees on urban heat mitigation: A comparative study. Remote Sensing of Environment, 195, pp. 1–12. doi.org/10.1029/2010JG001463.
- McPherson, E. G., (2003) Urban forestry: The final frontier? Journal of Forestry, 101, pp. 20–25.
- Lefsky, M A & McHale, M R (2008) Volume estimates of trees with complex architecture from terrestrial laser scanning. Journal of Applied Remote Sensing, 2, p. 023521.
- Nowak, D J (1994) Atmospheric carbon dioxide reduction by Chicago’s urban forest. In: Chicago’s urban forest ecosystem: Results of the Chicago urban forest climate project. McPherson, E. G., et al. (Eds), pp. 83–94.
- Pataki, D. E., et al. (2011) Transpiration of urban forests in the Los Angeles metropolitan area. Ecological Applications, 21, pp. 661–677.
- Yılmaz, S., et al. (2007) Determination of climatic differences in three different land uses in the city of Erzurum, Turkey. Building and Environment, 42, pp. 1604–1612. doi.org/10.1016/j.buildenv.2006.01.017.
- Nowak, D. J., et al. (2002) Effects of urban tree management and species selection on atmospheric carbon dioxide. Journal of Arboriculture, 28(3), pp. 113–122.
- Nowak, D. J., et al. (2008) A ground-based method of assessing urban forest structure and ecosystem services. Environmental Research Letters, 34(6), pp. 347–358.
- Zipperer, W. C., et al. (1997) Urban tree cover: An ecological perspective. Urban Ecosystems, 1, pp. 229–246. doi.org/10.1023/A:1018587830636.
- Oke, T R (1987) Boundary Layer Climates (Routledge).
- McCarthy, H R & Pataki, D E (2010) Drivers of variability in water use of native and non-native urban trees in the greater Los Angeles area. Urban Ecosystems, 13, pp. 393–414. doi.org/10.1007/s11252-010-0127-6.
- MacFarlane, D W & Kane, B (2017) Neighbour effects on tree architecture: functional trade-offs balancing crown competitiveness with wind resistance. Functional Ecology, 31, pp. 1624–1636. doi.org/10.1111/1365-2435.12865.
- Day, S. D., et al. (2010) Contemporary concepts of root system architecture of urban trees. Arboriculture & Urban Forestry, 36, pp. 149–159.
- Harrison, J. L., et al. (2020) Water sources for red maple trees in a northern hardwood forest under a changing climate. Ecohydrology, 13, p. e2248. doi.org/10.1002/eco.2248.
- Marchionni, V., et al. (2020) Groundwater buffers drought effects and climate variability in urban reserves. Water Resources Research, 56, p. e2019WR026192. doi.org/10.1029/2019WR026192
- Chen, L., et al., (2011) Biophysical control of whole tree transpiration under an urban environment in Northern China. Journal of Hydrology, 402, pp. 388–400.
- Oogathoo, S., et al. (2020) Vapour pressure deficit and solar radiation are the major drivers of transpiration of balsam fir and black spruce tree species in humid boreal regions, even during a short-term drought. Agricultural and Forest Meteorology, 291, p. 108063.
- Rodríguez-Gamir, J., et al. (2016) An integrated view of whole-tree hydraulic architecture. Does stomatal or hydraulic conductance determine whole tree transpiration? PLoS ONE, 11, p. e0155246. doi.org/10.1371/journal.pone.0155246
- Rogiers, S. Y., et al. (2011) Transpiration efficiency of the grapevine cv. Semillon is tied to VPD in warm climates. Annals of Applied Biology, 158, pp. 106–114. doi.org/10.1111/j.1744-7348.2010.00446.x.
- Tirpak, R. A., et al. (2018) Evaluating the influence of design strategies and meteorological factors on tree transpiration in bioretention suspended pavement practices. Ecohydrology, 11, p. e2037. doi.org/10.1002/eco.2037.
- Fair, B. A., et al. (2012) Characterization of physical, gaseous, and hydrologic properties of compacted subsoil and its effects on growth and transpiration of two maples grown under greenhouse conditions. Arboriculture & Urban Forestry, 38, pp. 151–159.
- Kjelgren, R K & Clark, J R (1993) Growth and water relations of Liquidambar styraciflua L. in an urban park and plaza. Trees, 7, 195–201. doi.org/10.1007/BF00202073.
- Larcher, W (2003) Physiological Plant Ecology: Ecophysiology and Stress Physiology of Functional Groups.
- Wullschleger, S D (2000) Environmental control of whole-plant transpiration, canopy conductance and estimates of the decoupling coefficient for large red maple trees. Agricultural and Forest Meteorology, 104, pp. 157–168. doi.org/10.1016/S0168-1923(00)00152-0.
- Band, L., et al. (2010) Modeling in the Chesapeake Bay Watershed: effects of trees on stream flow in the Chesapeake Bay. Rep. For. Serv. Agreem. No07CO‐11242300‐145.
- Goddard, H C (2012) Cap and trade for stormwater management. In: Economic Incentives for Stormwater Control (Ed. Thurston, H.), pp. 211–232.
- Blanken, P. D., et al. (1997) Energy balance and canopy conductance of a boreal aspen forest: Partitioning overstory and understory components. Journal of Geophysical Research Atmospheres, 102, pp. 28915–28927. doi.org/10.1029/97JD00193.
- Wullschleger, S. D., et al. (2001) Transpiration from a multi-species deciduous forest as estimated by xylem sap flow techniques. Forest Ecology and Management, 143, pp. 205–213. doi.org/10.1016/S0378-1127(00)00518-1.
- USDA Forest Service. (2016) Baltimore Cooperating Experimental Forest - Northern Research Station - USDA Forest Service. Available at: https://www.fs.usda.gov/.
- NOAA (2007) Find a Station | Data Tools | Climate Data Online (CDO) | National Climatic Data Center (NCDC). Available at: https://www.ncdc.noaa.gov/cdo-web/datatools/findstation.
- Campbell, G S & Norman, J (2012) An Introduction to Environmental Biophysics.
- Granier, A (1987) Evaluation of transpiration in a Douglas-fir stand by means of sap flow measurements. Tree Physiology, 3, pp. 309–320. doi.org/10.1093/treephys/3.4.309.
- Lu, P (1997) A direct method for estimating the average sap flux density using a modified Granier measuring system. Functional Plant Biology, 24, pp. 701–705. doi.org/10.1071/PP96099_CO.
- Granier, A. (1985) Une nouvelle méthode pour la mesure du flux de sève brute dans le tronc des arbres. Annals of Forest Science, 42, pp. 93–200. doi.org/10.1051/forest:19850204.
- Oishi, A. C., et al. (2016) Baseliner: An open-source, interactive tool for processing sap flux data from thermal dissipation probes. SoftwareX, 5, pp. 139–143. doi.org/10.1016/j.softx.2016.07.003.
- Bates, D M & Pinheiro, J C (1998) Linear and nonlinear mixed-effects models. Conference on Applied Statistics in Agriculture. doi.org/10.4148/2475-7772.1273.
- R Core Team. R (2021) A Language and Environment for Statistical Computing (R Foundation for Statistical Computing.
- Pinheiro, J., et al. (2019) Nlme: Linear and nonlinear mixed effects models (R package version 3.1. 140)[Computer software].
- Lenth, R (2019) emmeans: Estimated marginal means, aka least-squares means. R package, 1(3), 4.