The online shopping platforms provide numerous shipping options to their consumers. The faster delivery, most sought after by the consumers, however, might be detrimental to the environment. This article evaluates the carbon footprint of the shipping options provided by Taobao, a famous Chinese online shopping website. The results were published in Transportation Research Record.

Image Credit: Andrey_Popov/Shutterstock.com
The ever-booming e-commerce industry has brought many changes and these online shopping platforms compete in enhancing their operations and offer quality services to their customers. These platforms provide the consumer with many shipping or delivery options to be relevant in a hyper-competitive environment.
The choice to choose faster and convenient shipping alternatives might facilitate unsustainable consumption. It was noted in one study that 47% of online shoppers paid more to get their orders sooner despite no immediate requirement. This scenario of seeking faster delivery shortens the delivery lead time resulting in carbon-intensive delivery trips.
This article analyzes the following:
- The estimated carbon footprint of different cross-border e-commerce shipping options
- The influence of carbon labeling on consumers’ cross-border shipping preferences.
The study analyzes Taobao’s (a famous e-commerce platform for cross-border purchasing in Asia) relative carbon emissions of shipping options. Depending on the estimated emissions, a stated choice (SC) survey is later designed to comprehend the reaction of online shoppers to carbon labeling.
As certain consumers are concerned about sustainability, informing about the carbon impact of different shipping options along with the delivery time and cost is beneficial.
Literature Review and Approach
Consumers can purchase from both international and local sellers, boosting both domestic and cross-border delivery operations globally. Cross-border deliveries are mostly items imported from other countries, and earlier consumers avoided such purchases due to longer delivery time and higher shipping costs.
However, cross-border purchases are popular and have continued to gain massive popularity in recent years, leading to the need for more research to comprehend the environmental implications.
However, there is limited research on the comparative environmental impacts of various shipping options provided by e-commerce platforms. Cross-border deliveries are highly carbon-intensive owing to their longer and more complex supply chain operation.
A survey conducted on the perception of e-commerce and its effect on the environment showed that 64% of people surveyed showed a willingness to wait for an order with greener logistics operations and 25% of them were willing to pay for greener shipping. Another research showed that an annual savings of 79,000 kg CO2e (carbon dioxide equivalent) are possible if carbon labeling were made obtainable on travel booking websites.
A study identified that consumers’ preferences are mostly driven by the shipping cost, delivery speed, and other non-cost attributes. Some studies also identified that delivery time had an effect on customer satisfaction.
Delivery time is one of the major inhibitors among e-commerce shoppers says another research. Other works also indicated the influence of order value (the amount of money that a consumer spends in every online transaction). Another study also found that the order value was less for cases where unconditional free shipping is provided.
The ability to select a carrier, availability of order tracking services, delivery time slot, and delivery date were also considered in other research works but excluded in the current study.
Case Study
The prime objective of the study was to carry out a comparative assessment of the various e-commerce shipping options for cross-border purchases. The study analyzes the delivery time, carbon footprint, and shipping cost. Taobao, the online shopping platform based out of China, was selected as a representation.
The consumers of Taobao are offered many options to customize their shipping options. The current case study into Taobao is an analysis of the parcel delivery operations from China to Singapore.
Carbon Footprint Assessment
Methodology
The logistics process in a multiple-order transaction is listed in various stages (A–E) to enable the assessment of each shipping option (see Figure 1). The stages were:
- Long-haul truck transport inside China
- Cross-border transport
- Warehouse operations
- Last-mile delivery van transport inside Singapore
- Consumer’s passenger trip to a CP
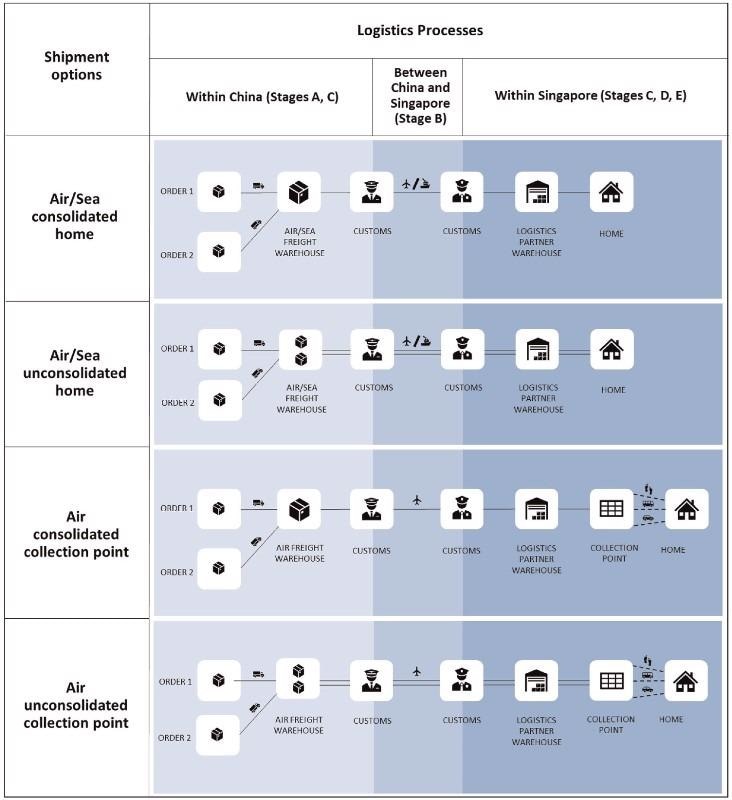
Figure 1. Cross-border logistics process for each shipping option. Image Credit: Cheah and Huang, 2021
In the case of freight transport segments (stages A, B, D), the carbon footprint with respect to the carbon dioxide-equivalent emissions (kg CO2e) was evaluated based on the ECTA guidelines. The location of the supplier was selected randomly and marked as the New Cross-Border E-Commerce Zones (see Figure 2).
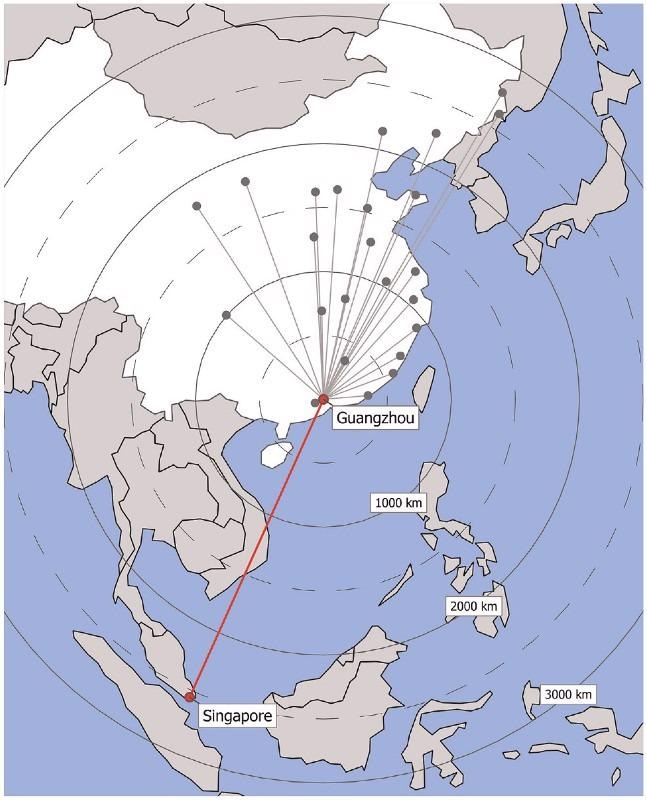
Figure 2. Map showing Singapore and Guangzhou, the main departure city from China, and assumed supplier locations in China as grey dots. Image Credit: Cheah and Huang, 2021
Table 1 lists the carbon emission factors for various modes of transportation.
Table 1. Carbon Emission Factors for Various Transport Modes. Source: Cheah and Huang, 2021
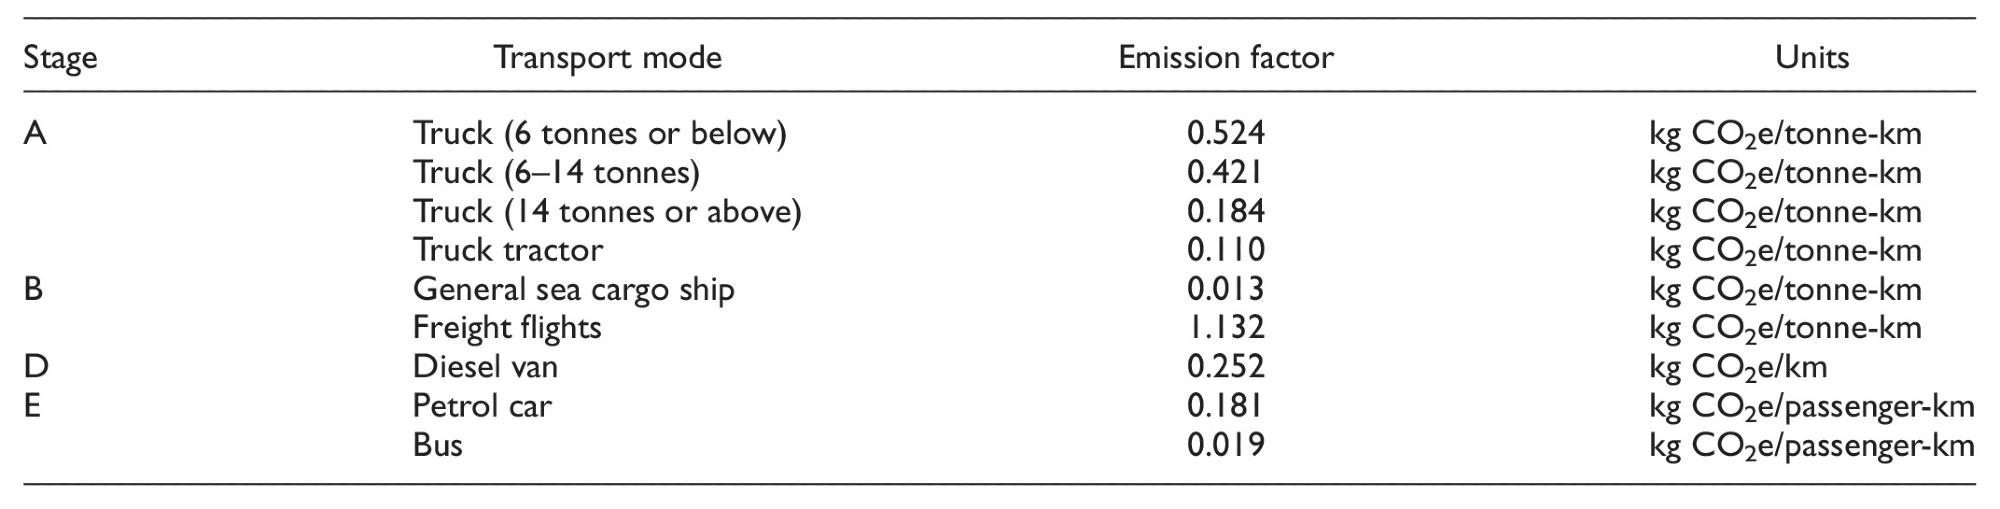
In case of the last-mile delivery to the consumer’s place or CP (stages D and E), conventional diesel delivery vans are presumed to be utilized. The study also took in the delivery failures resulting in repeated and multiple delivery attempts. The carbon emissions for warehouse operations (stage C) were also taken into consideration.
Results
Table 2 compares the effect of various shipping options for different scenarios of online orders.
Table 2. Scenarios of Shipping-Related Options Selected on Taobao and the Estimated Impacts. Source: Cheah and Huang, 2021
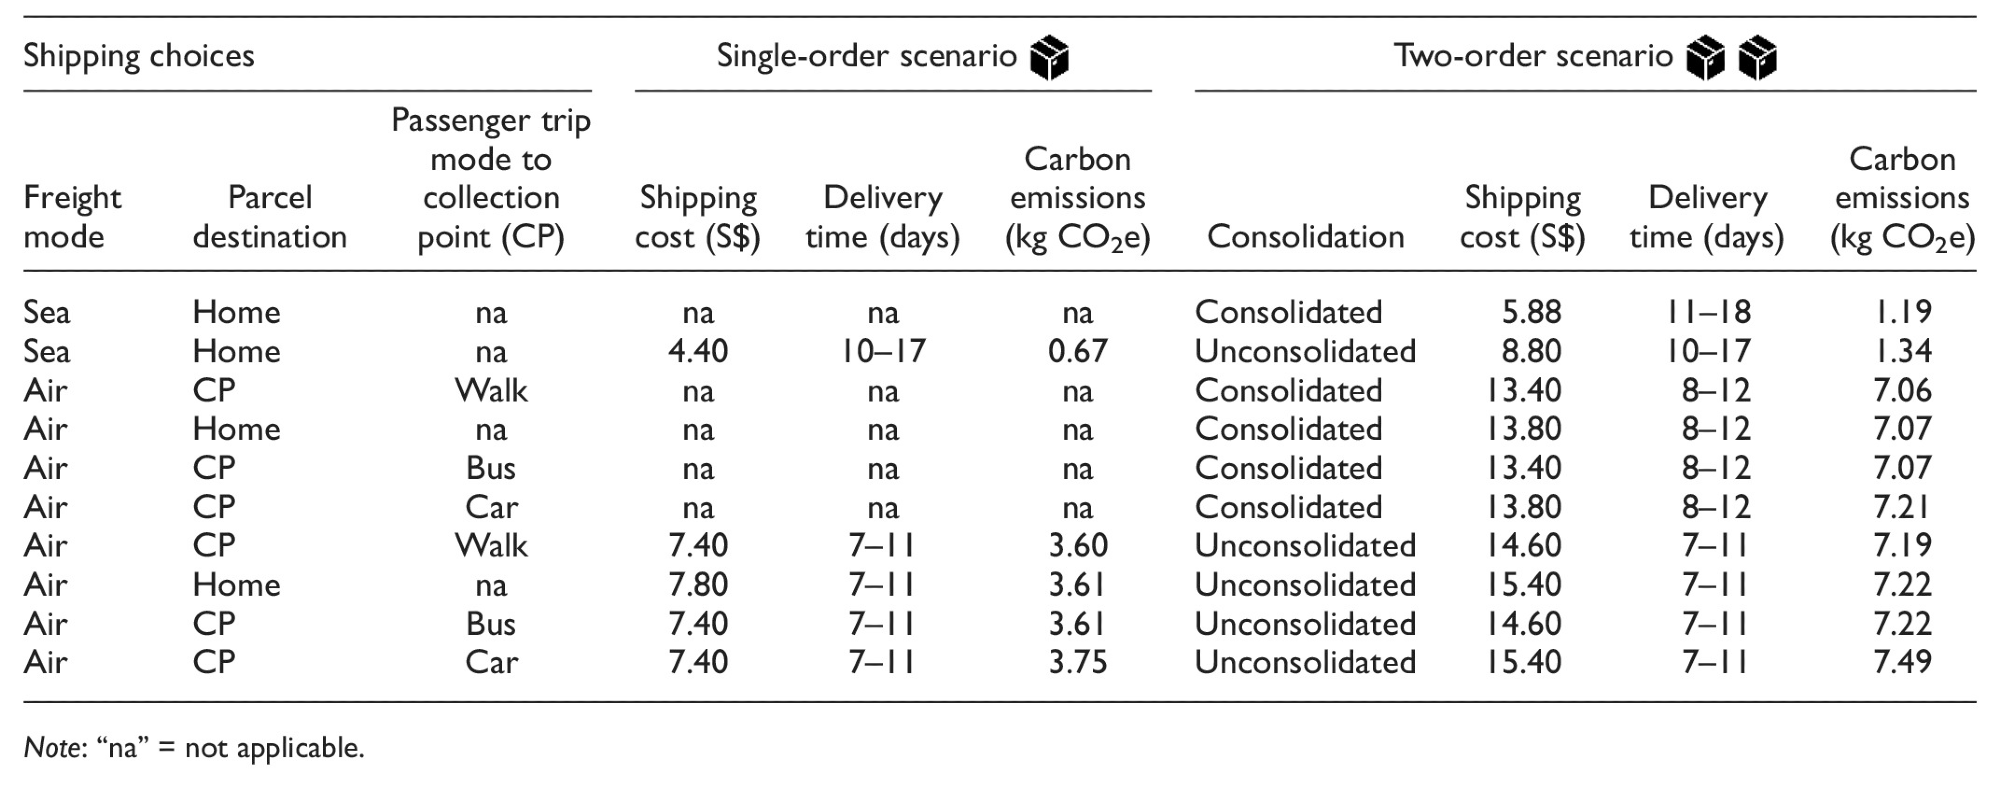
The International Post Corporation (IPC) states that cross-border e-commerce deliveries weighed between 0.2 kg and 2 kg. It was seen that the “sea-home” shipment option is the least carbon-intensive option available for a single-order scenario and the “sea-consolidated-home” shipment option is apt for a multiple-order scenario.
The carbon footprint breakdown shown in Figure 3 (stages A–E) depicts that carbon emissions are highly sensitive to air or sea shipment for cross-border transport (stage B).
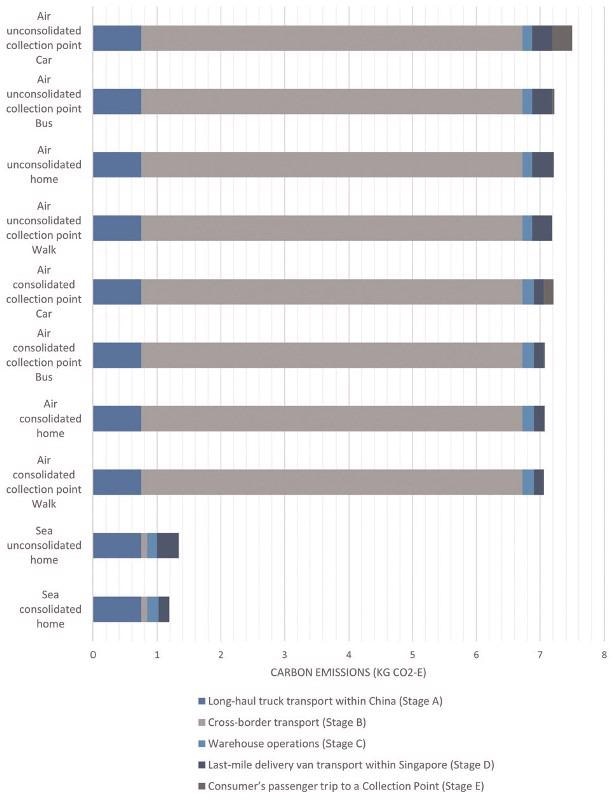
Figure 3. Carbon footprint compared for different shipment options for the two-order scenario. Image Credit: Cheah and Huang, 2021
It was noted that the emissions in the air are 65 times higher from sea shipping.
In last-mile delivery (stages D and E) analysis it was seen that the whole emissions produced for home delivery are higher than delivery to a CP by only 0.012 kg CO2e (see Figure 4).
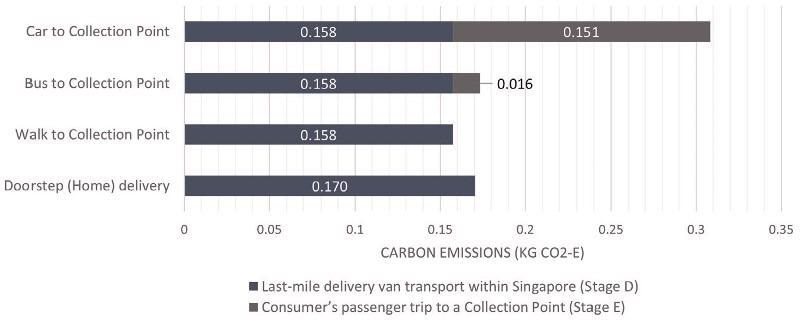
Figure 4. Carbon emissions associated with last-mile delivery per parcel. Image Credit: Cheah and Huang, 2021
Shipping Choice Experiment
Methodology
A shipping choice survey was performed to examine the consumers’ interest to wait for their orders and also their willingness to pay higher for a less carbon-intensive option. The study considered a single-order transaction with doorstep or home delivery as the preferred delivery destination. They had 12 scenarios and the complete factorial design of each scenario is detailed in Table 3.
Table 3. Full Factorial Design of the Scenarios. Source: Cheah and Huang, 2021
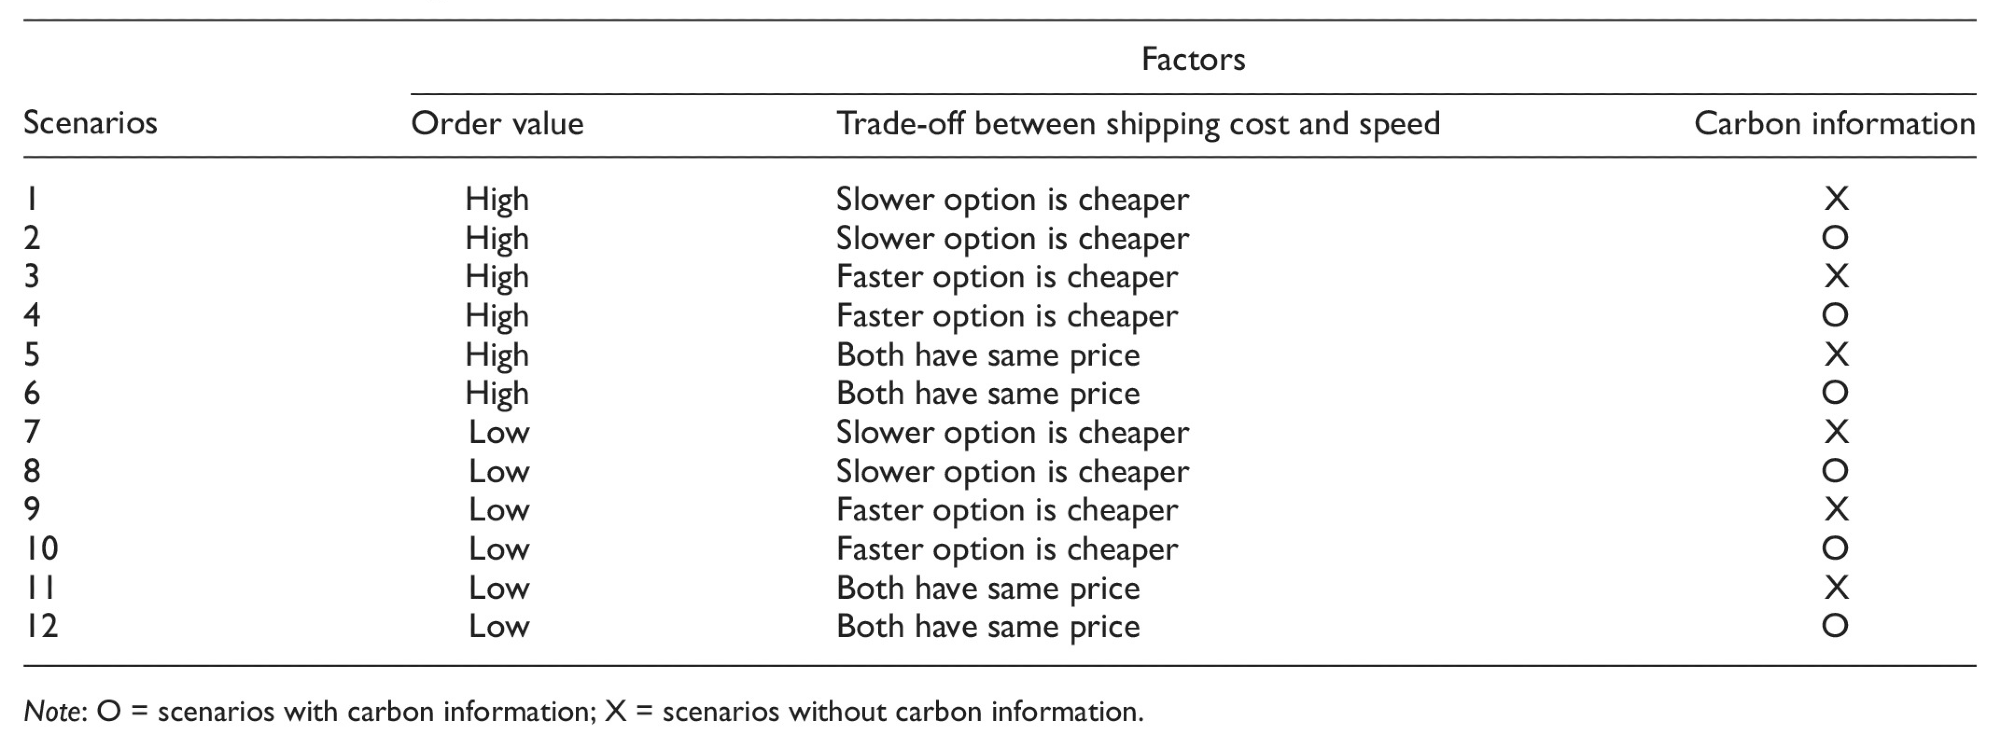
Figure 5 illustrates the options provided in the survey.
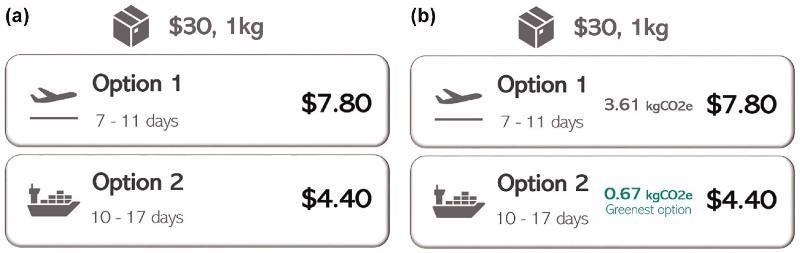
Figure 5. Choice options for: (a) scenario 7 (without carbon information), and (b) scenario 8 (with carbon information). Image Credit: Cheah and Huang, 2021
Results
The online survey was done in Singapore from June to July 2020 with Singapore residents having experience in making cross-border Internet purchases. Figure 6 shows the demographic and online purchasing profiles of respondents.
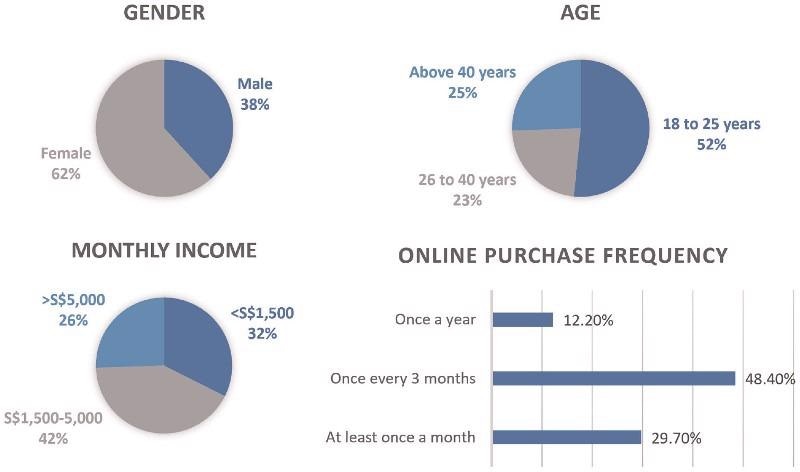
Figure 6. Profile of survey respondents (n = 188). Image Credit: Cheah and Huang, 2021
The possible options and the respondents opting for these options in the three contexts are shown in Table 4.
Table 4. Summary of the Options Selected by Survey Respondents. Source: Cheah and Huang, 2021
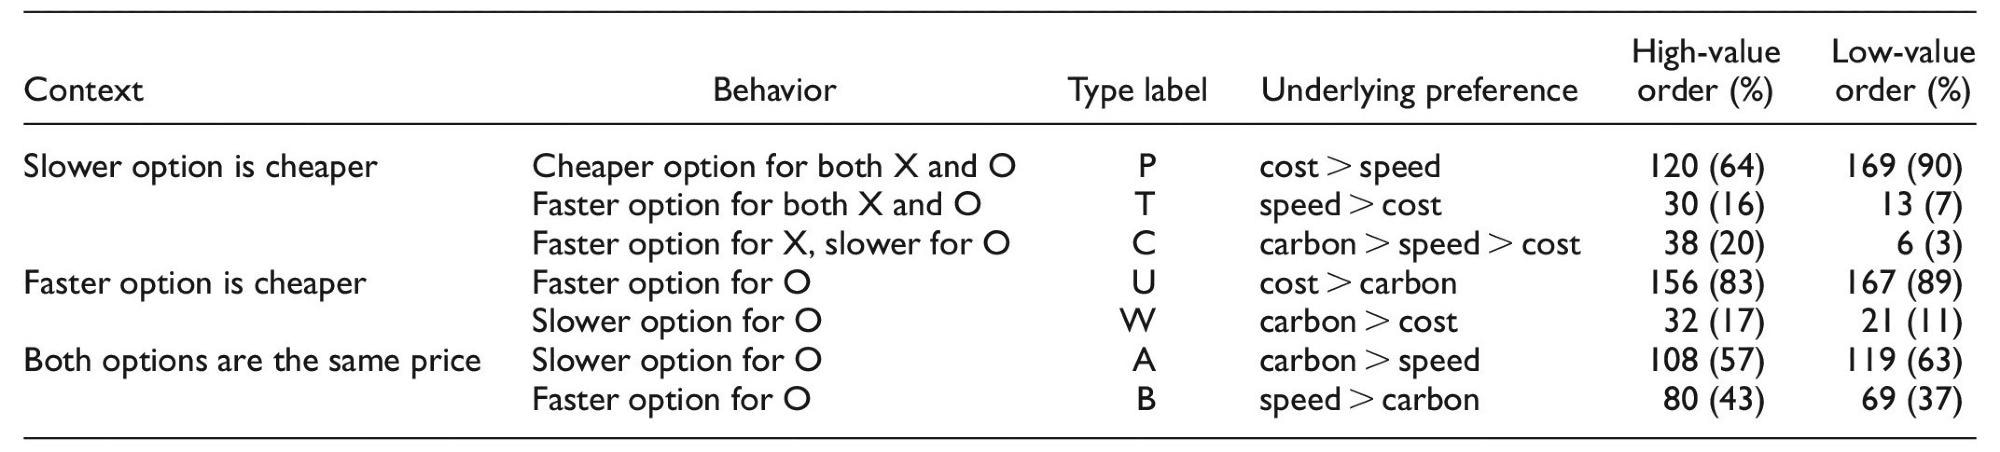
As shipping costs are a dominant decision factor, it is expected that the respondents would choose cheaper alternatives. The survey observed consumers of various behavior types and Table 5 outlines the number of respondents belonging to each archetype.
Table 5. Summary of Discovered Consumer Archetypes and Number of Respondents (Percentage of Respondents in Brackets). Source: Cheah and Huang, 2021
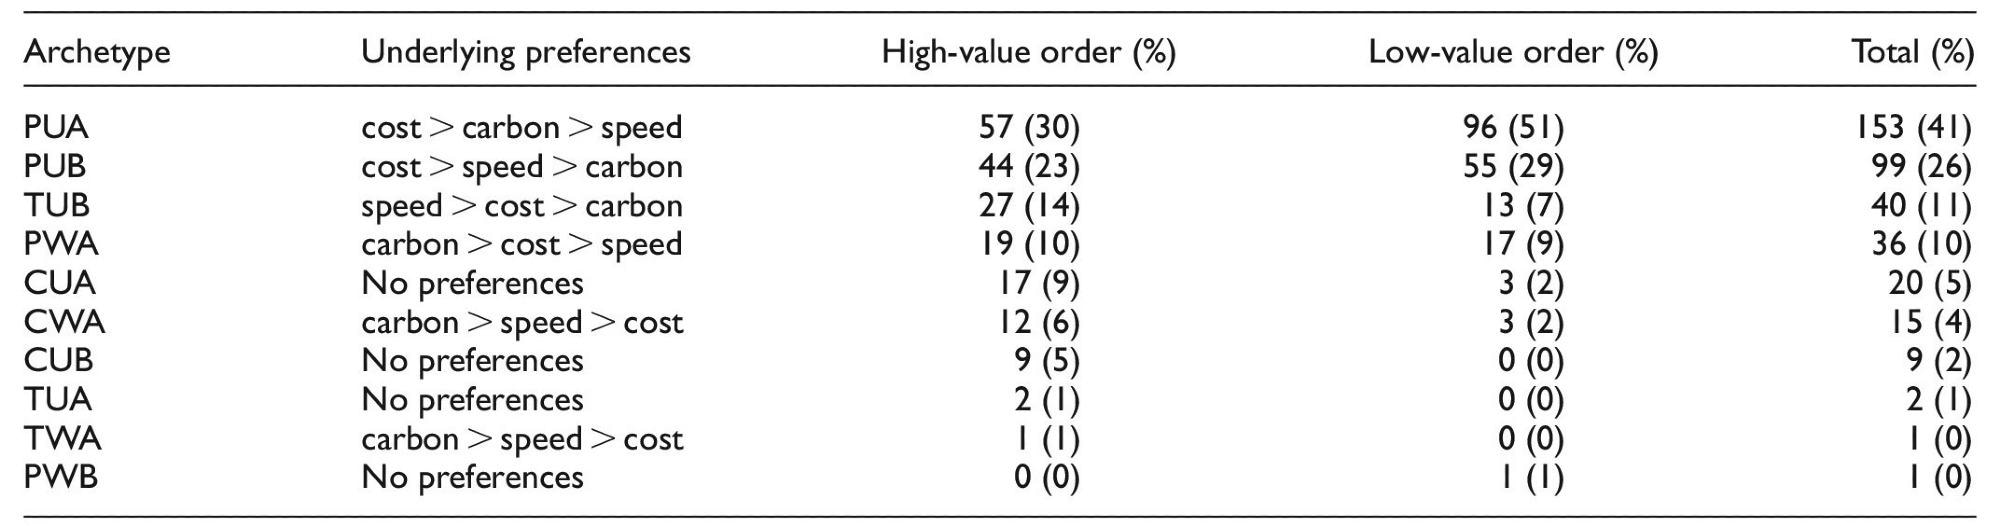
The observations offer insight into the general distribution of the minority and top consumer archetypes. It was also seen that there was a willingness to wait using greener shipping.
Conclusion
The current research is an assessment of the carbon footprint of cross-border shipping options of the e-commerce industry. The carbon footprint assessment showed that carbon emissions for e-commerce cross-border orders ranged from 0.67–7.49 kgCO2e per parcel shipped.
The shipping choice experiment showed that most of the respondents were willing to wait for greener shipping. It is also vital to consider the economic impact of these lower-carbon shipping initiatives.
Journal Reference:
Cheah, L & Huang, Q (2021) Comparative Carbon Footprint Assessment of Cross-Border E-Commerce Shipping Options. Transportation Research Record. Available online: https://journals.sagepub.com/doi/10.1177/03611981211037249.
References and Further Reading
- Ma, S., et al. (2017) Fast or Free Shipping Options in Online and Omni-Channel Retail? The Mediating Role of Uncertainty on Satisfaction and Purchase Intentions. The International Journal of Logistics Management, 28(3), pp. 1099–1122. doi.org/10.1108/IJLM-05-2016-0130.
- Schindler, R. M., et al. (2005) Shipping Charges and Shipping-Charge Skepticism: Implications for Direct Marketers’ Pricing Formats. Journal of Interactive Marketing, 19, pp. 41–53. doi.org/10.1002/dir.20030.
- Dotcom Distribution (2016) Fast Delivery and Premium Packaging has a High Impact on Customer Loyalty. Available at: https://dotcomdist.com/study-delivery-time-influences-87-percent-online-shoppers-purchase-decisions/.
- Mohan, A & So, S L (2019) Impact of Freight Consolidation on Logistics Cost and Emissions. Available at: https://hdl.handle.net/1721.1/121354.
- OECD/ITF (2016) The Carbon Footprint of Global Trade: Tackling Emissions from International Freight Transport. International Transport Forum.
- O’Rourke, D & Ringer, A (2016) The Impact of Sustainability Information on Consumer Decision Making. Journal of Industrial Ecology, 20(4), pp. 882–892. doi.org/10.1111/jiec.12310.
- Jeroschewski, A (2015) Cross-Border Sales: The New Frontier in e-Commerce DHL. Available at: https://www.dhl.com/sg-en/home/our-divisions/supply-chain/thought-leadership/articles/cross-border-sales-ecommerce.html.
- Fredrick, J (2015) Online Retail Cross-Border Sales: The Global Trend That’s Here to Stay. PFSweb.
- Pinedo, G (2019) Cross-Border Ecommerce in 2020 and Beyond [Presentation slides]. Available at: https://www.ascentialedge.com/insights/breaking-barriers-cross-border-ecommerce-2020-and-beyond.
- UNCTAD (2020) Global e-Commerce Hits $25.6 Trillion - Latest UNCTAD Estimates. Available at: https://unctad.org/en/pages/newsdetails.aspx?OriginalVersionID=2345#:∼:text=B2C%20e%2Dcommerce%20was%20valued,commerce%20market%20(Table%201).
- Edwards, J (2009) The Impact of Failed Home Deliveries on Carbon Emissions: Are Collection/Delivery Points Environmentally-Friendly Alternatives. Proceedings of the 14th Annual Logistics Research Network Conference, Cardiff.
- Jaller, M., et al. (2020) Evaluating the Environmental Impacts of Online Shopping: A Behavioral and Transportation Approach. Transportation Research Part D: Transport and Environment, 80, p. 102223. doi.org/10.1016/j.trd.2020.102223.
- Edwards, J., et al. (2009) Carbon Auditing the ‘Last Mile’: Modelling the Environmental Impacts of Conventional and Online Non-Food Shopping. Green Logistics Report. Heriot-Watt University.
- McLeod, F N & Cherrett, T J (2009) Quantifying the Environmental Benefits of Collection/Delivery Points. OR Insight, 22(3), pp. 127–139. doi.org/10.1057/ori.2009.2.
- Nakamichi, K (2016) Estimation of Cost and CO2 Emissions with a Sustainable Cross-Border Supply Chain in the Automobile Industry: A Case Study of Thailand and Neighboring Countries. Transportation Research Part D: Transport and Environment, 43, pp. 158–168. doi.org/10.1016/j.trd.2015.12.018.
- Brunetti, F (2018) How Environmentally Friendly is E-Commerce? An Exploration into Young Shoppers’ Perceptions and Preferences. Proceedings of the 21st International Conference Excellence in Services, Le Cnam, Paris.
- Buckell, J & Hess, S (2019) Stubbing out Hypothetical Bias: Improving Tobacco Market Predictions by Combining Stated and Revealed Preference Data. Journal of Health Economics. 65, pp. 93–102. doi.org/10.1016/j.jhealeco.2019.03.011.
- Daher, N., et al. (2018) Perceptions, Preferences, and Behavior Regarding Energy and Environmental Costs: The Case of Montreal Transport Users. Sustainability, 10(2), p. 514. doi.org/10.3390/su10020514.
- Eijgelaar, E., et al. (2016) Consumer Attitudes and Preferences on Holiday Carbon Footprint Information in The Netherlands. Journal of Sustainable Tourism, 24(3), pp. 398–411. doi.org/10.1080/09669582.2015.1101129.
- Caputo, V., et al. (2013) Food Miles or Carbon Emissions? Exploring Labelling Preference for Food Transport Footprint with a Stated Choice Study. Australian Journal of Agricultural and Resource Economics. 57(4), pp. 465–482. doi.org/10.1111/1467-8489.12014.
- Amenta, N & Sanguinetti, A (2020) Adding Carbon to the Equation in Online Flight Search. NCST-UCD-RR-20-06. U.S. Department of Transportation, Washington, D.C.
- Nguyen, D. H., et al. (2019) What is the Right Delivery Option for You? Consumer Preferences for Delivery Attributes in Online Retailing. Journal of Business Logistics, 40(4), pp. 299–321. doi.org/10.1111/jbl.12210.
- Gawor, T & Hoberg, K (2019) Customers’ Valuation of Time and Convenience in e-Fulfillment. International Journal of Physical Distribution & Logistics Management, 49(1), pp. 75–98. doi.org/10.1108/IJPDLM-09-2017-0275.
- Garver, M S (2012) Modeling Choice in Logistics: A Managerial Guide and Application. International Journal of Physical Distribution & Logistics Management, 42(2), pp. 128–151.
- Koukova, N T (2012) The Effect of Shipping Fee Structure on Consumers’ Online Evaluations and Choice. Journal of the Academy of Marketing Science, 40(6), pp. 759–770. doi.org/10.1007/s11747-011-0281-2.
- Zhang, Q., et al. (2005) Logistics Flexibility and Its Impact on Customer Satisfaction. The International Journal of Logistics Management, 16(1), pp. 71–95. doi.org/10.1108/09574090510617367.
- Parcel Perform & iPrice Group (2019) Singapore Consumers Happy with the State of Delivery, But Most Demanding in Terms of Speed of Delivery Across Southeast Asia. iPrice. Available at: https://iprice.sg/trends/insights/singapore-consumers-happy-with-the-state-of-delivery-but-most-demanding-in-terms-of-speed-of-delivery-across-southeast-asia/.
- Unni, S., et al. (2015) E-retail and Online Customer Satisfaction: Differential Impact of Delivery Time in Indian Metros. Proceedings of the IEEE International Conference on Computational Intelligence and Computing Research. doi.org/10.1109/ICCIC.2015.7435808.
- Al Karim, R (2013) Customer Satisfaction in Online Shopping: A Study into the Reasons for Motivations and Inhibitions. IOSR Journal of Business and Management, 11(6), pp. 13–20. doi.org/10.9790/487X-1161320.
- Lewis, M., et al. (2006) An Empirical Study of the Impact of Nonlinear Shipping and Handling Fees on Purchase Incidence and Expenditure Decisions. Marketing Science, 25(1), pp. 51–64. Available at: https://www.jstor.org/stable/40057024.
- Esper, T. L., et al. (2003) The Last Mile: An Examination of Effects of Online Retail Delivery Strategies on Consumers. Journal of Business Logistics, 24(2), pp. 177–203. doi.org/10.1002/j.2158-1592.2003.tb00051.x.
- SimilarWeb (2019) Taobao Statistics. Available at: https://www.similarweb.com/website/taobao.com/
- Brennan, T (2016) Consumer Engagement Driving Growth for Mobile Taobao. Alizila.
- Stephanie Davis, S. S., et al. (2019) e-Conomy SEA 2019: Swipe Up and To the Right: Southeast Asia’s $100 Billion Internet Economy. Google & Temasek/Bain, e-Conomy SEA.
- Mordor Intelligence (2020) Southeast Asia Cross-Border E-Commerce Market - Segmented by Business Type, Product Type, and Geography - Growth, Trends, and Forecast (2020-2025). Mordor Intelligence.
- ECTA (2011) Guideline for the Calculation of Co2-Emissions From Freight Transport Operations. ECTA.
- Devonshire-Ellis, C (2019) China’s State Council Approves 24 New Cross-Border E-Commerce Zones. China Briefing.
- UK BEIS (2019) Greenhouse Gas Reporting: Conversion Factors 2019. UK BEIS.
- MEWR (2015) Sustainable Singapore Blueprint 2015. MEWR.
- International Post Corporation (2018) IPC Cross-Border E-Commerce Shopper Survey 2017. International Post Corporation.
- Weideli, D & Cheikhrouhou, N (2013) Environmental Analysis of US Online Shopping. MIT Center for Transportation & Logistics.
- Statista (2016) Number of Online Shopping Orders Per Capita 2016, by Region. Statista.
- Dawson, C (2019) Failed Deliveries Cost Industry £1.6bn Each Year – What Can be Done About It?
- Picodi.com (2019) Online shopping in Singapore.
- iPrice (2017) A Crazy World of Singaporean Online Shoppers: Which One are you?