The use of ICP-OES to determine arsenic (As) and selenium (Se) poses specific challenges. These elements are weak emitters and both As and Se are generally present in low concentrations in most sample types.
These factors make it especially difficult to measure low levels of As and Se using ICP-OES.
One potential solution to this issue lies in enhancing the sensitivity of As and Se by converting them to their gas-phase hydride species. This conversion is achieved via the following reactions:
| NaBH4 + 3 H2O + HCl → H3BO3 + NaCl + 8H |
[Eq. 1] |
| As3+ + H (excess) → AsH3 + H2 (excess) |
[Eq. 2] |
| Se4+ + H (excess) → SeH2 + H2 (excess) |
[Eq. 3] |
An increased signal is generated via the introduction of gases into the plasma, allowing the removal of aqueous components and subsequently the measurement of lower concentrations.
The most effective approach to this analysis is via a continuous flow system to continuously pump and mix samples and a reductant on-line. Argon is added to the mixture to transport hydride gases to the plasma, and the aqueous component is removed and pumped to waste.
Forming hydride species and ensuring optimal sensitivities requires As and Se to be in their lower oxidation states - AsIII and SeIV. If As and Se exist in other oxidation states, these will either have lower sensitivity (As) or will fail to form hydrides (Se).
To ensure these lower oxidation states, every sample and standard should be subjected to a pre-reduction step prior to analysis, reducing any As and Se to AsIII and SeIV.
There have been many studies looking into the reduction of As and Se, each looking to achieve the strongest signals to facilitate the measurement of ever-lower concentrations.1,2,3,4,5,6,7
The reduction chemistries of As and Se are different, however, meaning that any sample analyzed for low concentrations of As and Se via hydride generation will require two different pre-reduction steps to be performed.
The sample must be effectively run twice – an impractical process in many settings.
This article explores approaches to measuring As and Se in drinking water, using PerkinElmer’s Avio® 220 Max hybrid simultaneous ICP-OES and a single pre-reduction procedure.
Experimental
Sample Preparation
To ensure an accurate assessment of the pre-reduction procedure’s effectiveness, AsV and SeVI standards (High Purity Standards, Charleston, South Carolina, USA) were used exclusively. These standards were selected because these oxidation states will have lower sensitivity (AsV) or do not form hydrides (SeVI).
The complete range of samples, blanks, calibration standards and spikes were prepared in 1% (v/v) nitric acid before undergoing the following pre-reduction procedure.
Identical volumes of concentrated hydrochloric acid (37%) and sample (or standard) were combined in 50 mL DigiTUBEs (PerkinElmer, Shelton, Connecticut, USA).
Table 1. Sample preparation block program for pre-reduction of arsenic and selenium. Source: PerkinElmer, Inc.
| Step |
Value |
| Time to Temp / Ramp Function |
1 |
| Time at Temp |
20 min |
| Setpoint Temp |
100 °C |
These tubes were then capped, shaken and heated in an SPB sample preparation block (PerkinElmer) using a pre-determined program (Table 1).
Following heating, the DigiTUBEs were removed and permitted to cool to room temperature prior to dilution to their final volume using deionized (DI) water.
This process was evaluated at two volumes, both of which provided equivalent results:
- 10 mL of sample + 10 mL HCl diluted to 25 mL final volume
- 20 mL sample + 20 mL HCl diluted to 50 mL final volume
Each preparation procedure results in a 2.5x sample dilution. It should be noted that the concentrations listed here represent the nominal, pre-dilution concentration - the actual concentrations inserted into the plasma are 2.5x less.
Heating time in the sample preparation block is defined by the concentrations of As, Se and the waters’ mineral content, with more complex matrices and higher analyte concentrations requiring longer heating times.
The 20-minute heating time selected in the example presented here was sufficient to accommodate the concentrations and matrices evaluated.
The hydride-forming solution was comprised of 0.5% NaBH4 (w/v) + 0.05% NaOH (w/v). Final samples were in 40% HCl (v/v), but it was determined that a wash solution of 15% HCl (v/v) was suitable for this study.
Quantitative measurements were performed against linear-through-zero external calibration curves from 2, 5, 10 and 20 ppb standards prepared from AsV and SeVI stock standards. These were then subjected to an identical pre-reduction process to the samples.
To evaluate the accuracy, the study employed the certified standard Trace Metals in Drinking Water-B (High Purity Standards) in conjunction with spike recoveries in locally collected tap water samples.
Spikes were made from the AsV and SeVI stock solutions – these were added prior to the pre-reduction process.
Instrumental Parameters
All analyses were performed using an Avio 220 Max hybrid simultaneous ICP-OES. Instrument conditions are presented in Table 2 and are used to monitor As 188.979 nm and Se 196.028 nm lines.
Table 2. Avio 220 Max ICP-OES instrumental parameters. Source: PerkinElmer, Inc.
| Component / Parameter |
Description / Value |
| Sample Uptake Rate |
1.5 mL/min |
| Spray Chamber |
Baffled Glass Cyclonic |
| Injector |
Alumina, 1.2 mm id |
| RF Power |
1500 W |
| Plasma Flow |
8 L/min |
| Auxiliary Flow |
0.2 L/min |
| Nebulizer Flow |
0.55 L/min |
| Torch Position |
-3 |
| Plasma View |
Axial |
| Integration |
Manual |
| Read Time |
10 sec |
| Integration Time |
2 sec |
| Sample Uptake Tubing |
Red/Red (1.14 mm id) PVC |
| Reductant Tubing |
Black/Black (0.76 mm id) flared PVC |
| Drain Tubing |
Black/White (3.18 mm id) PVC |
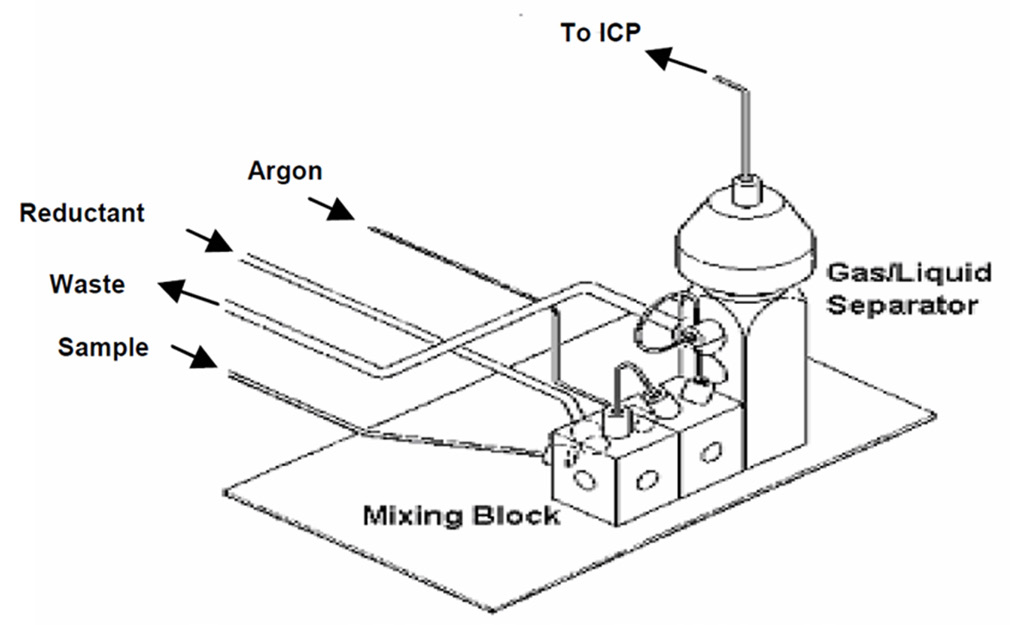
Figure 1. Chemifold assembly for continuous flow hydride generation. Image Credit: PerkinElmer, Inc.
A Chemifold mixing block (Figure 1) was used to mix the sample on-line, combining this with the NaBH4/NaOH solution to create the hydrides.
Hydride gases were then separated from the liquid using the Chemifold’s gas-liquid separator component, with the gas passing through the spray chamber before entering the plasma.
It is possible to achieve equivalent results without the spray chamber, but it was noted that precision was improved, and lower RSDs were lower when the spray chamber was used.
Hydride gases entered the spray chamber via a 5 cm piece of the Avio nebulizer gas line that had been cut off and fitted in the spray chamber in place of a nebulizer. The same fitting also secured the tubing.
The universal spray chamber adapter (Part No. N0782031) is also a viable option in terms of coupling the output of the Chemifold to the spray chamber.
Manual integration was used with an integration time of 2 seconds and a read time of 10 seconds. This helped further improve precision. These parameters also resulted in five readings per replicate, enhancing RSDs while enabling the accurate measurement of lower concentrations.
To streamline data analysis, automatic background correction was applied to every analysis. This feature is available in Syngistix™ for ICP software v. 5.1 or higher.
Results and Discussion
This study employed AsV and SeVI standards throughout because these oxidation states do not produce hydrides.
This choice helped the researchers better evaluate the effectiveness of the pre-reduction procedure – an essential consideration when analyzing unknown samples with the potential for As and Se to exist in different oxidation states.
Beginning with AsV and SeVI represents the worst-case scenario in a specific sample, whereby As and Se exist entirely in oxidation states that do not produce hydrides.
An initial study was conducted to determine the lowest concentrations that could be accurately calibrated, evaluating the calibration curve by using the regression and the residual errors.
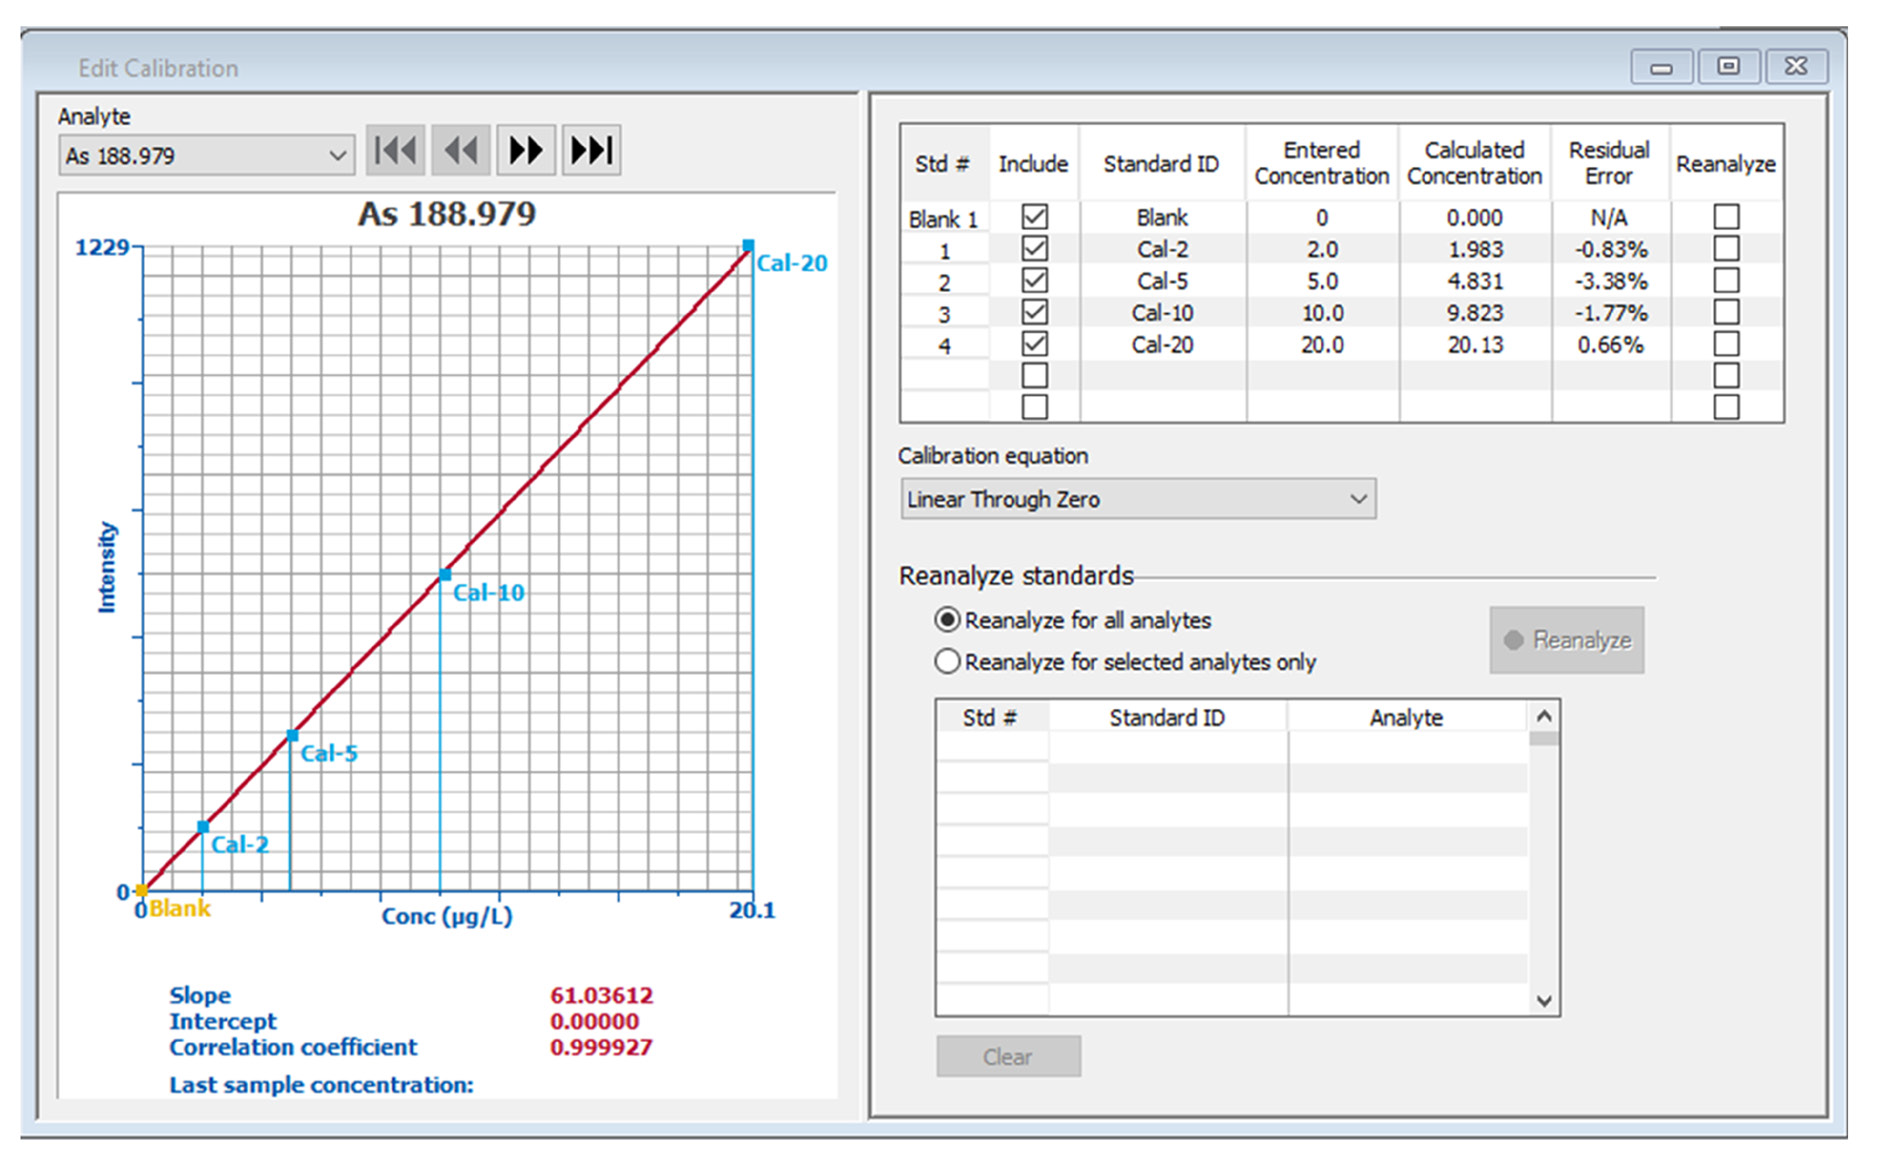
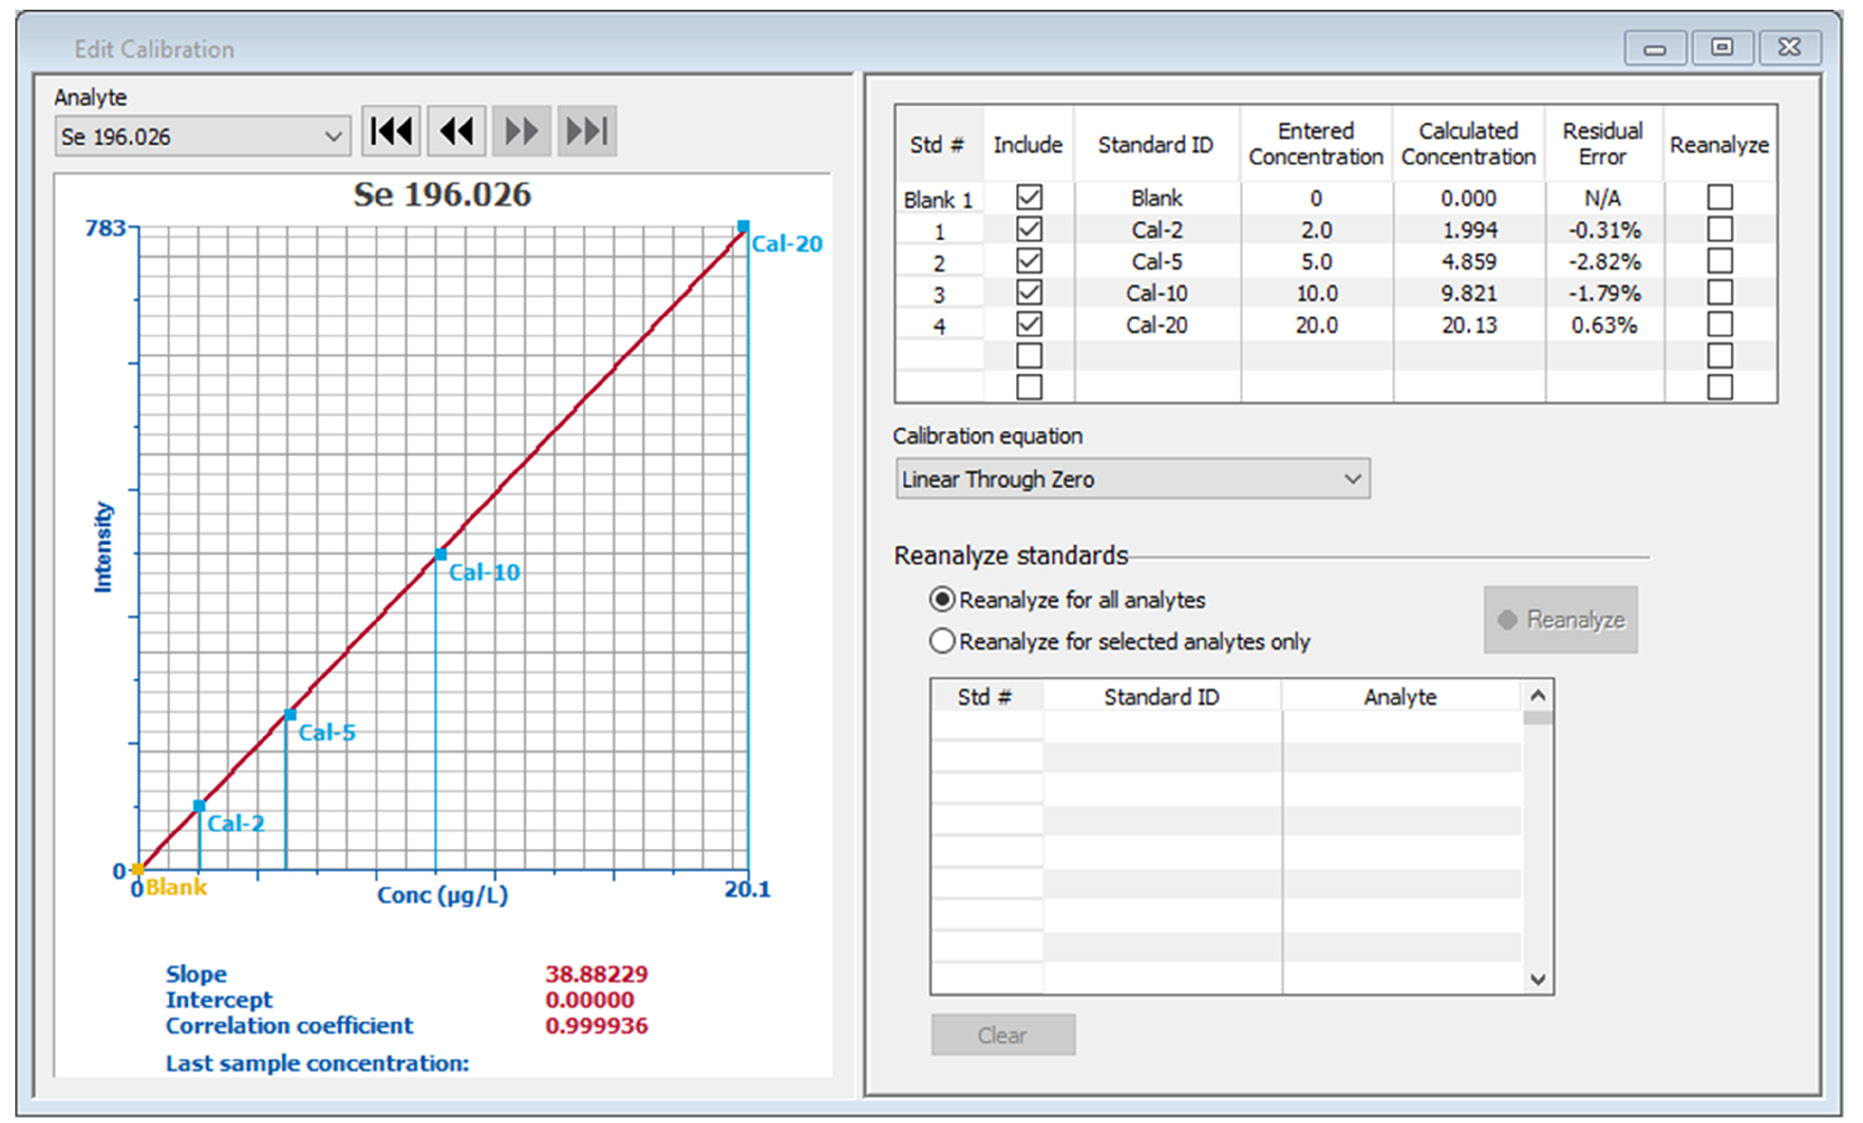
Figure 2. Calibration curves for arsenic and selenium. Image Credit: PerkinElmer, Inc.
Equal concentrations of As and Se were utilized in the calibration standards. Typical calibration curves (Figure 2) confirm that it is possible to accurately measure standards with a nominal concentration as low as 2 ppb, with regressions being greater than 0.9999.
Higher concentration standards can falsely improve regression and cause low concentrations to erroneously fall on the curve,8 meaning that the calibration standard’s residual errors offer a more effective means of evaluating standard accuracy.
Residual errors for all standards are less than 3.5% for both the As and Se curves, illustrating the accuracy of all the standards.
Figure 3. As and Se recoveries in Trace Metals in Drinking Water-B. Image Credit: PerkinElmer, Inc.
Trace Metals in Drinking Water-B (containing 10 ppb As and 11 ppb Se) were measured to evaluate the accuracy of the methodology. Recoveries for both elements were found to be within 10% of the certified values over four separate analyses (Figure 3), confidently validating the accuracy of the methodology.
Several locally collected tap water samples were analyzed. None of these were found to contain As or Se, so to determine the methodology’s lowest accurately measurable concentrations, a tap water sample was spiked with 1, 2, 5 and 10 ppb AsV and SeVI and analyzed.
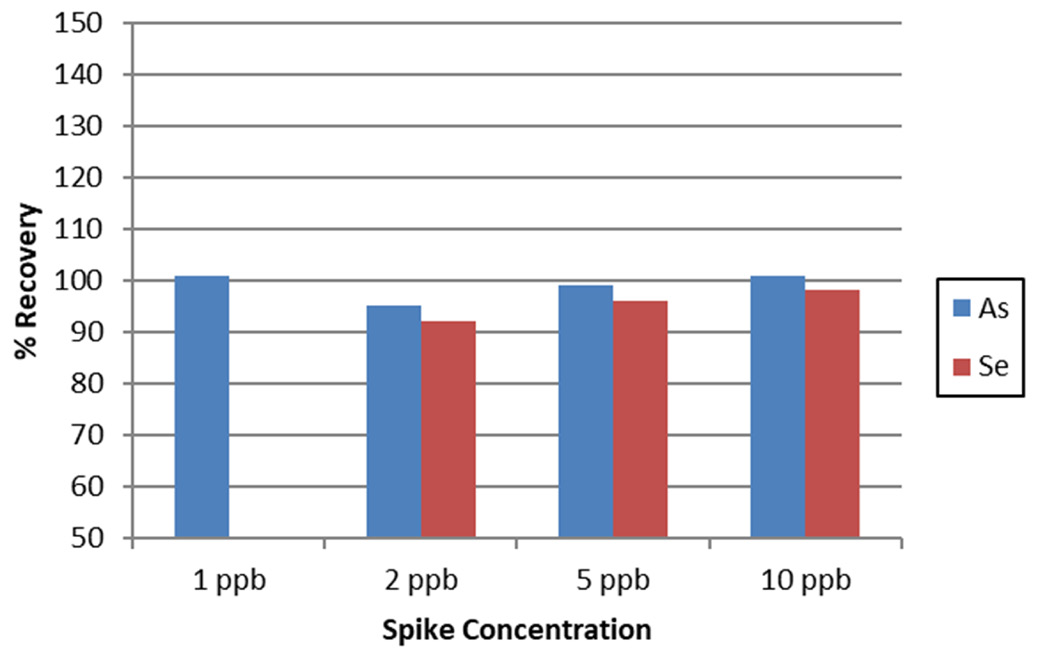
Figure 4. AsV and SeVI spike recoveries in tap water. Image Credit: PerkinElmer, Inc.
Figure 4 shows the typical recoveries, with these results confirming that as low as 1 ppb As and 2 ppb Se can be accurately measured – far below global maximum permittable limits for As (typically around 10 ppb) and Se (typically 10-50 ppb) in drinking water.
When considering the sample preparation dilution factor, the Avio 220 Max ICP-OES conducts accurate measurements on 0.4 ppb As and 0.8 ppb Se – unparalleled concentrations for accurate measurement via ICP-OES.
If lower As and Se concentrations are required, other published pre-reduction procedures can be employed for As2,3,4 and Se,6,7 to enhance sensitivity.
These methodologies are specific to As or Se, however, meaning that the sample would need to be prepared and analyzed twice (using different procedures) to acquire results for both As and Se.
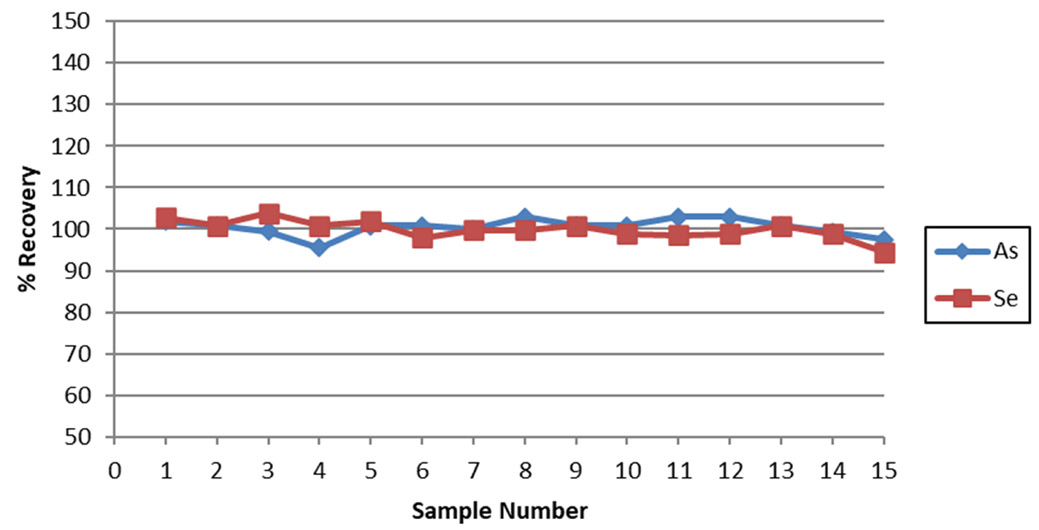
Figure 5. Recovery of a 10 ppb AsV and SeVI spike in tap water over 15 consecutive measurements. Image Credit: PerkinElmer, Inc.
A tap water sample was spiked with 10 ppb AsV and SeVI and analyzed 15 times to evaluate the stability of this methodology. All recoveries for both elements were found to be within 10% (Figure 5), establishing the system’s stability.
Detection limits were assessed by carrying a blank through the pre-reduction procedures and measuring this against the calibration curve. This was done using the Detection Limits tool in the Syngistix software, multiplying the standard deviation of 10 replicates by 3.
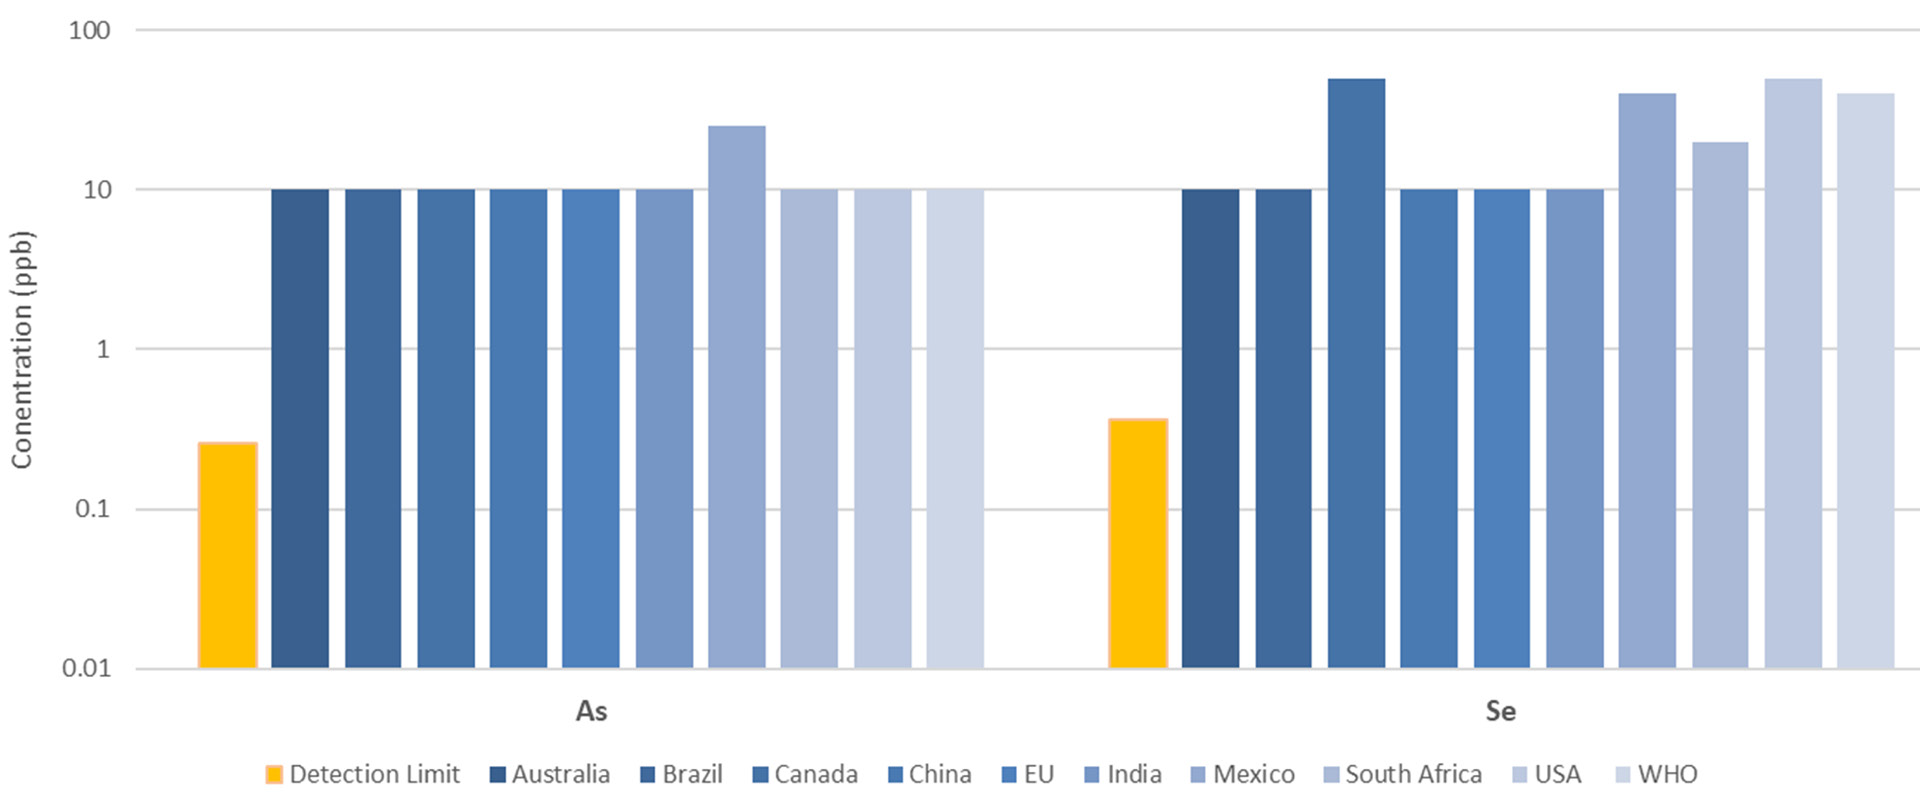
Figure 6. Arsenic and selenium detection limits (orange), compared to regulated concentrations in drinking waters around the world (shades of blue). Image Credit: PerkinElmer, Inc.
Detection limits for As and Se were found to be less than 0.5 ppb, far below regulated maximum limits around the world (Figure 6).
Conclusion
The study presented here showcases a methodology suitable for measuring low concentrations of As and Se via continuous-flow hydride generation on the Avio 220 Max hybrid simultaneous ICP-OES.
This methodology uses a single pre-reduction procedure for AsV and SeVI.
While this pre-reduction procedure alone did not result in optimum sensitivity for As or Se, the excellent sensitivity of the Avio 220 Max allowed measurable concentrations far below those typically achieved via ICP-OES with conventional sample introduction.
References
- “Continuous Flow Hydride Generation Using the Optima ICP”, Field Application Report, PerkinElmer, 2004.
- Welz B., Sucmanová M., Analyst, 118, 1993, 1417-1423.
- Chen H., Anal. Chem. 64, 1992, 667-672.
- Yin X., Hofmann E., Ludke C., Fresenius J. Anal. Chem. 355, 1996, 324-326.
- “Recommended Analytical Conditions and General Information for Flow Injection Mercury/Hydride Analyses Using the PerkinElmer FIAS 100/400”, Technical Note, PerkinElmer, 2004.
- Wickstrom T., Lund W., Bye R., J. Anal. At. Spectrom. 6, 1991, 389-391.
- Maleki N., Safavi A., Doroodmand M.M., Talanta, 66(4), 2005, 858-862.
- “Sensitivity, Background, Noise, and Calibration in Atomic Spectroscopy: Effect on Accuracy and Detection Limits”, White Paper, PerkinElmer, 2017.
Acknowledgments
Produced from materials originally authored by Ken Neubauer and Riccardo Magarini from PerkinElmer, Inc.
Consumables Used
Table 3. Source: PerkinElmer, Inc.
| Component |
Part Number |
| Hydride Generation Kit for Avio ICP-OES Instruments |
N0810433 |
| Sample Tubing, PVC, Red/Red (1.14 mm id) |
09908585 |
| Reductant Tubing, Flared PVC, Black/Black (0.76 mm id) |
N0777043 |
| Drain Tubing, PVC, Black/White (3.1 mm id) |
N8122012 |
| DigiTUBEs, 50 mL with caps |
N9308037 |

This information has been sourced, reviewed and adapted from materials provided by PerkinElmer, Inc.
For more information on this source, please visit PerkinElmer, Inc.