The aviation industry contributes largely to global warming because of the climate pollutants it generates. Looking at Klöwer, M. et al's journal paper published in Environmental Research Letters, this article analyzes aviation’s total warming footprint by modeling CO2 and non-CO2 effects.
Image Credit: Aerial-motion/Shutterstock.com
Aircraft alters the radiative balance of the planet through emissions and contrails, contributing to global warming. In recent years, global aviation has increased dramatically and the carbon footprint of top emitters is usually dominated by air travel.
Aviation is a huge industry and is one of the most carbon-intensive ways to travel. The pandemic resulted in the cancellation of the majority of flights from March 2020, which resulted in a large reduction in carbon emissions and other climate pollutants.
To limit global warming to below 2 °C, all emission sectors need to be decarbonized. The aviation industry was responsible for around 2.4% of global annual carbon emissions before the pandemic.
Nitrogen oxide (NOx) emissions at altitudes of 8-12 km lead to complex chemical reactions in the atmosphere and also cirrus cloud formation by condensation trails. This article analyzes the total climate effects caused by aviation, taking both CO2 and non-CO2 effects into account. It also presents various scenarios that depict possible futures of aviation until 2050.
How Aviation Affects the Climate
Until 2016–2019, aircraft engines used more than 1 billion liters of fuel per day, emitting 1.23 kg of water vapor (H2O), 3.16 kg of CO2, 1.2 g of sulfur (SO2), up to 15.14 g of NOx, and 0.03 g of black carbon (soot) per kg of fuel (see Table 1). As nitrogen oxides react in the atmosphere, it alters the radiative balance of other gases, including ozone (O3), methane (CH4), and stratospheric water vapor (H2O), thus indirectly affecting the climate.
Table 1. Best estimate emission indices and effective radiative forcing for aviation emissions and contrail formation from Lee et al. (2021). Effective radiative forcings from NOx arise via reaction with CH4, O3 (short and long-term), and stratospheric water vapor and are noted therein. Consequently, the radiative forcings of these scale with the emission of NOx. Source: Klöwer, et al., 2021.
| |
Emission index
(per kg fuel) |
Effective radiative
forcing |
| Carbon dioxide CO2 |
3.16 kg |
(From climate model) |
| Water vapour H2O |
1.231 kg |
0.0052 mW m−2 (Tg (H2O) yr−1)−1 |
| Black carbon (BC) |
0.03 g |
100.67 mW m−2 (Tg (BC) yr−1)−1 |
| Sulphate SO2 |
1.2 g |
−19.91 mW m−2 (Tg (SO2) yr−1)−1 |
| Nitrogen oxides NOx |
15.14 g (in 2018) |
(Via CH4, O3 and strat. H2O) |
| Methane CH4 decrease |
— |
−18.69 mW m−2 (Tg (N) yr−1)−1 |
| Ozone O3 short-term increase |
— |
34.44 mW m−2 (Tg (N) yr−1)−1 |
| Ozone O3 long-term decrease |
— |
−9.35 mW m−2 (Tg (N) yr−1)−1 |
| Stratospheric H2O (SWV) decrease |
— |
−2.8 mW m−2 (Tg (N) yr−1)−1 |
| Contrail cirrus |
— |
9.36 × 10⁻¹⁰ mW m−2 km−1 |
Aircraft also form condensation trails on their paths, and these form cirrus clouds when persistent and increase cloudiness. These persistent contrail formations and emissions are transformed into effective radiative forcings.
The study employs data from the International Energy Agency (IEA) on jet fuel consumption and up-to-date evaluations of non-CO2 radiative forcing.
Scenarios for 2050
The advent of the pandemic led to travel restrictions and there were fewer than 5000 flights—an 80% decrease from pre-pandemic air traffic (see Figure 1).
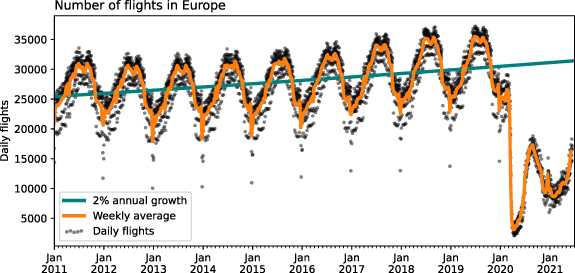
Figure 1. Daily flights over Europe between 2011 and the present. The seasonal cycle shows more flights in summer and less in winter with a strong decrease associated with holidays at the end of the year. The number of flights increased by about 2% yr−1 pre-COVID in Europe. The pandemic forced many airplanes to the ground since March 2020 with only a partial recovery in summer 2020 and 2021. Data from EUROCONTROL. Image Credit: Klöwer, et al., 2021.
Even though the aviation industry partially recovered after the lockdown, the number of flights decreased by about 45% on average in 2020 (see Figure 2b).
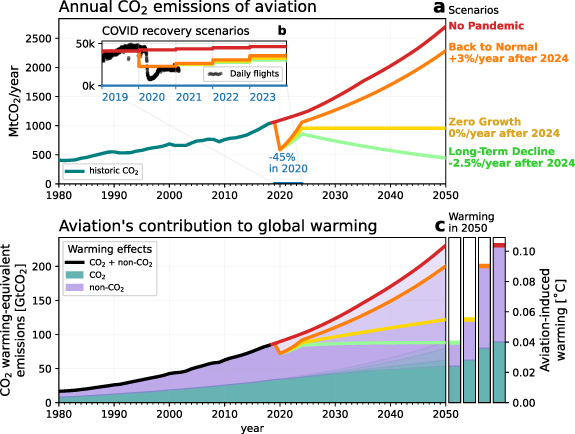
Figure 2. Aviation’s contribution to global warming to 2050. (a) Annual historic and future annual carbon dioxide (CO2) emissions of aviation following four scenarios: No Pandemic, Back to Normal, Zero Long-Term Growth, and Long-Term Decline as explained in the text. (b) Daily flights of selected airports globally between 2019 and November 2020 and annual averages for all scenarios. (c) Cumulative warming-equivalent emissions of CO2 and non-CO2 effects of aviation since 1940 and the corresponding aviation-induced global warming. Scenarios are color-coded as in (a). Image Credit: Klöwer, et al., 2021.
With the introduction of COVID-19 vaccines, the air traffic is anticipated to increase. It is still unclear if the air traffic would reach the same level as the pre-Covid period owing to the emergence of variants and also the boom in virtual technology, which has made a curb to business meetings. The research provides four scenarios to elucidate the possible futures of global aviation:
Scenario 1: No Pandemic—This scenario presumes that there is no COVID-19 pandemic and growth in air traffic CO2 emissions of about 3% per year.
Scenario 2: Back to Normal—This scenario presumes a post-COVID recovery for 2021–2024 at 16% yearly increase and the pre-COVID level is reached in 2024.
Scenario 3: Zero Long-Term Growth—Assuming a 13% annual growth for the recovery period 2021–2024 and zero growth thereafter, around 90% of the pre-COVID level would be attained in 2024.
Scenario 4: Long-Term Decline—Assuming a 10% yearly growth for the recovery period 2021–2024 and a decline thereafter.
In all the scenarios, the emissions indices were unchanged. The researchers converted the annual air traffic from these scenarios to jet fuel consumption and CO2 emissions.
Aviation’s Impact on Global Warming
Emissions of global aviation in 2019 were about 1 billion tons of CO2 (GtCO2) and this emission is expected to more than double by 2050.
As a huge fraction of the increase in atmospheric CO2 stays for many 1000s of years, the recent emissions of CO2 alone do not create global warming. The pandemic made a negligible impact on the CO2-induced warming from aviation.
Aircraft also impact the climate through other non-CO2 climate pollutants. Hence, the long-lasting effects of aviation are from different time scales. The aviation industry contributes 4% of global warming.
Considering the 3% annual growth scenario, Back to Normal, aviation would have bestowed 0.09 ± 0.04 °C to global warming by 2050. The pandemic only delayed the contribution of aviation by about five years.
However, if global aviation declines with no change in the present flight practices or fuel mix, this would result in an increase in aviation-induced warming with immediate effect.
Potential of Zero-Carbon Fuels
The obvious option to decrease aviation’s CO2 emissions is introducing low-carbon fuel (bio or synthetic) as an alternative. Additional scenarios were created to identify the effects of zero-carbon fuels on aviation-induced warming.
Scenario 5—This scenario assumes a 3% increase of zero-carbon fuels per year from 2024 and a growth in air traffic. The increased CO2 emissions from increased air traffic are thus compensated.
Scenario 6—Here a 90% zero-carbon fuel by 2050 is assumed with a yearly 5.8% increase of zero-carbon fuels. This lowers the annual CO2 emissions over time.
Also, the fewer soot particles in bio or synthetic fuels contrail formation are assumed to be decreased by low-carbon fuels. Non-CO2 effects can also be altered by changing flight routes such as adjusting aircraft cruise altitude.
The Back to Normal scenario with increased use of low-carbon fuels and attaining 55% carbon-neutrality by 2050 is analyzed (see Figure 3). This scenario decreases aviation’s contribution to global warming insufficiently.
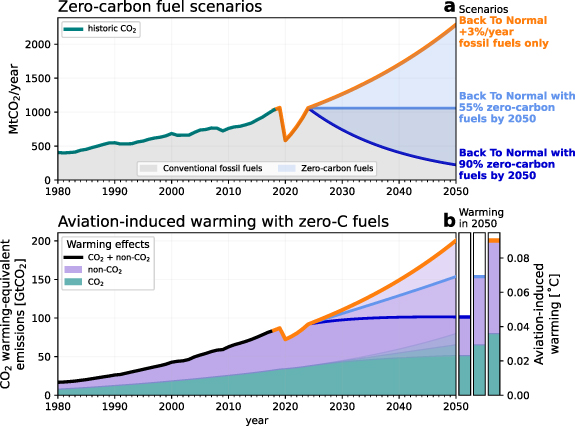
Figure 3. Zero-carbon fuels (bio or synthetic) can limit aviation-induced warming only when they replace fossil fuels by 2050. (a) CO2 emissions of aviation following the 3% annual air traffic growth of the Back to Normal scenario (as in Figure 1) but with increasing use of zero-carbon fuels. (b) Aviation-induced warming in two scenarios: 55% zero-carbon fuels by 2050 will not limit the warming, only the highly ambitious scenario of 90% carbon neutrality reaches maximum warming of about 0.04 °C. Scenarios are color-coded as in (a). Image Credit: Klöwer, et al., 2021.
Warming Footprints Instead of Carbon Footprints
The majority of the carbon footprint calculators employ a constant—multiplication factor—to include the non-CO2 effects of aviation in a simplified way (see Figure 4). These multiplication factors are scenario and time-dependent.
Moreover, for all scenarios, the warming footprint of aviation is twice its carbon footprint in the coming years, emphasizing that non-CO2 effects are non-negligible to analyze the contribution of aviation to global warming.
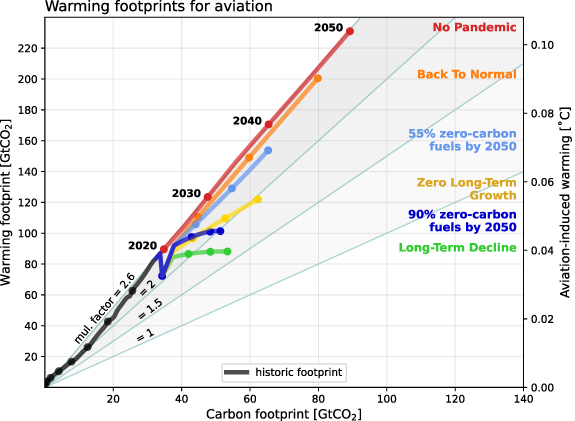
Figure 4. The warming footprint of aviation is a scenario and time-dependent multiplicative of its cumulative carbon footprint, about 2–2.6× larger in recent decades. Diagonal lines represent a constant multiplication factor often used in carbon footprint analyses to simplify the non-CO2 effects of aviation. Dots represent decades for all scenarios and historic emissions. Warming footprints are the cumulative CO2 warming-equivalent emissions, including both CO2 and non-CO2 effects. Image Credit: Klöwer, et al., 2021.
Discussion
A substantial ongoing reduction of 2.5% yr−1 in aviation CO2 emissions restricts the aviation sector’s contribution to further global warming. Low carbon fuels do not substantially decrease aviation’s contribution to warming as it gets compensated by air traffic growth.
Journal Reference:
Klöwer, M., Allen, M. R., Lee, D. S., Proud, S. R., Gallagher, L., Skowron, A. (2021) Quantifying aviation’s contribution to global warming. Environmental Research Letters, 16(10). Available at: https://iopscience.iop.org/article/10.1088/1748-9326/ac286e.
References and Further Reading
- Burkhardt, U., et al. (2018) Mitigating the contrail cirrus climate impact by reducing aircraft soot number emissions. npj Climate and Atmospheric Science, 1, pp. 1–7. doi.org/10.1038/s41612-018-0046-4.
- Cain, M., et al. (2019) Improved calculation of warming-equivalent emissions for short-lived climate pollutants. npj Climate and Atmospheric Science, 2, pp. 1–7 doi.org/10.1038/s41612-019-0086-4.
- Chen, C-C & Gettelman, A (2013) Simulated radiative forcing from contrails and contrail cirrus. Atmospheric Chemistry and Physics, 13, pp. 12525–12536. doi.org/10.5194/acp-13-12525-2013.
- Creutzig, F., et al. (2015) Transport: a roadblock to climate change mitigation? Science, 350, pp. 911–912. doi.org/10.1126/science.aac8033.
- Fleming, G G & de Lépinay (2019) Environmental trends in aviation to 2050 ICAO Environmental Report. Available at: https://www.icao.int/environmental-protection/Documents/EnvironmentalReports/2019/ENVReport2019_pg17-23.pdf (Accessed 28 September 2021).
- Gore, T & Ratcliff, A (2020) Confronting carbon inequality: putting climate justice at the heart of the COVID-19 recovery. Available at: https://oxfamilibrary.openrepository.com/bitstream/handle/10546/621052/mb-confronting-carbon-inequality-210920-en.pdf
- Gössling, S (2020) Risks, resilience, and pathways to sustainable aviation: a COVID-19 perspective. Journal of Air Transport Management, 89, p. 101933. doi.org/10.1016/j.jairtraman.2020.101933.
- Grewe, V., et al. (2021) Evaluating the climate impact of aviation emission scenarios towards the Paris Agreement including COVID-19 effects. Nature Communications, 12, p. 3841. doi.org/10.1038/s41467-021-24091-y.
- Haustein, K., et al. (2017) A real-time Global Warming Index. Scientific Reports, 7, p. 15417. doi.org/10.1038/s41598-017-14828-5.
- IEA 2020 Energy technology perspectives 2020—analysis available at: www.iea.org/reports/energy-technology-perspectives-2020.
- Inman, M (2008) Carbon is forever. Nature Climate Change, 1, pp. 156–158. doi.org/10.1038/climate.2008.122.
- Intergovernmental Panel on Climate Change 2015 Climate Change 2014: Synthesis Report. Available at: https://www.ipcc.ch/report/ar5/syr/.
- Intergovernmental Panel on Climate Change 2018 Global warming of 1.5 °. Available at: https://www.ipcc.ch/sr15/.
- International Air Transport Association 2020 IATA annual review 2020. Available at: www.iata.org/en/publications/annual-review/.
- Kärcher, B (2021) Process-oriented analysis of aircraft soot-cirrus interactions constrains the climate impact of aviation. Communications Earth & Environment, 2, pp. 1–9. doi.org/10.1038/s43247-021-00175-x.
- Klöwer, M., et al. (2021) milankl/FlyingClimate: Supplementary material for Kloewer et al. 2021 (v1.1) Zenodo. Available at: https://doi.org/10.5281/zenodo.5534138.
- le Quéré, C., et al. (2020) Temporary reduction in daily global CO2 emissions during the COVID-19 forced confinement. Nature Climate Change, 10, pp. 647–653. doi.org/10.1038/s41558-020-0797-x.
- Lee, D. S., et al. (2021) The contribution of global aviation to anthropogenic climate forcing for 2000–2018. Atmospheric Environment, 244, p. 117834 doi.org/10.1016/j.atmosenv.2020.117834.
- Lee, D. S., et al. (2009) Aviation and global climate change in the 21st century. Atmospheric Environment, 43, pp. 3520–3537. doi.org/10.1016/j.atmosenv.2009.04.024.
- Lenzen, M., et al. (2018) The carbon footprint of global tourism. Nature Climate Change, 8, pp. 522–528. doi.org/10.1038/s41558-018-0141-x.
- Moran, D (2018) Carbon footprints of 13 000 cities. Environmental Research Letters, 13, p. 064041. doi.org/10.1088/1748-9326/aac72a.
- Morice, C P (2020) An Updated Assessment of Near-Surface Temperature Change From 1850: The HadCRUT5 Data Set. JGR Atmospheres, 126, p. e2019JD032361. doi.org/10.1029/2019JD032361.
- Proud, S R (2020) Go-around detection using crowd-sourced ADS-B position data. Aerospace, 7, p. 16. doi.org/10.3390/aerospace7020016.
- Sausen, R & Schumann, U (2000) Estimates of the climate response to aircraft CO2 and NOx emissions scenarios. Climatic Change, 44, pp. 27–58. doi.org/10.1023/A:1005579306109.
- Schäfer, M (2014) Bringing up OpenSky: a large-scale ADS-B sensor network for research IPSN-14. Proceedings of the 13th International Symposium on Information Processing in Sensor Networks, pp. 83–94. Available at: https://doi.org/10.1109/IPSN.2014.6846743.
- Schumann, U (2000) Influence of propulsion efficiency on contrail formation. Aerospace Science and Technology, 4, pp. 391–401. doi.org/10.1016/S1270-9638(00)01062-2.
- Skowron, A., et al. (2021) Greater fuel efficiency is potentially preferable to reducing NOx emissions for aviation’s climate impacts. Nature Communications, 12, pp. 1–8 doi.org/10.1038/s41467-020-20771-3.
- Smith, C.-J., et al. (2018) FAIR v1.3: a simple emissions-based impulse response and carbon cycle model. Geoscientific Model Development, 11, pp. 2273–2297. doi.org/10.5194/gmd-11-2273-2018.
- Smith, M., et al. (2021) Further improvement of warming-equivalent emissions calculation. npj Climate and Atmospheric Science, 4, pp. 19. doi.org/10.1038/s41612-021-00169-8.
- Strohmeier, M., et al. (2021) Crowdsourced air traffic data from the OpenSky network 2019–2020. Earth System Science Data, 13, pp. 357–366. doi.org/10.5194/essd-13-357-2021.
- Teoh, R., et al. (2020) Mitigating the climate forcing of aircraft contrails by small-scale diversions and technology adoption. Environmental Science & Technology. 54, pp. 2941–2950. doi.org/10.1021/acs.est.9b05608.
- UK Climate Change Committee 2020 Sixth carbon budget. Available at: www.theccc.org.uk/publication/sixth-carbon-budget/.
- Voigt, C., et al. (2021) Cleaner burning aviation fuels can reduce contrail cloudiness. Communications Earth and Environment, 2, pp. 1–10. doi.org/10.1038/s43247-021-00174-y.
- Yao, B., et al (2020) Transforming carbon dioxide into jet fuel using an organic combustion-synthesized Fe-Mn-K catalyst. Nature Communications, 11, p. 6395. doi.org/10.1038/s41467-020-20214-z.