The US Climate Normal is calculated by the National Oceanic and Atmospheric Administration (NOAA) using decadal averages of temperature and precipitation from the most recent climatological period. While the US Climate Normal can help predict what will happen locally in the near future, fixed historical standards may be better for characterizing current climate shifts and ecological disturbances.

Image Credit: Don Pablo/Shutterstock.com
The idea that exceptional climate norms are evolving in the ocean has been fostered by persistent warming of sea surface temperatures (SST) and increased frequency and severity of intense climatic occurrences. The identification and attributions of extreme marine heat occurrences under observed and modeled climate variability have received a lot of interest. Hobday devised a method for calculating the frequency and intensity of maritime heatwaves (MHWs).
Researchers have developed new statistical frameworks that allow for a more flexible characterization of extreme maritime heat events based on locally specified fixed or sliding baselines and a seasonally changing threshold (e.g., 90th) that may be used to a wide range of spatial and temporal scales.
Background warming enhances the severity, frequency, and length of severe occurrences, according to the statistical study of past, current, and future extreme events. However, little is known about how extreme occurrences, particularly those linked to warming, have developed historically to become the new normal as a result of global warming.
While these projection-based studies are critical to climate adaptation efforts, the stochastic character of global climate systems can lead to significant errors and biases.
All Exclusive Economic Zones, Biogeochemical Provinces, and Large Maritime Ecosystems were studied for variations in the frequency of historical marine heat extremes. The goal of this study is to characterize the growth and expansion of extreme heat in the worldwide ocean, as well as to identify places with the highest and lowest frequency of extreme heat.
The current work is to contextualize the current state of marine regions, indicating current climate disruptions and ecosystem risk, as well as to offer a timeline for the global ocean when historically benchmarked extreme events took place more than 50% of the time, indicating that they have become “normal.”
Methodology
To examine centennial variations in worldwide occurrences of extreme marine heat events, the study utilized 150 years (1870–2019) of monthly reconstructed historical SST data sources: the Hadley Centre Sea Ice and SST dataset and the Characteristics of the Global SST data (COBESSTv2).
To illustrate any differences in the technique, the researchers compared the LEHI’s worldwide variability to a more standard SST anomaly measure. Researchers used the R programming environment to do all of our data manipulation and analysis. The data and scripts are shared through open access repositories and the Open Science Framework.
Results
From 1980 to 2019, Figure 1 depicts the decadal development of worldwide extreme maritime heat events.
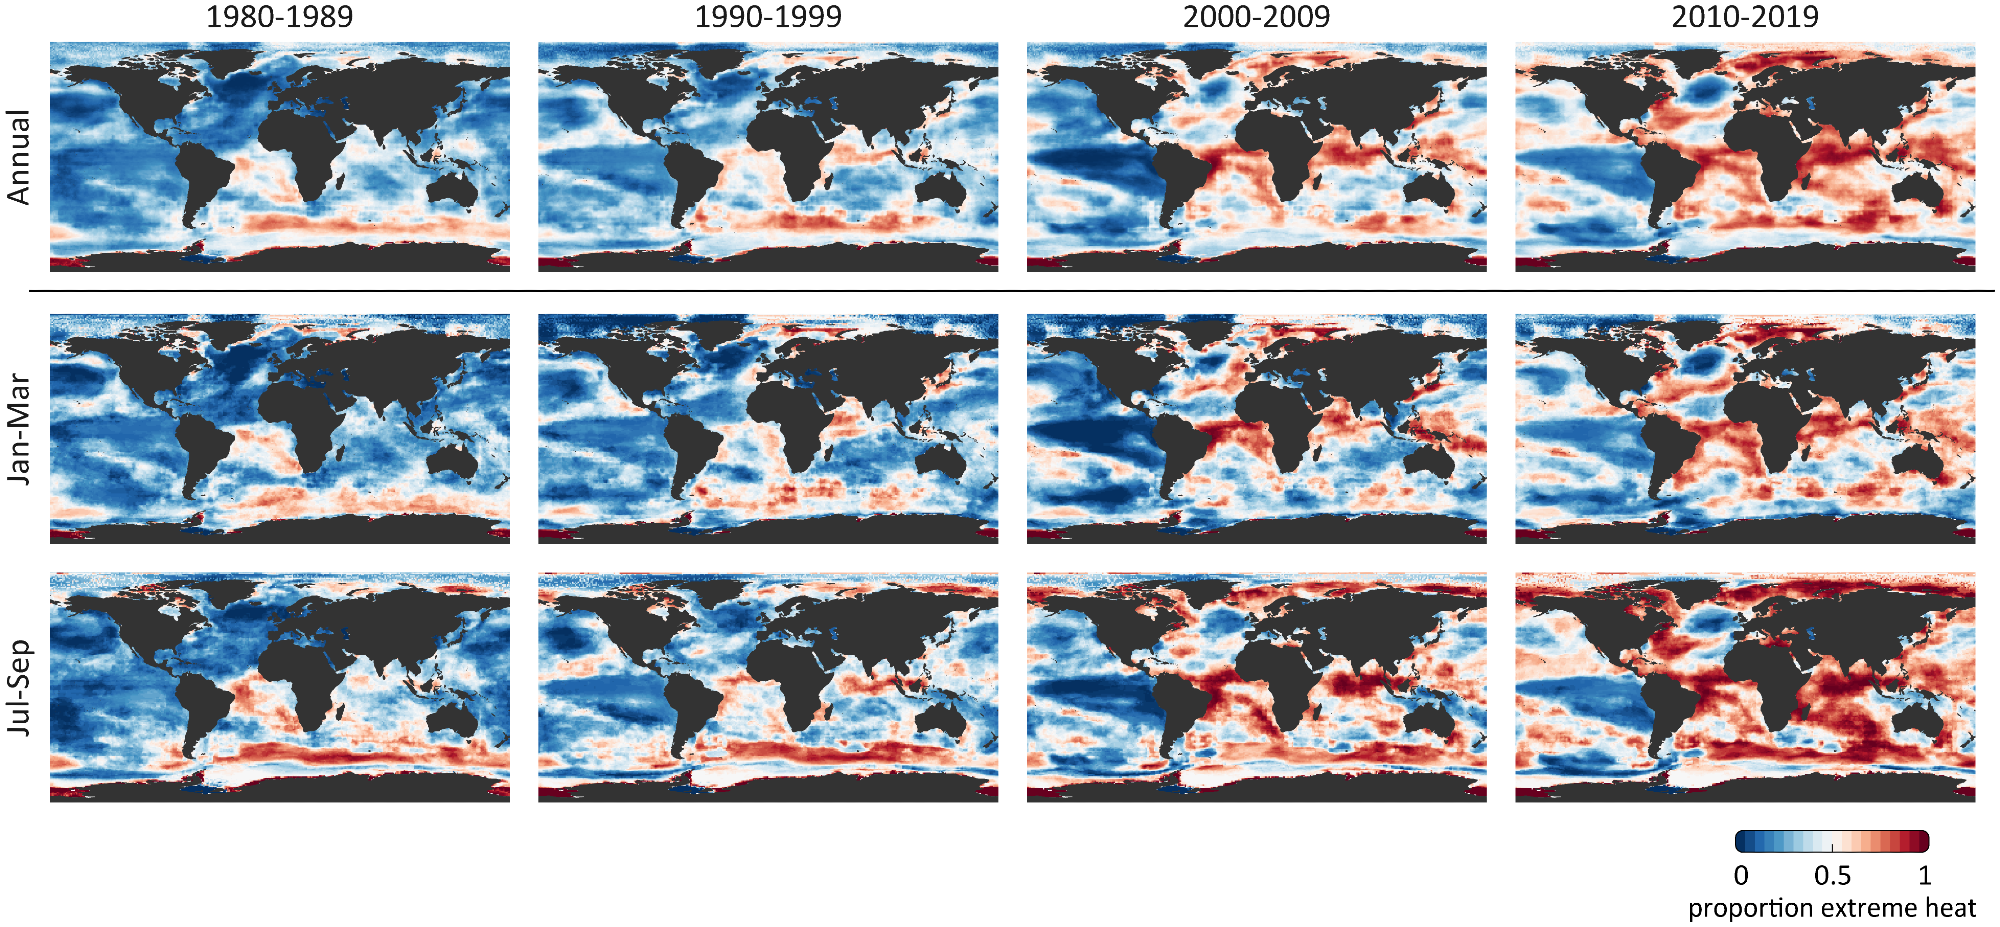
Figure 1. Decadal evolution of frequency of extreme marine heat from 1980–2019. Extreme heat defined as exceeding the localized (1° × 1°), monthly, 98th percentile of sea surface temperatures (SST) observed during 1870–1919, averaged from HadISSTv1.1 and COBESSTv2 products. Extreme heat, resolved for boreal winter (Jan-Mar) and summer (Jul-Sep), accumulates steadily over time beginning in the Southern, South Atlantic, and Indian basins. Regions of the mid North Atlantic and eastern South Pacific indicate a low occurrence. The base map layer was drawn using the “rworldmap” R package. Image Credit: Tanaka and Van Houtan, 2022
Figure 2. shows the EEZs, LMEs, and BGCPs where the present ocean climate stress is most intense are highlighted in the current LEHI summary from 2010–2019.
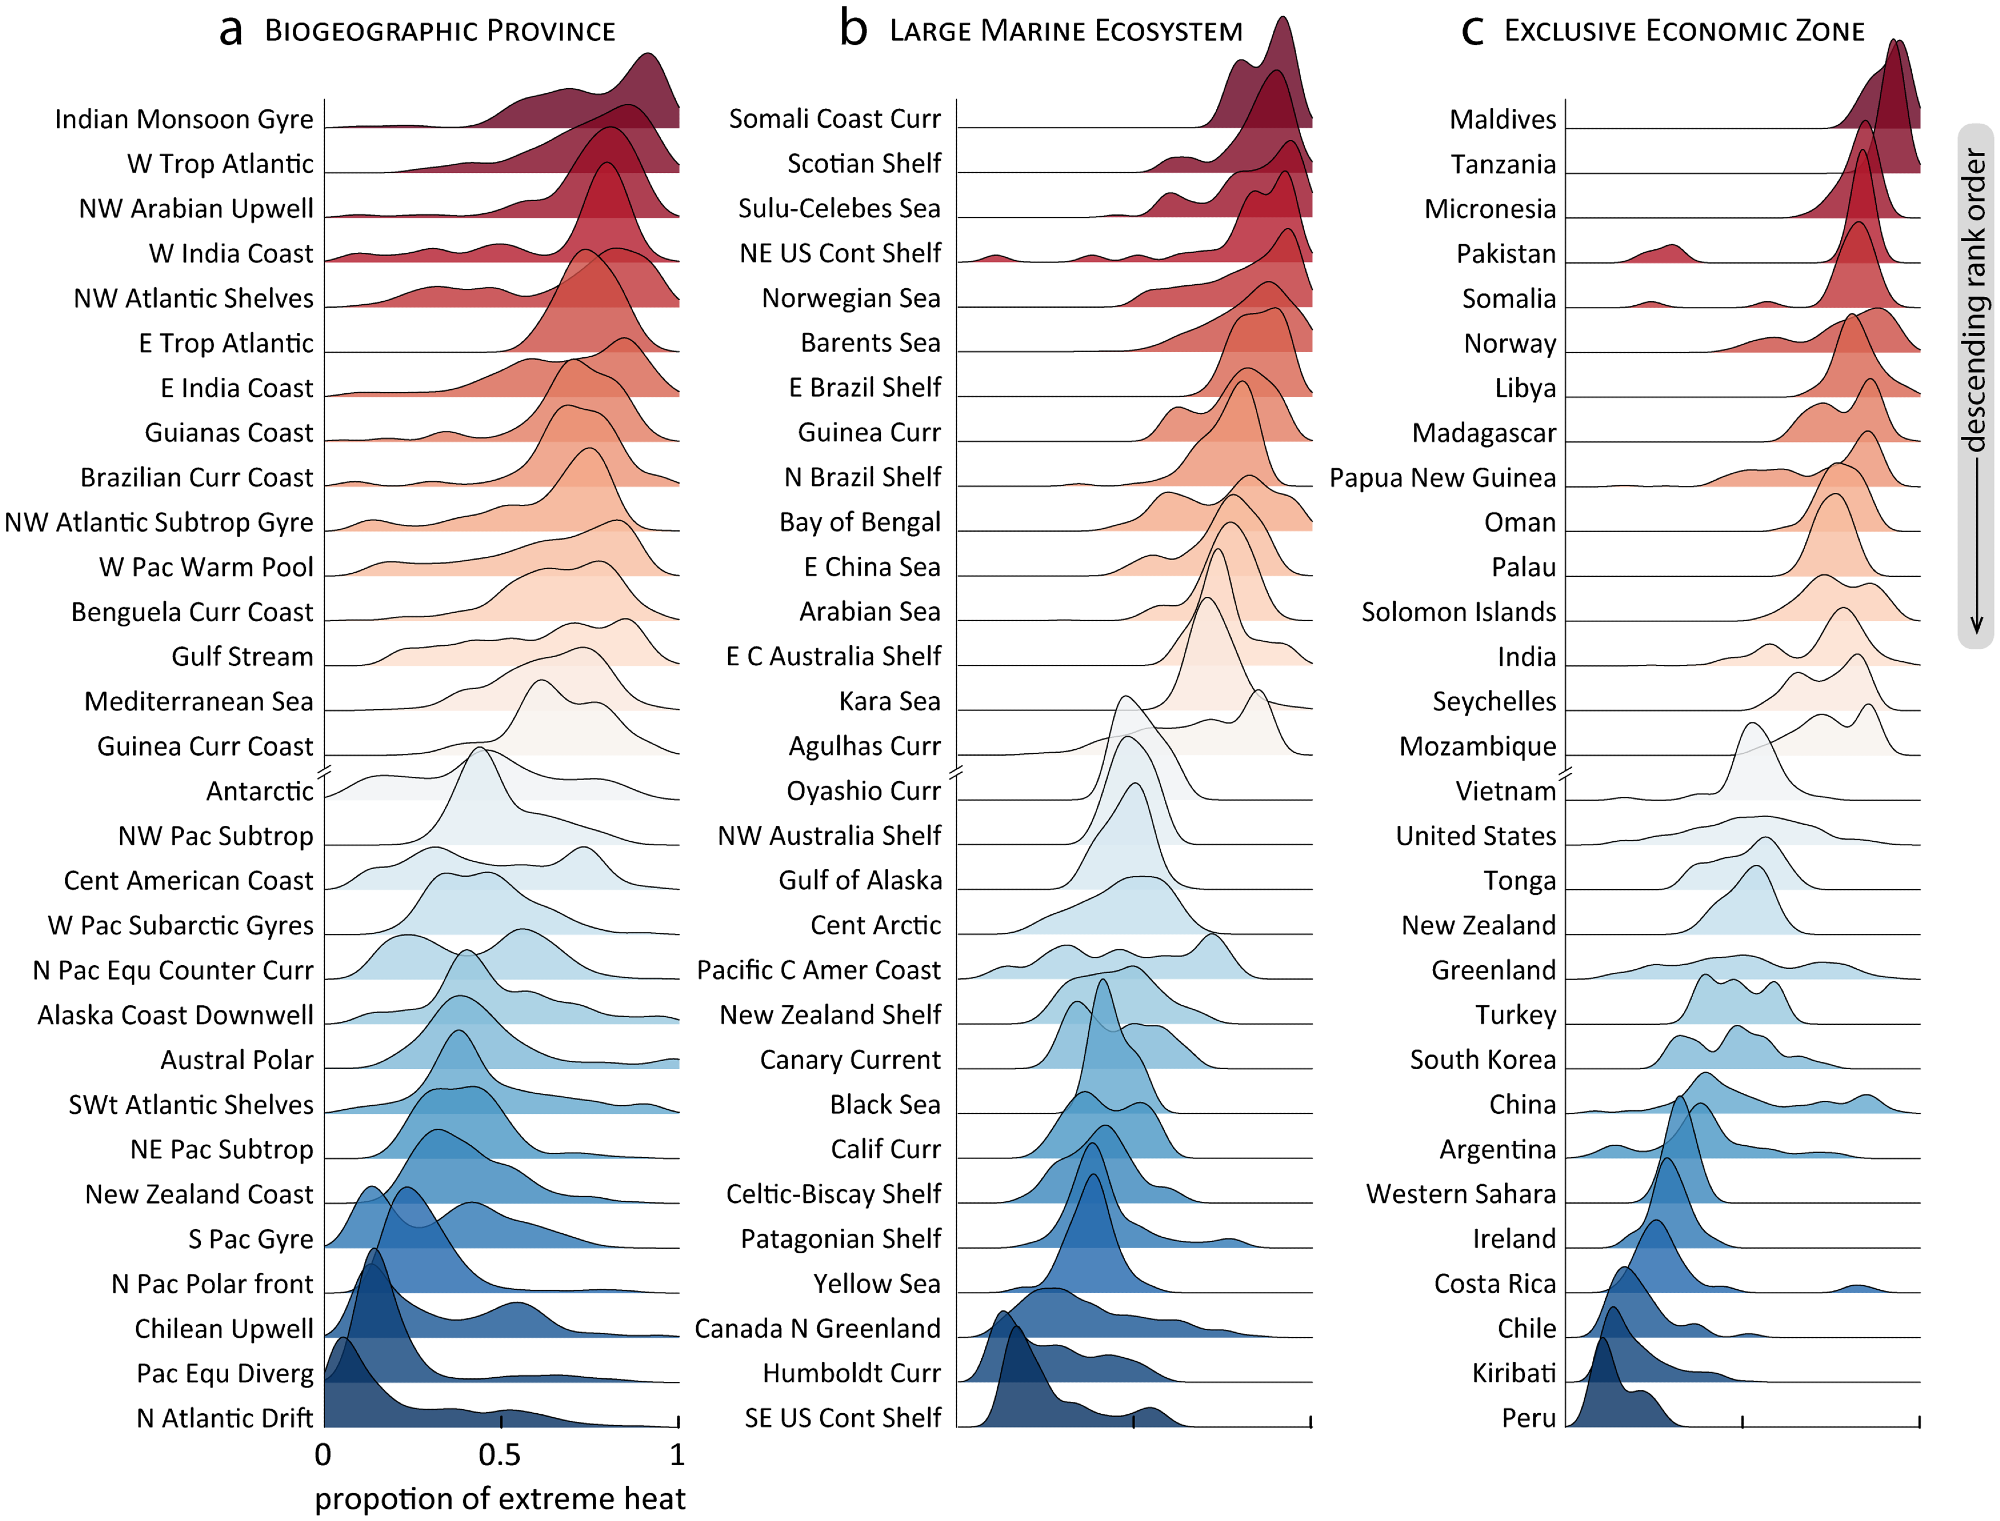
Figure 2. Regional variability of frequency of extreme marine heat during 2010–2019. Summaries for (a) biogeochemical provinces (b) Large marine ecosystems and (c) Exclusive economic zones, displaying the outer 15 regions (30 total) from larger sets of 55, 66, and 142 regions, respectively. Regions are ranked and sorted by median extreme value. Image Credit: Tanaka and Van Houtan, 2022
Figure 3 indicates a rise from <20% in the early 1900s to >50% in the 2010s in the proportion of global and regional ocean surfaces above the 1870–1919 extreme event threshold.
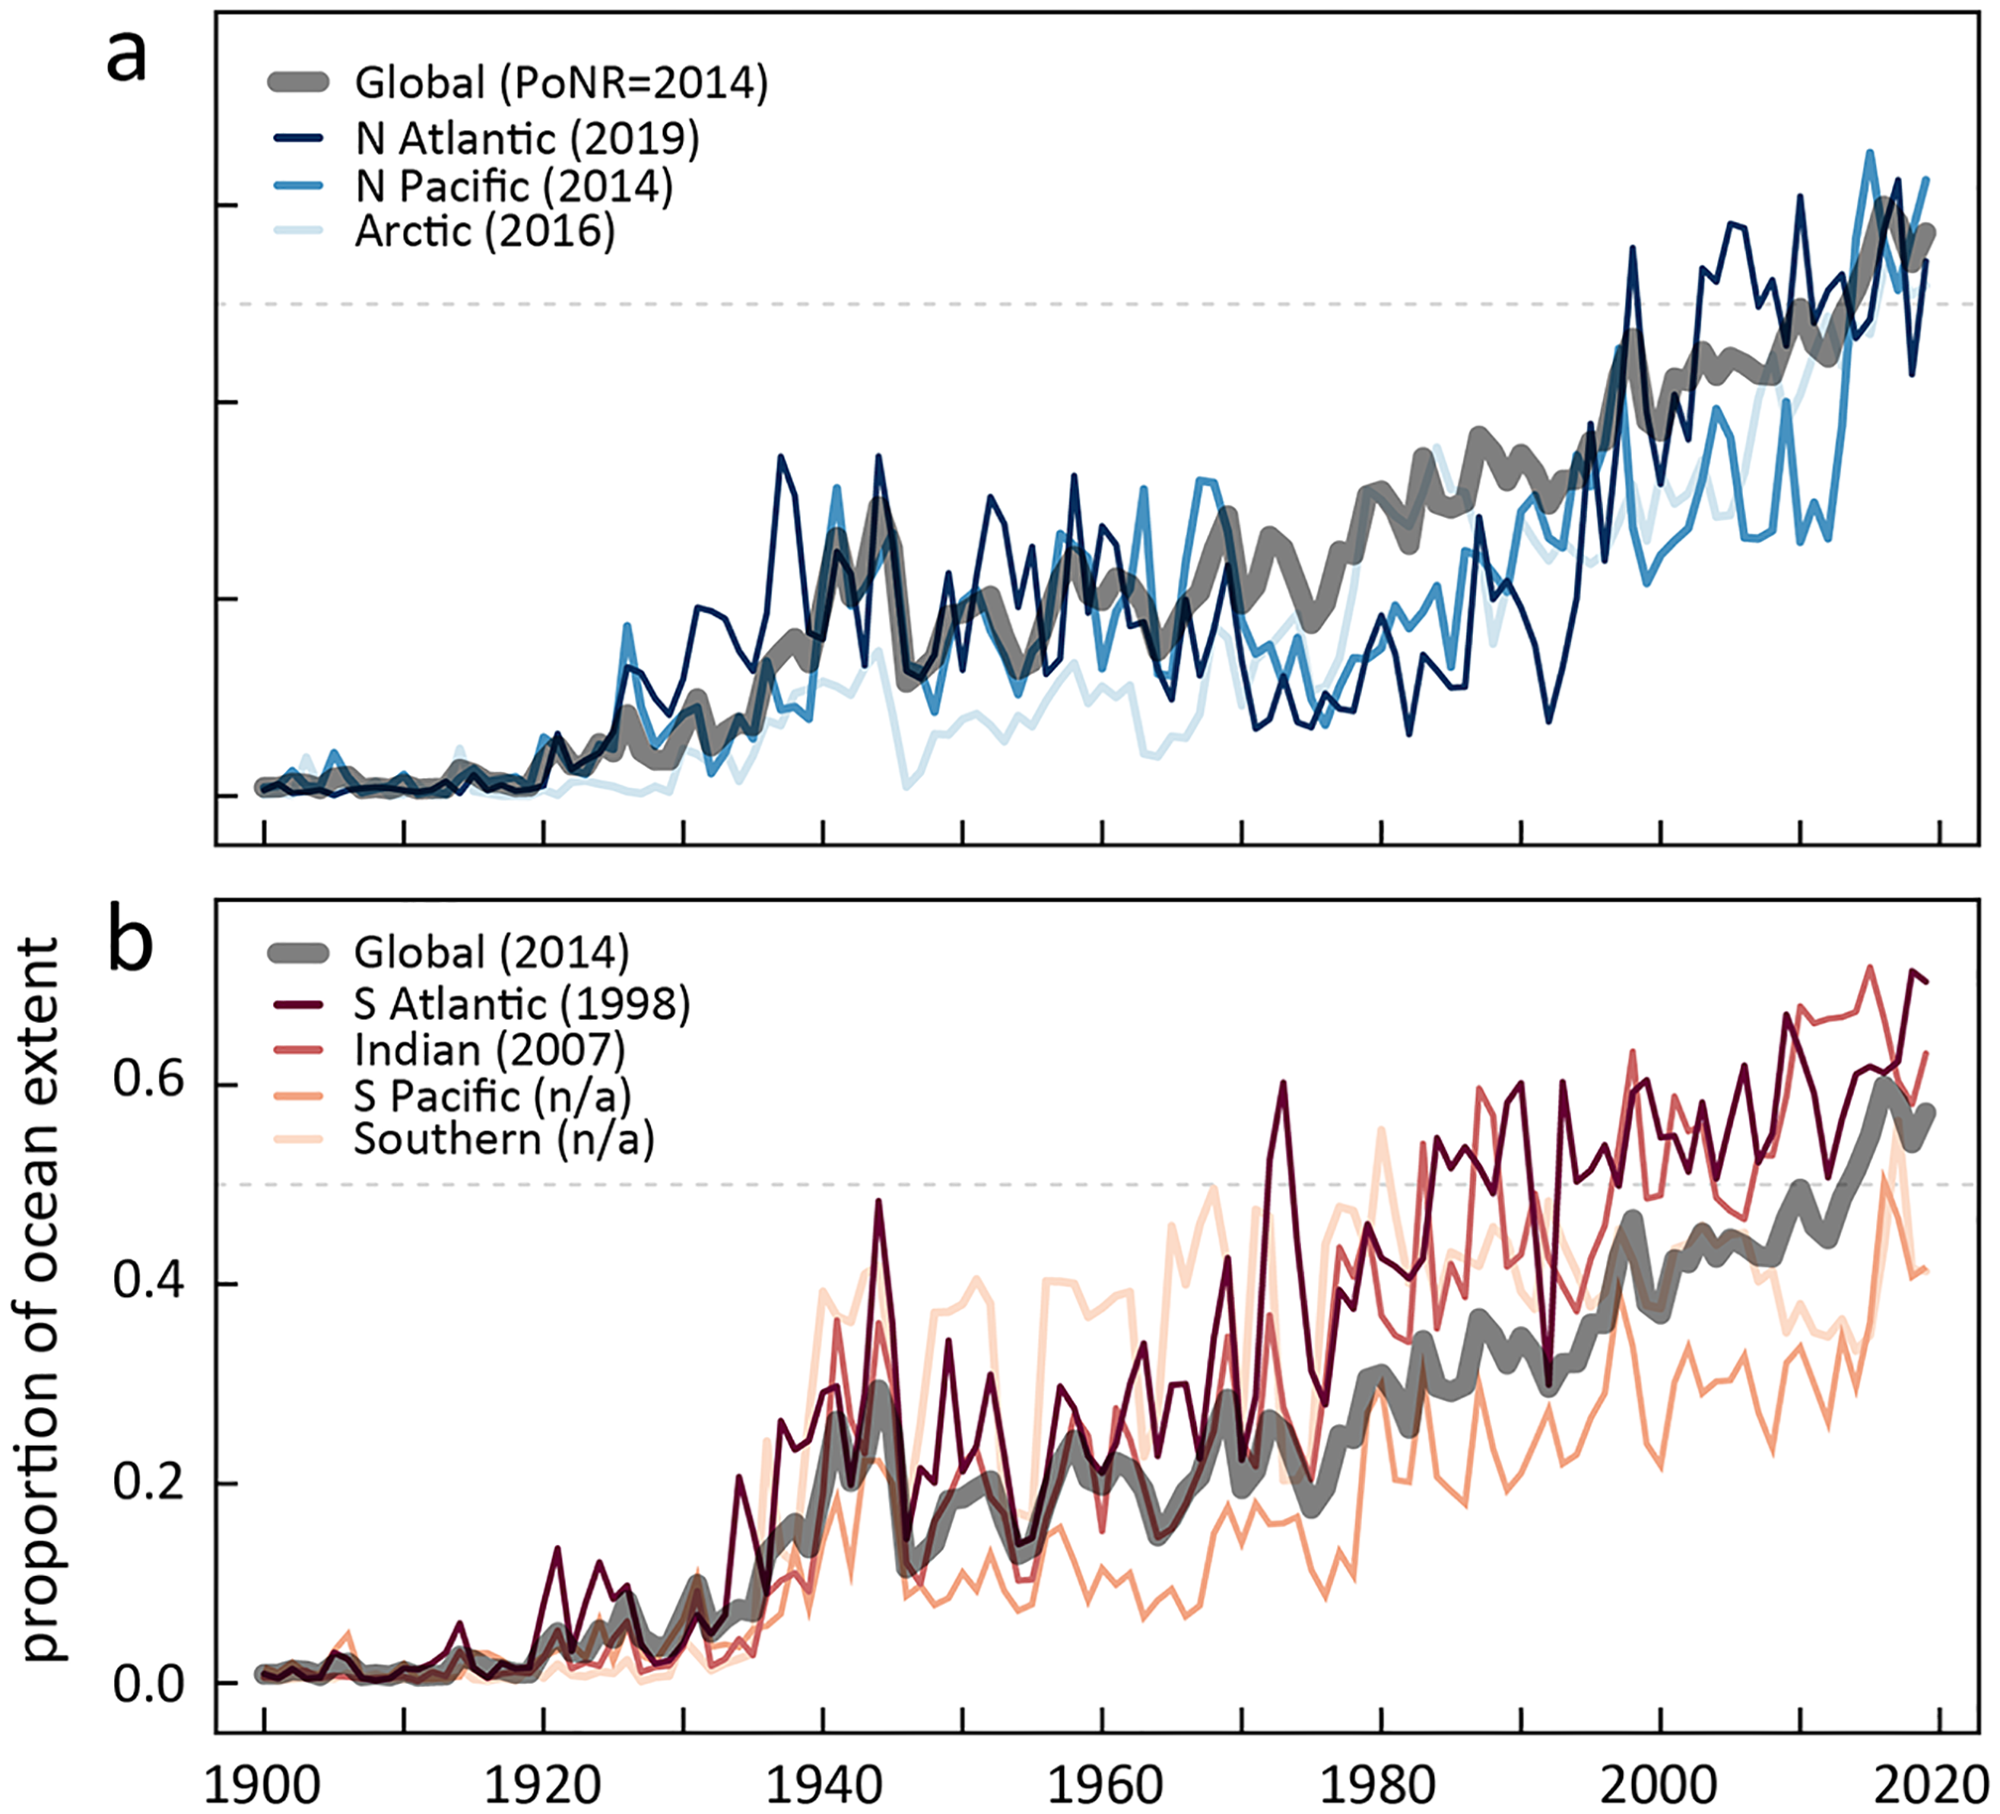
Figure 3. Synoptic frequency of extreme marine heat across ocean basins from 1900–2019. Fraction of the ocean surface annually experiencing extreme heat, grouped by (a) northern hemisphere and (b) southern hemisphere and Indian ocean basins. The Point of No Return (PoNR) occurs when each series surpasses and remains above 50% (dashed grey line), or when the historical baseline of extreme heat becomes “normal”. This first occurs in 1998 in the South Atlantic basin and for the global ocean occurs in 2014. Image Credit: Tanaka and Van Houtan, 2022
To give an additional climatic stress assessment at each moment in time, the geographical distribution of normalized LEHI may be compared to traditional climate indices calculated from IPCC-relevant data (1956–2005) in Figure 4.
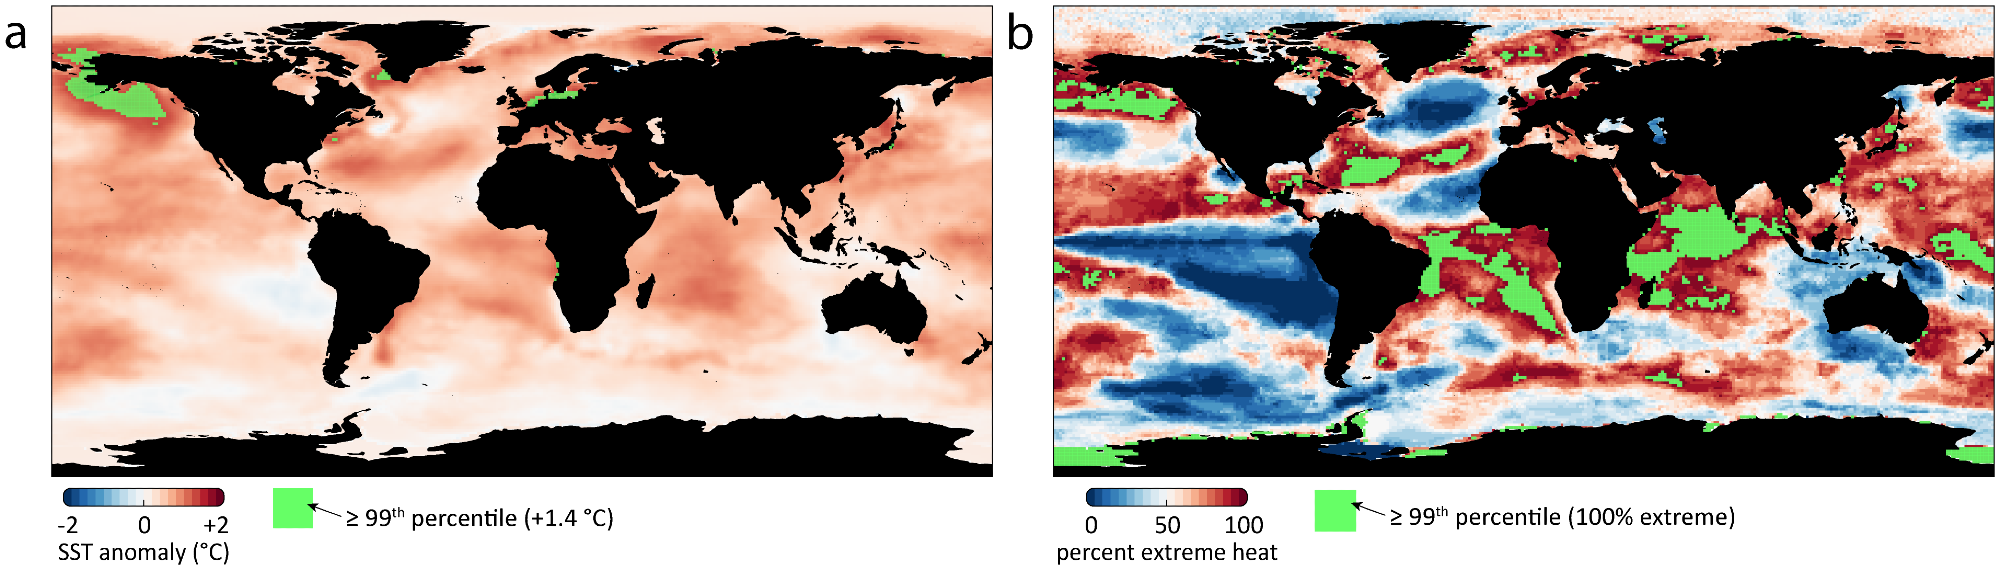
Figure 4. Comparing extreme marine heat metrics for the year 2019. (a) Mean anomaly and (b) percent extreme heat for the global ocean where both series have baselines determined from 1870–1919. Regions in the 99th percentile for each series (+1.4 °C and 100% extreme, respectively) are highlighted in green. This metric constitutes 7% of the global ocean in the extreme heat series, (b) but only 1% for the more traditional mean anomaly approach, (a). The base map layer was drawn using the “rworldmap” R package. Image Credit: Tanaka and Van Houtan, 2022
Discussion
The method was based on a statistical framework that is routinely used to study variations in the occurrence of univariate climatic severe events over time and region. These findings are in line with prior research that showed the development of climate signals, which were previously undetectable at regional sizes.
Reconstructed data are often more reliable, particularly at the time when global or near-global in situ data were accessible, therefore detecting climate change impacts within a historical context has significant advantages. Historical records can also give fresh insights and empirical evidence for understanding the significance of non-equilibrium dynamics and the cumulative effects of unique thermal disturbances that have previously occurred in many areas.
Extreme marine heat occurrences can be normalized in a historical ecological context to assess the altering baseline of ocean health and identify climate susceptible places. If this trend continues, or worse, if heat extremes continue to rise, many ecosystems will be pushed beyond their thermal tolerance, leading to irreversible alterations. Extensive coral bleaching, mass death events, and toxic algal blooms have all been reported as negative effects of high maritime heat events.
Simultaneously, extreme climatic event classification and evaluation have become crucial criteria for a wide variety of policy choices. This research provides a solid historical framework for describing excessive maritime heat to better understand climate change implications at different geographical and temporal scales. Our efforts to improve public awareness and trust in severe climatic occurrences and their attribution to manmade climate change will continue.
Using the methodologies used here, the study identified that extreme climate change is a historical event that has already occurred in the global ocean, rather than a hypothetical future potential. Even though certain parts experienced excessive heat earlier, 50% of the ocean’s surface suffered extreme heat in 2014, and this has gradually grown since then.
Journal Reference
Tanaka, K. R., & Van Houtan, K. S. (2022). The recent normalization of historical marine heat extremes. PLOS Climate, 1(2), p.e0000007. Available Online: https://journals.plos.org/climate/article?id=10.1371/journal.pclm.0000007.
References and Further Reading
- Arguez, A., et al. (2012) NOAA’s 1981–2010 U.S. Climate Normals: An Overview. Bulletin of the American Meteorological Society, 93(11), pp. 1687–97. doi.org/10.1175/BAMS-D-11-00197.1.
- IPCC. Climate Change 2013: The Physical Science Basis. In: Contribution of Working Group I to the Fifth Assessment Report of the Intergovernmental Panel on Climate Change. Cambridge, United Kingdom and New York, NY, USA: Cambridge University Press Cambridge; 2013.
- IPCC. IPCC Special Report on the Ocean and Cryosphere in a Changing Climate 2019.
- Katz, R W (2010) Statistics of extremes in climate change. Climatic Change, 100(1), pp. 71–76. doi.org/10.1007/s10584-010-9834-5.
- Hayashida, H., et al. (2020) Insights into projected changes in marine heatwaves from a high-resolution ocean circulation model. Nature Communications, 11(1) pp. 1–9. doi.org/10.1038/s41467-020-18241-x.
- Coumou, D & Rahmstorf S (2012) A decade of weather extremes. Nature Climate Change, 2(7), pp. 491–496. doi.org/10.1038/nclimate1452.
- Perkins, S. E., et al. (2012) Increasing frequency, intensity and duration of observed global heatwaves and warm spells. Geophysical Research Letters, 39(20). doi.org/10.1029/2012GL053361.
- Oliver, E. C., et al. (2019) Projected marine heatwaves in the 21st century and the potential for ecological impact. Frontiers in Marine Science, 6, p. 734. doi.org/10.3389/fmars.2019.00734.
- Frölicher, T. L., et al. (2018) Marine heatwaves under global warming. Nature, 560(7718), pp. 360–364. pmid:30111788. doi.org/10.1038/s41586-018-0383-9.
- Hobday, A. J., et al. (2016) A hierarchical approach to defining marine heatwaves. Progress in Oceanography, 141, pp. 227–38. doi.org/10.1016/j.pocean.2015.12.014.
- Oliver, E. C., et al. (2018) Longer and more frequent marine heatwaves over the past century. Nature Communications, 9(1), pp. 1–12. doi.org/10.1038/s41467-018-03732-9.
- Schlegel, R. W., et al. (2019) Detecting marine heatwaves with sub-optimal data. Frontiers in Marine Science, 6, p. 737. doi.org/10.3389/fmars.2019.00737.
- Chen, K., et al. (2014) Diagnosing the warming of the Northeastern U.S. Coastal Ocean in 2012: A linkage between the atmospheric jet stream variability and ocean response. Journal of Geophysical Research: Oceans, 119(1), pp. pp. 218–227. doi.org/10.1002/2013JC009393.
- Sparnocchia, S., et al. (2006) The anomalous warming of summer 2003 in the surface layer of the Central Ligurian Sea (Western Mediterranean). Annales Geophysicae, 24 (6), pp. 443-452. doi.org/10.5194/angeo-24-443-2006.
- Holbrook, N. J., et al. (2019) A global assessment of marine heatwaves and their drivers. Nature Communications, 10(1), pp. 1–13. doi.org/10.1038/s41467-019-10206-z.
- Wernberg, T., et al. (2013) An extreme climatic event alters marine ecosystem structure in a global biodiversity hotspot. Nature Climate Change, 3(1), pp. 78–82. doi.org/10.1038/nclimate1627.
- Mills, K. E., et al. (2013) Fisheries management in a changing climate: lessons from the 2012 ocean heat wave in the Northwest Atlantic. Oceanography, 26(2), pp. 191–195. Available at: https://www.jstor.org/stable/24862052.
- Oliver, E. C., et al. (2017) The unprecedented 2015/16 Tasman Sea marine heatwave. Nature Communications, 8(1), pp. 1–12. doi.org/10.1038/ncomms16101.
- Oliver, E. C., et al. (2018) Anthropogenic and natural influences on record 2016 marine heat waves. Bulletin of the American Meteorological Society, 99(1), pp. S44–S48. doi.org/10.1175/BAMS-D-17-0093.1.
- Jacox, M. G., et al. (2016) Forcing of multi-year extreme ocean temperatures that impacted California Current living marine resources in 2016. Bulletin of the American Meteorological Society, 99(1).
- Alexander, M. A., et al. (2018) Projected sea surface temperatures over the 21st century: Changes in the mean, variability and extremes for large marine ecosystem regions of Northern Oceans. Elementa: Science of the Anthropocene, 6(9). doi.org/10.1525/elementa.191.
- Christidis, N & Stott, P A (2014) Change in the odds of warm years and seasons due to anthropogenic influence on the climate. Journal of Climate, 27(7), pp. 2607–2621. doi.org/10.1175/JCLI-D-13-00563.1.
- Mora, C., et al. (2013) The projected timing of climate departure from recent variability. Nature, 502(7470), pp. 183–187.. doi.org/10.1038/nature12540.
- Oliver, E. C., et al. (2021) Marine heatwaves. Annual Review of Marine Science. 13, pp. 313–342. doi.org/10.1146/annurev-marine-032720-095144.
- Leiserowitz, A (2007) Communicating the risks of global warming: American risk perceptions, affective images, and interpretive communities. In: Creating a climate for change: Communicating climate change and facilitating social change. pp. 44–63. doi.org/10.1017/CBO9780511535871.005.
- Smale, D. A., et al. (2019) Marine heatwaves threaten global biodiversity and the provision of ecosystem services. Nature Climate Change, 9(4) pp. 306–312. doi.org/10.1038/s41558-019-0412-1.
- Sillmann, J., et al. (2013) Climate extremes indices in the CMIP5 multimodel ensemble: Part 1. Model evaluation in the present climate. Journal of Geophysical Research: Atmospheres, 118(4), pp. 1716–1733. doi.org/10.1002/jgrd.50188.
- Kharin, V. V., et al. (2013) Changes in temperature and precipitation extremes in the CMIP5 ensemble. Climatic Change, 119(2), pp. 345–357. doi.org/10.1175/JCLI4066.1.
- Schewe, J., et al. (2019) State-of-the-art global models underestimate impacts from climate extremes. Nature Communications, 10(1) pp. 1–14. doi.org/10.1038/s41467-019-08745-6.
- Frank, P, (2019) Propagation of Error and the Reliability of Global Air Temperature Projections. Frontiers in Earth Science, 7, p.223. doi.org/10.3389/feart.2019.00223.
- Schenck, L, (2008) Climate Change Crisis-Struggling for Worldwide Collective Action. Colorado Journal of International Environmental Law and Policy, 19, p. 319. Available at: https://heinonline.org/HOL/LandingPage?handle=hein.journals/colenvlp19&div=16&id=&page=.
- Van Houtan, K. S., et al. (2021) The geographic disparity of greenhouse emissions and projected climate change. Science Advances, 7(29) : pp. 1–9. doi.org/10.1126/sciadv.abe4342.
- Rayner, N., et al. (2003) Global analyses of sea surface temperature, sea ice, and night marine air temperature since the late nineteenth century. Journal of Geophysical Research: Atmospheres, 108(D14). doi.org/10.1029/2002JD002670.
- Hirahara, S, et al. (2014) Centennial-scale sea surface temperature analysis and its uncertainty. Journal of Climate, 27(1), pp. 57–75. doi.org/10.1175/JCLI-D-12-00837.1.
- Yasunaka, S & Hanawa, K (2011) Intercomparison of historical sea surface temperature datasets. International Journal of Climatology, 31(7), pp. 1056–1073. doi.org/10.1002/joc.2104.
- Tommasi, D., et al. (2017) Multi-annual climate predictions for fisheries: An assessment of skill of sea surface temperature forecasts for large marine ecosystems. Frontiers in Marine Science, 4, p. 201. doi.org/10.3389/fmars.2017.00201.
- Barriopedro, D., et al. (2011) The hot summer of 2010: redrawing the temperature record map of Europe. Science, 332 (6026), pp. 220–224.. doi.org/10.1126/science.1201224.
- Hu, K., et al. (2014) Interdecadal variations in ENSO influences on Northwest Pacific–East Asian early summertime climate simulated in CMIP5 models. Journal of Climate, 27(15), pp. 5982–5998. doi.org/10.1175/JCLI-D-13-00268.1.
- Kent, E. C., et al. (2019) Observing requirements for long-term climate records at the ocean surface. Frontiers in Marine Science, 6, p. 441. doi.org/10.3389/fmars.2019.00441.
- Belkin, I M (2009) Rapid warming of large marine ecosystems. Progress in Oceanography, 81(1–4), pp. 207–213. doi.org/10.1016/j.pocean.2009.04.011.
- (2019) Maritime Boundaries Geodatabase: Maritime Boundaries and Exclusive Economic Zones (200NM). Flanders Marine Institute.11. doi.org/10.14284/386.
- Reygondeau, G., et al. (2013) Dynamic biogeochemical provinces in the global ocean. Global Biogeochemical Cycles, 27(4), pp. 1046–1058. doi.org/10.1002/gbc.20089.
- R_Core_Team, (2019) R: A language and environment for statistical computing. Vienna, Austria.
- Hawkins, E., et al. (2020) Observed emergence of the climate change signal: from the familiar to the unknown. Geophysical Research Letters, 47(6), p. e2019GL086259. doi.org/10.1029/2019GL086259.
- Hansen, J., et al. (1988) Global climate changes as forecast by Goddard Institute for Space Studies threedimensional model. Journal of Geophysical Research: Atmospheres, 93(D8), pp. 9341–9364. doi.org/10.1029/JD093iD08p09341.
- Bulgin, C. E., et al. (2020) Tendencies, variability and persistence of sea surface temperature anomalies. Scientific Reports, 10 (1), pp. 1–13. doi.org/10.1038/s41598-020-64785-9.
- Mahlstein, I., et al. (2011) Early onset of significant local warming in low latitude countries. Environmental Research Letters, 6 (3), p. 034009. doi.org/10.1088/1748-9326/6/3/034009.
- Mahlstein, I., et al. (2012) Emerging local warming signals in observational data. Geophysical Research Letters, 39(21). doi.org/10.1029/2012GL053952.
- Lima, F P & Wethey, D S (2012) Three decades of high-resolution coastal sea surface temperatures reveal more than warming. Nature Communications, 3(1), pp. 1–13. doi.org/10.1038/ncomms1713.
- Stott, P. A., et al. (2016) Attribution of extreme weather and climaterelated events. Wiley Interdisciplinary Reviews: Climate Change, 7(1), pp. 23–41. pmid:26877771. Available at: https://wires.onlinelibrary.wiley.com/doi/pdf/10.1002/wcc.380.
- Haustein, K., et al. (2016) Real-time extreme weather event attribution with forecast seasonal SSTs. Environmental Research Letters, 11(6), p. 064006. doi.org/10.1088/1748-9326/11/6/064006.
- Hegerl, G. C, et al. (2019) Causes of climate change over the historical record. Environmental Research Letters, 14 (12), p. 123006. doi.org/10.1088/1748-9326/ab4557.
- McClanahan, T. R, et al. (2020) Large geographic variability in the resistance of corals to thermal stress. Global Ecology and Biogeography, 29(12), pp. 2229–2247. doi.org/10.1111/geb.13191.
- Hughes, T. P, et al. (2019) Ecological memory modifies the cumulative impact of recurrent climate extremes. Nature Climate Change, 9(1), pp. 40–43. doi.org/10.1038/s41558-018-0351-2.
- Hughes, T. P, et al. (2018) Global warming transforms coral reef assemblages. Nature, 556(7702), pp. 492–496. doi.org/10.1038/s41586-018-0041-2.
- Somero, G N (2005) Linking biogeography to physiology: evolutionary and acclimatory adjustments of thermal limits. Frontiers in Zoology, 2(1) p. 1. doi.org/10.1186/1742-9994-2-1.
- Walther, G. R., et al. (2002) Ecological responses to recent climate change. Nature, 416(6879), pp. 389–395. pmid:11919621. doi.org/10.1038/416389a.
- Chevin, L. M., et al. (2010) Adaptation, plasticity, and extinction in a changing environment: towards a predictive theory. PLoS Biology, 8(4), p. e1000357. doi.org/10.1371/journal.pbio.1000357.
- Oostra, V, et al. (2018) Strong phenotypic plasticity limits potential for evolutionary responses to climate change. Nature Communications, 9(1), pp. 1–11. doi.org/10.1038/s41467-018-03384-9.
- Lough, J, et al. (2017) Increasing thermal stress for tropical coral reefs: 1871–2017. Scientific Reports, 8(1), pp. 1–8. doi.org/10.1038/s41598-018-24530-9.
- Monllor-Hurtado, A, et al. (2017) Shift in tuna catches due to ocean warming. PloS One, 12(6), p. e0178196. . doi.org/10.1371/journal.pone.0178196
- Eakin, C. M, et al. (2019) The 2014–2017 global-scale coral bleaching event: insights and impacts. Coral Reefs, 38(4), pp. 539–545. doi.org/10.1007/s00338-019-01844-2
- Genin, A, et al. (2020) Rapid onsets of warming events trigger mass mortality of coral reef fish. Proceedings of the National Academy of Sciences of United States of America, 117(41). doi.org/10.1073/iti4120117
- Cavole, L M, et al. (2016) Biological impacts of the 2013–2015 warm-water anomaly in the Northeast Pacific: winners, losers, and the future. Oceanography, 29(2), pp. 273–285. Available at: https://www.jstor.org/stable/24862690
- Galli, G, et al. (2017) Marine heat waves hazard 3D maps and the risk for low motility organisms in a warming Mediterranean Sea. Frontiers in Marine Science, 4, p. 136. doi.org/10.3389/fmars.2017.00136.