Active pharmaceutical ingredients (APIs) are released into the natural environment during their use, disposal, and manufacture. There is proof that environmental exposure to APIs has harmful impacts on the ecosystems and humans’ health. To comprehend the possible impacts of these pharmaceutical exposures, it is crucial to know the concentrations that happen in riverine environments.

Image Credit: GoncharukMaks/Shutterstock.com
Although a substantial amount of data is available on the many APIs’ concentrations in surface waters, there are large gaps in knowledge of such exposures.
In this study, researchers show a complete universal study of pharmaceutical occurrence in the rivers of less than 50% of the countries in the world (n = 1,052 sites). They present an exclusive, first-class, and comparable dataset based on the concentrations of 61 APIs and chose compounds employed in medicine and daily consumables (such as caffeine and nicotine).
The targeted compounds were chosen depending on earlier prioritization exercises and anticipated to occur in the environment. They are also expected to be of possible environmental concern. Enabling a precise comparison of pharmaceutical exposure data on an international scale, the research team used one sensitive dataset and globally verified analytical and sampling methods employed in a research laboratory.
Results and Discussion
Samples of surface water were gathered in duplicate ones—from 1,052 sampling sites during campaigns of 137 sampling campaigns covering 104 countries all over the world (Figure 1) and examined 61 APIs, which led to 128,344 data points. A sampling campaign included the water samples’ collection from several sampling sites along a river or rivers flowing inside a town, city, or local area.
Based on these and the UBA database of pharmaceuticals present in the environment, 36 countries had never been monitored earlier for APIs (Figure 2).
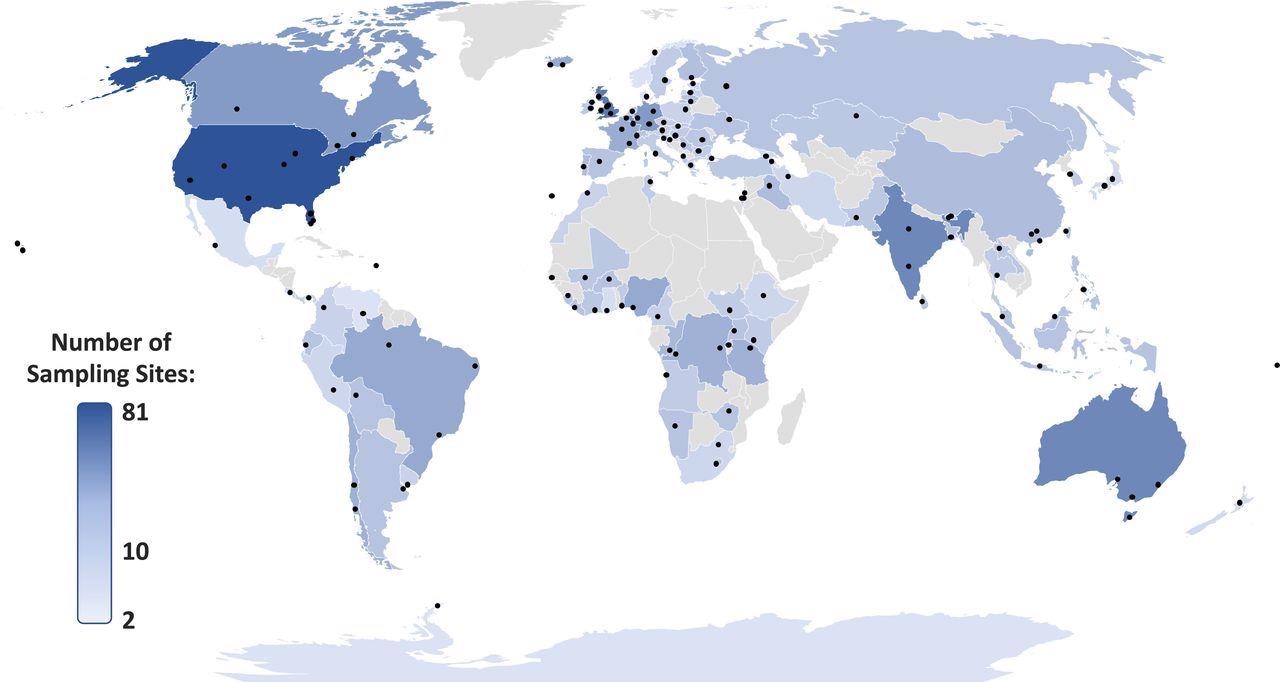
Figure 1. Locations of studied rivers/catchments (n = 137) for our global study. Points indicate groups of sampling sites across respective river catchments and countries are shaded based upon the total number of sampling sites. Image Credit: Wilkinson, et al., 2022
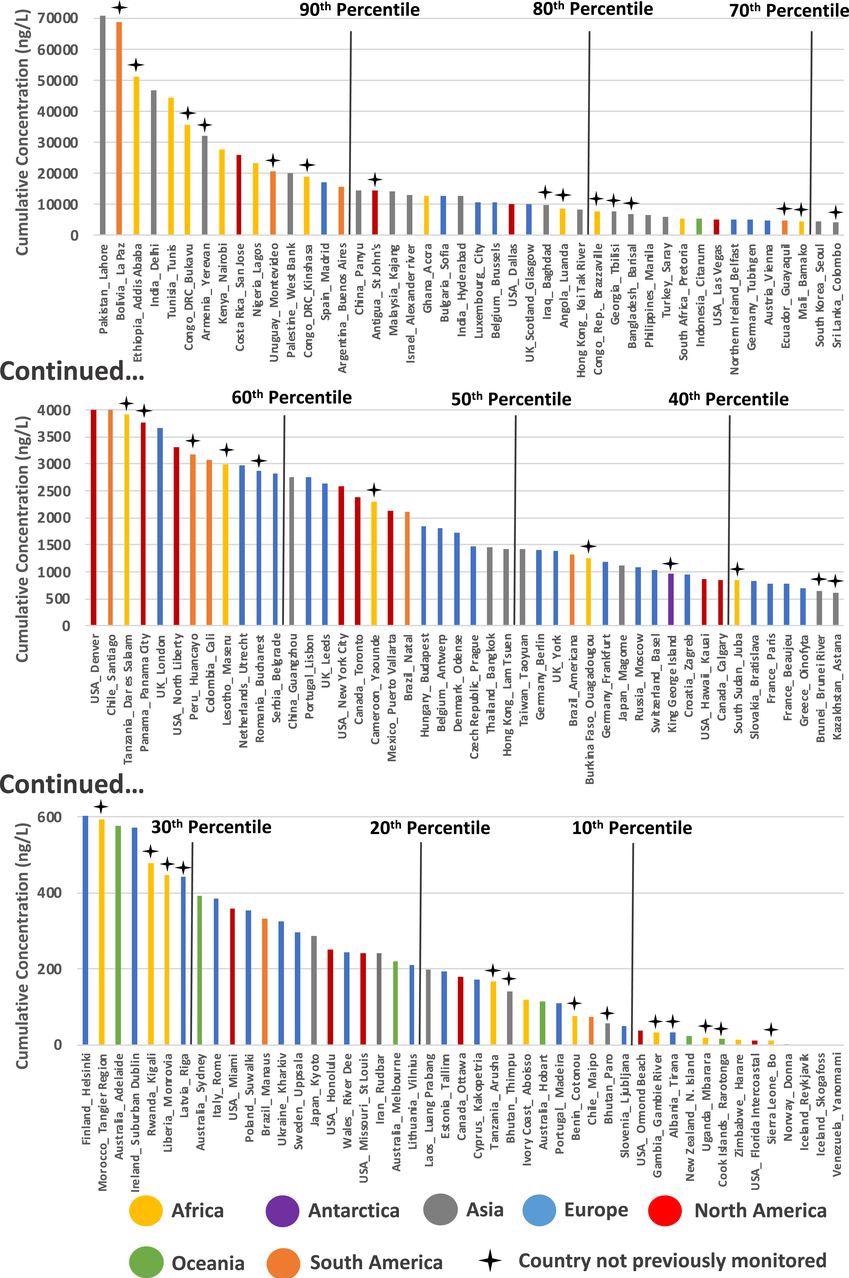
Figure 2. Cumulative API concentrations quantified across 137 studied river catchments organized by descending cumulative concentration (ng/L). Percentiles are marked by black lines and countries not previously monitored by crosses above the plot. The cumulative concentrations reported here are calculated as the average of the sum concentration of all quantifiable API residues at each sampling site within respective river catchments. Image Credit: Wilkinson, et al., 2022
For the detected APIs, total detection frequencies were from 0.1% for itraconazole (antifungal), fluoxetine (antidepressant), and ketotifen (antihistamine), to 62% for carbamazepine (Figure 3a) within respective river catchments. At more than 50% of all the sampling sites globally, caffeine and metformin were also detected.
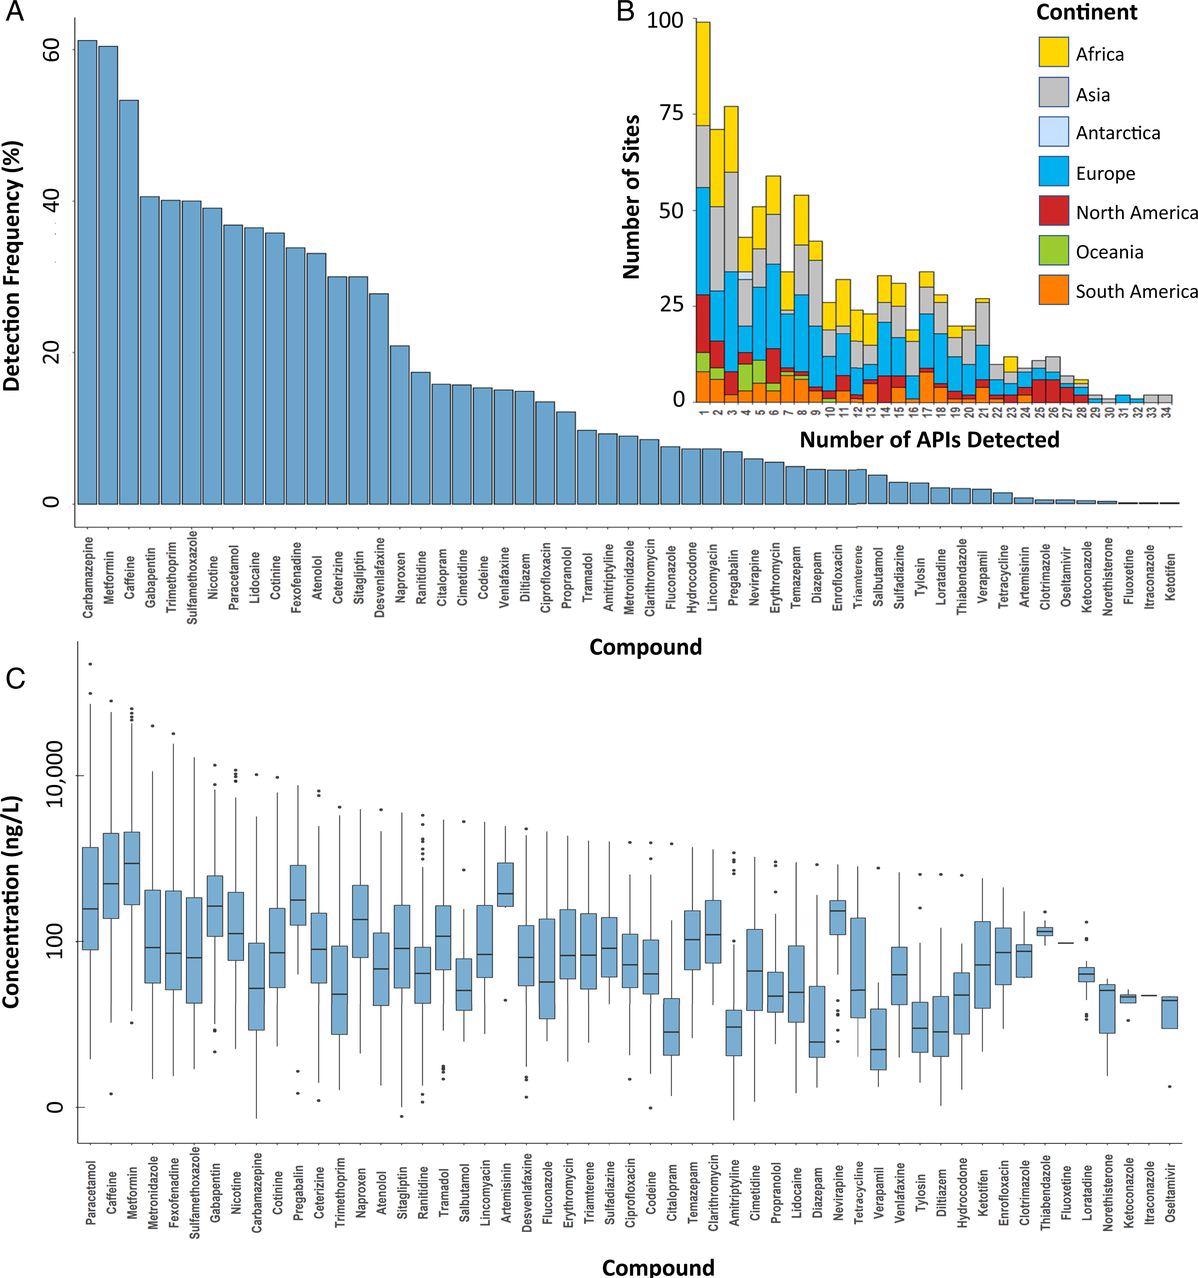
Figure 3. (a) Detection frequencies and (b) number of APIs detected at sampling sites in the global monitoring study, excluding sites without the detection of any API, and (c) box-and-whisker plots of concentrations (ng/L) of individual APIs, indicating the mean, minimum, maximum, and upper and lower quartile concentrations for each API globally. Image Credit: Wilkinson, et al., 2022
In this study, APIs’ concentrations were detected to be highest in lower-middle-income countries than that of countries with any other income-classification—as reported by the World Bank (Figure 4a).
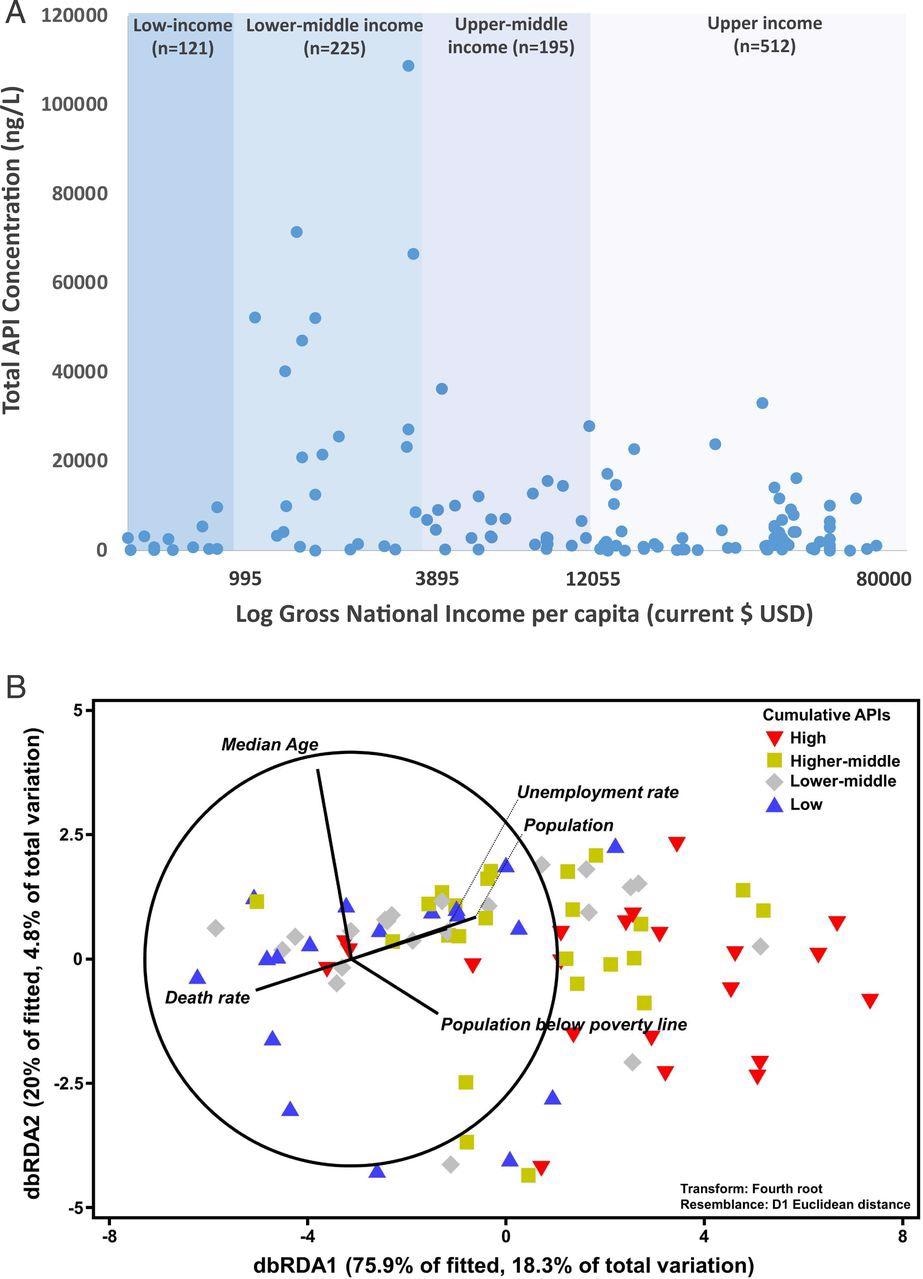
Figure 4. (a) Cumulative concentration of APIs observed across respective river catchments (signified by a blue dot, n = number of sampling sites) organized by World Bank GNI per capita and (b) distance-based redundancy analysis (dbRDA) illustrating the best model of socioeconomic indicators to explain the measured concentration of different classes of pharmaceuticals in respective countries according to the distance-based linear model (DISTLM, AICc = 325.26, r2 = 0.241). Vector projections with center coordination at (−3, 0) were performed with multiple partial correlation. Length and direction of the vectors represent the strength and direction of the relationship. Data from each country were classified according to their cumulative active pharmaceutical ingredient concentration: that is, Low: first quartile (the lowest 25%); Lower-middle: second quartile (the next 25%); Higher-middle: third quartile (the next 25%); and High: fourth quartile (the top 25%). Raw data can be found in Dataset S9. Image Credit: Wilkinson, et al., 2022
Statistical links, which were complementing this result, were found between API pollution and certain socioeconomic variables supporting national economies and health through distance-based linear modeling. At this point, pharmaceutical pollution was most positively linked with the population, local unemployment, median age, and poverty rates. On the other hand, it was negatively linked with the death rate of a country (Figure 4b).
Concentrations above the PNEC were found in 140 monitoring sites for sulfamethoxazole (Figure 5). The research data also clearly show that organisms present in riverine systems are exposed to complicated mixtures of APIs (Figure 3b). In the Kai Tak River in Hong Kong, the highest number of 34 APIs were identified at a single site. Therefore, due to the toxicological interactions of these mixtures, ecological risks can be a lot greater than anticipated for the single APIs.
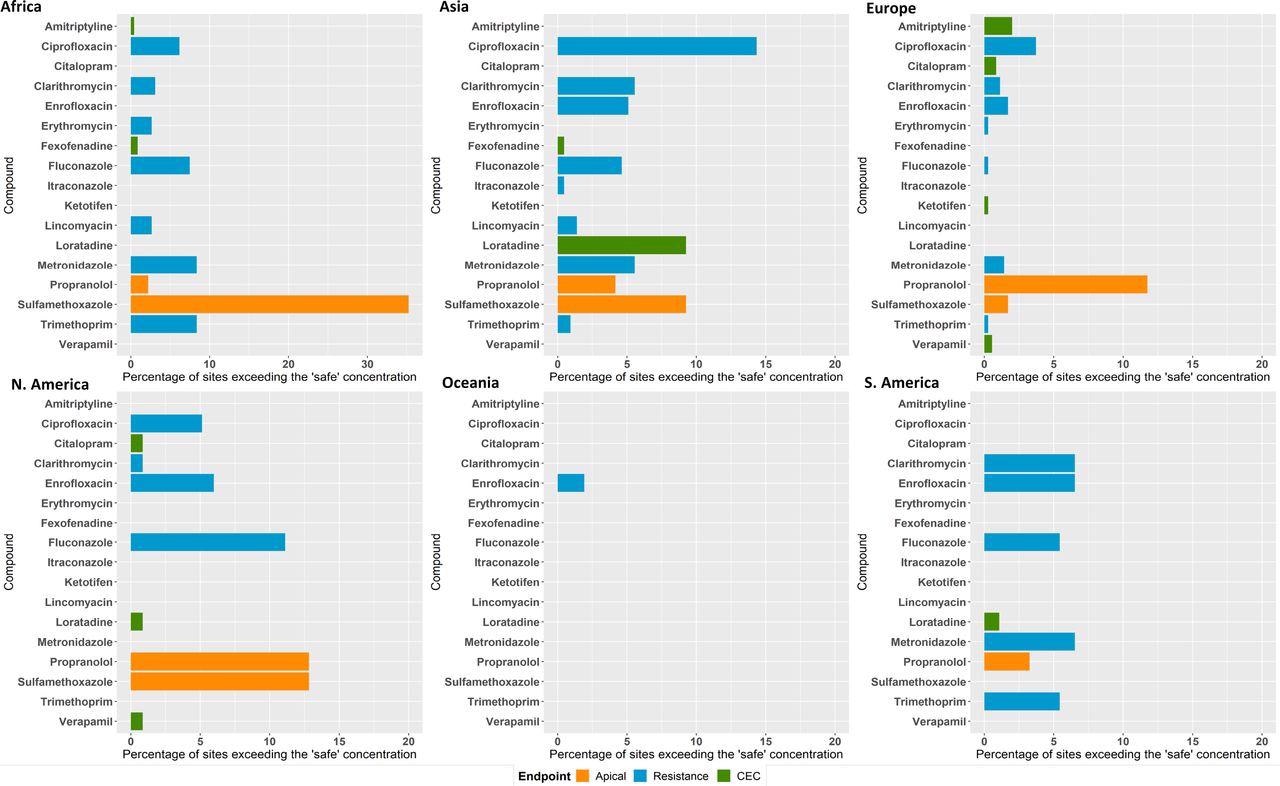
Figure 5. Percent of sites in the global monitoring study where concentrations exceeded: lowest PNECs derived from apical ecotoxicological endpoints for algae, fish, and daphnia (orange bars); CECs estimated based on human plasma therapeutic concentrations and uptake predictions for fish (green bars); and “safe” target concentrations for AMR selection (blue bars). Image Credit: Wilkinson, et al., 2022
Out of 13 detected antimicrobials, concentrations of nine (Figure 5) surpassed these safe concentrations for a minimum of one sampling site, with ciprofloxacin surpassing the safe limit at 64 sites.
The highest exceedance of the safe target was detected for metronidazole at a sampling location in Barisal, Bangladesh, where the greatest concentration of this antibiotic was over 300 times higher than the safe target. The presence of wastewater disposal near the river and in the close vicinity of pharmaceutical manufacturing activities was noted by the sampling team via on-the-ground observation.
Methodology
Similar water sampling kits were sent to project collaborators and were asked to develop a sampling campaign that comprised 5–10 sampling sites nearby rivers that were passing via a populated area (city, town, or village). Upon discussion with each project collaborator, a definition of prospective sources of pharmaceutical pollution impacting each river catchment was enabled.
By lowering the sampling bucket into the water with the use of the cord attached, water collection was achieved at each site. After a primary rinsing with the native water, an aliquot of water was then extracted into a syringe. Then, the syringe filter was attached and primed.
Photographs and environmental data were collected at each site. All collaborators were given videos and a step-by-step guide that detailed the needed sample collection protocol to make sure of consistency throughout all sampling campaigns.
After collection, samples were kept frozen until they are sent for analysis to a single analytical center in the United Kingdom employing a single analytical method through express air shipment. After the delivery at the University of York, samples were maintained at −20 °C until an analysis is over.
Analysis was carried out at the Centre of Excellence in Mass Spectrometry situated at the University of York (United Kingdom) using high-pressure liquid chromatography-tandem mass spectrometry (HPLC-MS/MS). Statistical analysis was performed using SPSS, Microsoft Excel, and Primer using PERMANOVA+ (v7.0.17, Primer-e).
Socioeconomic and population data were obtained from the open database of the World Bank. Threat quotients for a valuation of possible ecotoxicity risk were created by dividing the observed environmental concentrations by the least predicted no-effect concentration or critical environmental concentration that was derived for each API studied.
Conclusion
In this study, researchers demonstrated how the application of a minimal-design sampling protocol with quick and economical analytical approaches and a well-connected international community enables the investigation of API exposures and consequent risks in rivers on a global scale globally.
Although this study concentrated only on 61 priority APIs, the method could be used for other APIs and other classes of pollutants as well. The integration of non-targeted analytical methods can also enable the detection of unknown global pollutants.
As a grouping of 127 authors from 86 institutions across the globe, the research team demonstrated that pollution of the global rivers through medicinal chemicals is a global problem that poses threat to aquatic ecology and potential AMR selection. It may also pose threat to the accomplishment of the United Nations Sustainable Development Goal 6.3 by 2030.
As the world moves toward 2030, the new model in environmental monitoring needs to involve an inclusive, global, and interconnected effort. Only via global collaboration, it is possible to generate the monitoring data needed to make knowledgeable decisions on mitigation approaches essential to decrease the environmental effects of chemicals.
Journal Reference:
Wilkinson, J. L., et al. (2022) Pharmaceutical pollution of the world’s rivers. Proceedings of the National Academy of Sciences, 119(8), p. e2113947119. Available Online: https://www.pnas.org/content/119/8/e2113947119.
References and Further Reading
- Kidd, K. A., et al. (2007) Collapse of a fish population after exposure to a synthetic estrogen. Proceedings of the National Academy of Sciences of the United States of America, 104, pp. 8897–8901. doi.org/10.1073/pnas.0609568104.
- Wellington, E. M., et al. (2013) The role of the natural environment in the emergence of antibiotic resistance in gram-negative bacteria. Lancet Infectious Diseases, 13, pp. 155–165. doi.org/10.1016/S1473-3099(12)70317-1.
- Brodin T., et al. (2013) Dilute concentrations of a psychiatric drug alter behavior of fish from natural populations. Science, 339, pp. 814–815. doi.org/10.1126/science.1226850.
- Horký, P., et al. (2021) Methamphetamine pollution elicits addiction in wild fish. The Journal of Experimental Biology, 224, p. jeb242145. doi.org/10.1242/jeb.242145.
- Umwelt Bundesamt, (2021) Database- Pharmaceuticals in the environment Umwelt Bundesamt. https://www.umweltbundesamt.de/en/database-pharmaceuticals-in-the-environment-0.doi.org/10.1016/j.scitotenv.2020.144634.
- Boxall, A. B., et al. (2012) Pharmaceuticals and personal care products in the environment: What are the big questions? Environmental Health Perspectives, 120, pp. 1221–1229. doi.org/10.1289/ehp.1104477.
- aus der Beek, T., et al. (2016) Pharmaceuticals in the environment—Global occurrences and perspectives. Environmental Toxicology and Chemistry,35, pp. 823–835. doi.org/10.1002/etc.3339.
- Kolpin, D. W., et al. (2002) Pharmaceuticals, hormones, and other organic wastewater contaminants in U.S. streams, 1999-2000: A national reconnaissance. Environmental Science & Technology,36, pp. 1202–1211.doi.org/10.1021/es011055j.
- Hughes, S. R., et al. (2013) Global synthesis and critical evaluation of pharmaceutical data sets collected from river systems. Environmental Science & Technology, 47, pp. 661–677. doi.org/10.1021/es3030148.
- Kookana, R. S., et al. (2014) Potential ecological footprints of active pharmaceutical ingredients: An examination of risk factors in low-, middle- and high-income countries. Philosophical Transactions of the Royal Society B: Biological Sciences, 369, p. 20130586. doi.org/10.1098/rstb.2013.0586.
- Furlong, E. T., et al. (2014) Determination of human-use pharmaceuticals in filtered water by direct aqueous injection–High-performance liquid chromatography/tandem mass spectrometry in Laboratory Analysis, US Geological Survey, Ed. (Techniques and Methods, US Geological Survey, Department of the Interior), Chapter 10, Book 5. dx.doi.org/10.3133/tm5B10.
- Burns, E. E., et al. (2017) Boxall, Are exposure predictions, used for the prioritization of pharmaceuticals in the environment, fit for purpose? Environmental Toxicology and Chemistry, 36, pp. 2823–2832. doi.org/10.1002/etc.3842.
- Wilkinson, J. L., et al. (2019) A novel method to characterise levels of pharmaceutical pollution in large-scale aquatic monitoring campaigns. Applied Sciences (Basel), 9, p. 1368. doi.org/10.3390/app9071368.
- Nickolai, D. J., et al. (1985) Effects of storage temperature and pH on the stability of eleven beta-lactam antibiotics in MIC trays. Journal of Clinical Microbiology, 21, pp. 366–370.
- Huang, Q., et al. (2010) Determination of commonly used azole antifungals in various waters and sewage sludge using ultra-high performance liquid chromatography-tandem mass spectrometry. Journal of Chromatography A, 1217, pp. 3481–3488. doi.org/10.1016/j.chroma.2010.03.022.
- Gornik T., et al. (2020) Biotransformation study of antidepressant sertraline and its removal during biological wastewater treatment. Water Research,181, p. 115864. doi.org/10.1016/j.watres.2020.115864.
- Mendis, S., et al. (2007) The availability and affordability of selected essential medicines for chronic diseases in six low- and middle-income countries. Bulletin of the World Health Organization, 85, pp. 279–288. doi.org/10.2471/BLT.06.033647.
- Bin Nafisah, S., et al. (2017) Over-the-counter antibiotics in Saudi Arabia, an urgent call for policy makers. Journal of Infection and Public Health, 10, pp. 522–526. doi.org/10.1016/j.jiph.2016.09.016.
- Babar, Z. U. D., et al. (2019) The availability, pricing and affordability of essential diabetes medicines in 17 low-, middle-and high-income countries. Frontiers in Pharmacology, 10, p. 1375. doi.org/10.3389/fphar.2019.01375.
- Ekwochi, U., et al. (2013) Use and/or misuse of antibiotics in management of diarrhea among children in Enugu, Southeast Nigeria. Journal of Tropical Pediatrics, 59, pp. 314–316. doi.org/10.1093/tropej/fmt016.
- Mukonzo, J. K., et al. (2013) Over-the-counter suboptimal dispensing of antibiotics in Uganda. Journal of Multidisciplinary Healthcare,6, pp. 303–310. doi.org/10.2147/JMDH.S49075.
- Gebretekle, G B &Serbessa M K (2016) Exploration of over the counter sales of antibiotics in community pharmacies of Addis Ababa, Ethiopia: Pharmacy professionals’ perspective. Antimicrob. Resistance and Infection Control, 5, p. 2. doi.org/10.1186/s13756-016-0101-z.
- Rodrigues, C F (2020) Self-medication with antibiotics in Maputo, Mozambique: Practices, rationales and relationships. Palgrave Communications, 6, pp. 1–12. doi.org/10.1057/s41599-019-0385-8.
- Limbu, S. M(2020) Antibiotics use in African aquaculture: Their potential risks on fish and human health in Current Microbiological Research in Africa, A. L. K. Abia, G. R. Lanza, Eds. (Springer Cham) pp. 203–221.
- Van, T. T. H., et al, (2020) Antibiotic use in food animals worldwide, with a focus on Africa: Pluses and minuses. Journal of Global Antimicrobial Resistance, 20, pp. 170–177.
- Choi, P. M., et al. (2020) Population socioeconomics predicted using wastewater. Environmental Science & Technology Letters,7, pp. 567–572. doi.org/10.1021/acs.estlett.0c00392.
- UNESCO, (2020) United Nations World Water Development Report 2020: Water and Climate Change: WWDR 2020 (UNESCO Publishing, Paris).
- Ewen, M., et al. (2017) Baseline assessment of WHO’s target for both availability and affordability of essential medicines to treat non-communicable diseases. PLoS One, 12, p. e0171284. doi.org/10.1371/journal.pone.0171284.
- Auta, A., et al. (2019) Global access to antibiotics without prescription in community pharmacies: A systematic review and meta-analysis. Journal of Infection,78, pp. 8–18.doi.org/10.1016/j.jinf.2018.07.001.
- Persaud, N., et al. (2019) Comparison of essential medicines lists in 137 countries. Bulletin of the World Health Organization, 97, pp. 394–404C. doi.org/10.2471/BLT.18.222448.
- Access to Medicines Foundation, (2021) Access to medicines index, Access to Medicines Foundation. https://accesstomedicinefoundation.org/. Accessed 8 March 2021. doi.org/10.7189/jogh.11.03062.
- Cossio, C., et al. (2020) Indicators for sustainability assessment of small-scale wastewater treatment plants in low and lower-middle income countries. Environmental and Sustainability Indicators, 6, p. 100028.doi.org/10.1016/j.indic.2020.100028.
- World Bank, (2021) DataBank: World development indicators, World Bank Group. https://databank.worldbank.org/home. Accessed 9 May 2021.doi.org/10.1086/713540.
- European Medicines Agency, Guideline on the environmental risk assessment of medicinal products for human use, Committee for Medicinal Products for Human Use (CHMP), London (2006). Available at: https://www.ema.europa.eu/en/documents/scientific-guideline/guideline-environmental-risk-assessment-medicinal-products-human-use-first-version_en.pdf. Accessed 15 June 2018.
- Gunnarsson, L., et al. (2019) Pharmacology beyond the patient—The environmental risks of human drugs. Environment International, 129, pp. 320–332. doi.org/10.1016/j.envint.2019.04.075.
- Vestel, J., et al. (2016) Use of acute and chronic ecotoxicity data in environmental risk assessment of pharmaceuticals. Environmental Toxicology and Chemistry, 35, pp. 1201–1212. doi.org/10.1002/etc.3260.
- Fick, J., et al, (2010) Predicted critical environmental concentrations for 500 pharmaceuticals. Regulatory Toxicology and Pharmacology. 58, pp. 516–523. doi.org/10.1016/j.yrtph.2010.08.025.
- Backhaus, T., et al. (2014) Medicines, shaken and stirred: A critical review on the ecotoxicology of pharmaceutical mixtures. Philosophical Transactions of the Royal Society of London. Series B, Biological Sciences. 369, p. 20130585. doi.org/10.1098/rstb.2013.0585.
- Tell, J., et al. (2019) Science‐based targets for antibiotics in receiving waters from pharmaceutical manufacturing operations. Integrated Environmental Assessment and Management, 15, pp. 312–319. doi.org/10.1002/ieam.4141.
- Bengtsson-Palme, J & Larsson D G J (2016) Concentrations of antibiotics predicted to select for resistant bacteria: Proposed limits for environmental regulation. Environment International, 86, pp. 140–149. doi.org/10.1016/j.envint.2015.10.015.
- United Nations, Transforming our world: The 2030 agenda for sustainable development (2015). https://www.un.org/. Accessed 10 May 2021.