Human progress is driven by a variety of causes, including human decision-making. The Intergovernmental Panel on Climate Change (IPCC) utilizes carbon dioxide (CO2) emission scenarios to envisage and assess “a range of probable futures”.
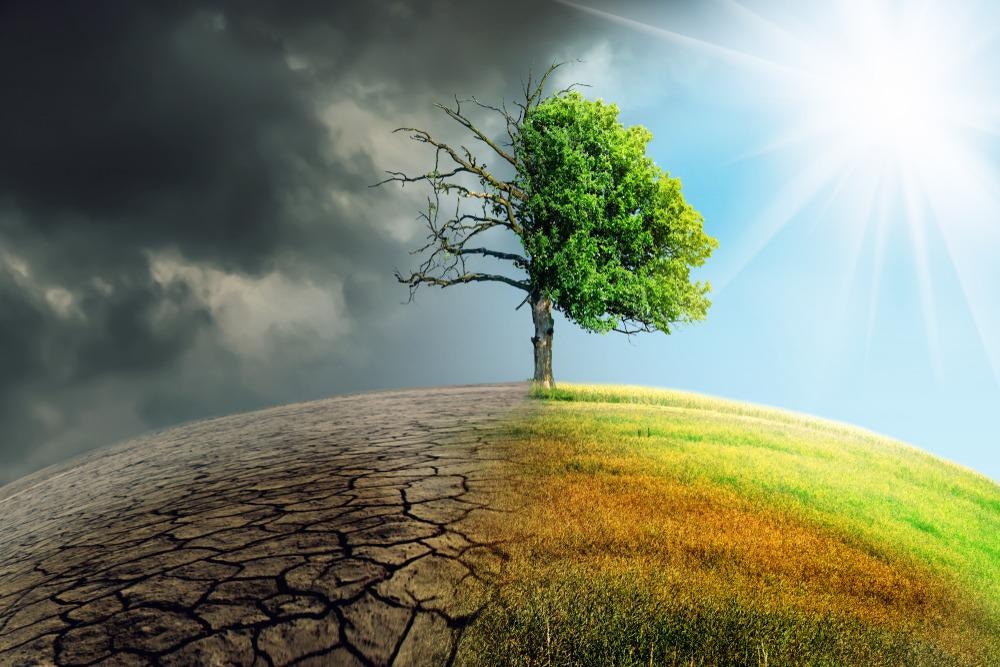
Image Credit: Sepp photography/Shutterstock.com
The “Representative Concentration Pathways” (RCPs) and the “Shared Socioeconomic Pathways” (SSPs) are two scenarios used in the IPCC 5th Assessment Reports (AR5) and 6th Assessment Reports (AR6).
By 2100, the RCP/SSP range’s high-emissions end is compatible with 8.5 W m-2 radiative forcing and 4–5 °C warming compared to pre-industrial levels. By 2100, emissions are expected to be compatible with 1.9 W m-2 radiative forcing and 1.5 °C of warming or somewhat less.
The IPCC’s recent acknowledgment of scenario probability is part of a larger and fast-moving issue on scenario plausibility and its implications for research and policy.
The “plausibility” of scenarios has been discussed for years, but the IPCC has yet to assess the plausibility of scenarios that are essential to most climate research and assessment. A “plausible” scenario, according to our study, is one in which the scenario’s future fossil fuel and industrial (FFI) CO2 emission growth rates are consistent with observations and IEA Stated Policies Scenario (STEPS) near-term estimates.
This topic is furthered here by selecting the AR5 and AR6 scenarios that are most consistent with current data and near-term estimates of FFI carbon dioxide emissions. As a result, the article fills a critical vacuum in climate research with far-reaching consequences for both research and policy.
Studies of future climate consequences often use a small set of scenarios as baselines against which more or less strict 21st-century mitigation actions may be compared. It is also critical to regularly analyze scenarios for plausibility to guarantee the rigor of climate research aiming to predict credible futures.
That study found a set of possibilities that were deemed unlikely because they contradicted recent experience and IEA estimates for the near future. Humans extend and update the research by comparing growth rates in fossil fuel and industrial (FFI) CO2 emissions across IPCC and SSP baseline and policy scenarios to find situations that predict growth rates in FFI CO2 emissions consistent with recent history and IEA forecasts to 2050.
Scientists call such circumstances credible. The researchers examined what this selection of viable scenarios forecasts for future FFI CO2 emissions and related global average temperature change to 2100 after picking a subset of feasible scenarios from the full collection of accessible scenarios.
Methods
Researchers compare the anticipated FFI CO2 emissions growth rates of the 1184 AR5 scenarios and 127 SSP scenarios to observations for 2005–2020, as well as 2021–2050 estimates from the IEA’s 2021 World Energy Outlook (WEO).
The IEA STEPS model predicts that committed climate and energy policies would be implemented to varying degrees, but that no new policies will be implemented, similar to traditional “business as usual” (BAU) baselines. Previous IEA WEOs featured a second, slightly gloomier, BAU-like Current Policies Scenario (CPS) that assumed no new policies would be adopted beyond those currently in place.
The study compares the errors and divergences of AR5 and SSP scenarios, IEA STEPS, and IEA APS for each of the Kaya Identity factors: GDP per capita, population, carbon intensity (CO2 emissions/primary energy), and energy intensity (primary energy/GDP) to investigate the drivers of FFI CO2 emission divergences.
Result
Figure 1 depicts FFI emissions in 2005–2050 scenarios that fulfill the ±0.1%/y and ±0.3%/y divergence standards.
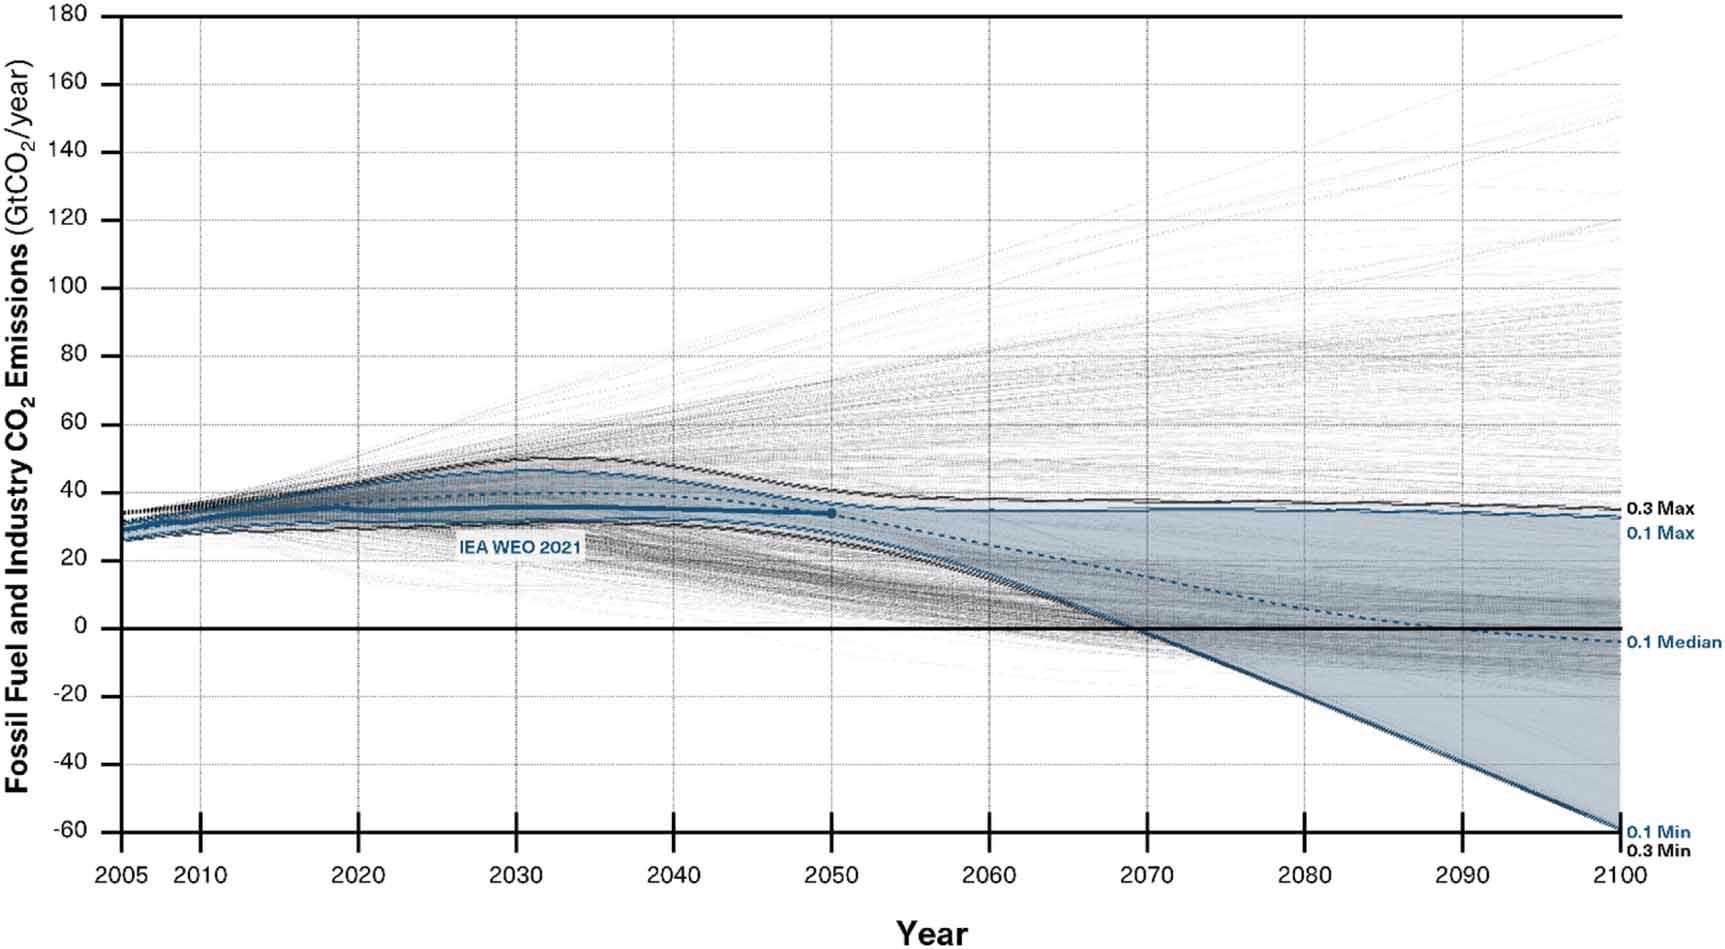
Figure 1. The trajectories of all fossil-fuel-and-industry (FFI) CO2 emissions to 2100 among 1184 AR5 and 127 SSP scenarios, along with the IEA STEPS to 2050. Shaded regions indicate envelopes of scenarios meeting ±0.1%/y (blue) and ±0.3%/y (gray) divergence tolerances in FFI CO2 emissions (relative to observations and IEA projections). Image Credit: Pielke Jr, et al., 2022
Figure 2 shows the feasible possibilities in terms of cumulative CO2 emissions from 2000 to 2100 and related end-of-century global mean temperature increase (using the 2005–2050 STEPS filters) (relative to the pre-industrial baseline).
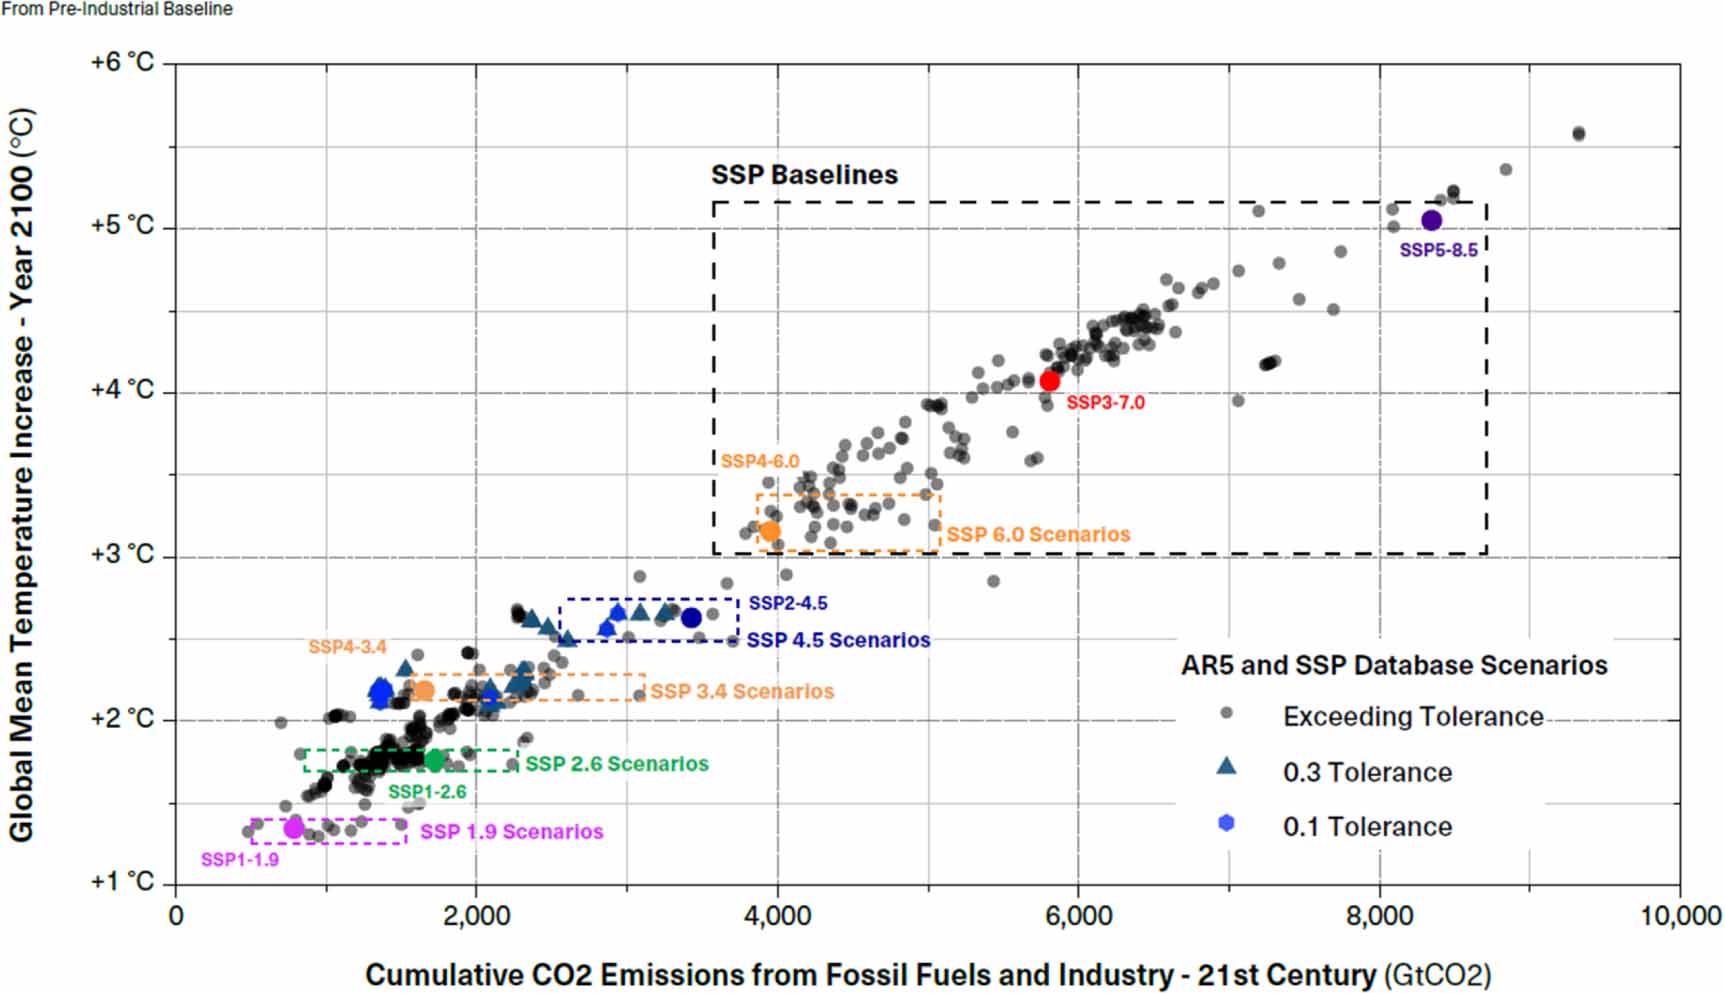
Figure 2. AR5 and SSP scenarios plotted in terms of cumulative FFI CO2 emissions in the 21st century, and warming by 2100, relative to the pre-Industrial baseline. Major SSP scenario ranges (dashed boxes) and marker scenarios are highlighted. Blue circles and light-blue triangles represent scenarios meeting the ±0.1%/y and ±0.3%/y divergence tolerances, respectively, in FFI CO2 emissions (relative to observations and IEA STEPS projections from 2005 to 2050). Image Credit: Pielke Jr, et al., 2022
The 2005–2019 and 2005–2020 filters, on the other hand, permit a small number of scenarios with warming more than 3 °C, while the 2005–2050 APS filter accepts scenarios with warming between 1.5 °C and 2 °C (Figure 3).
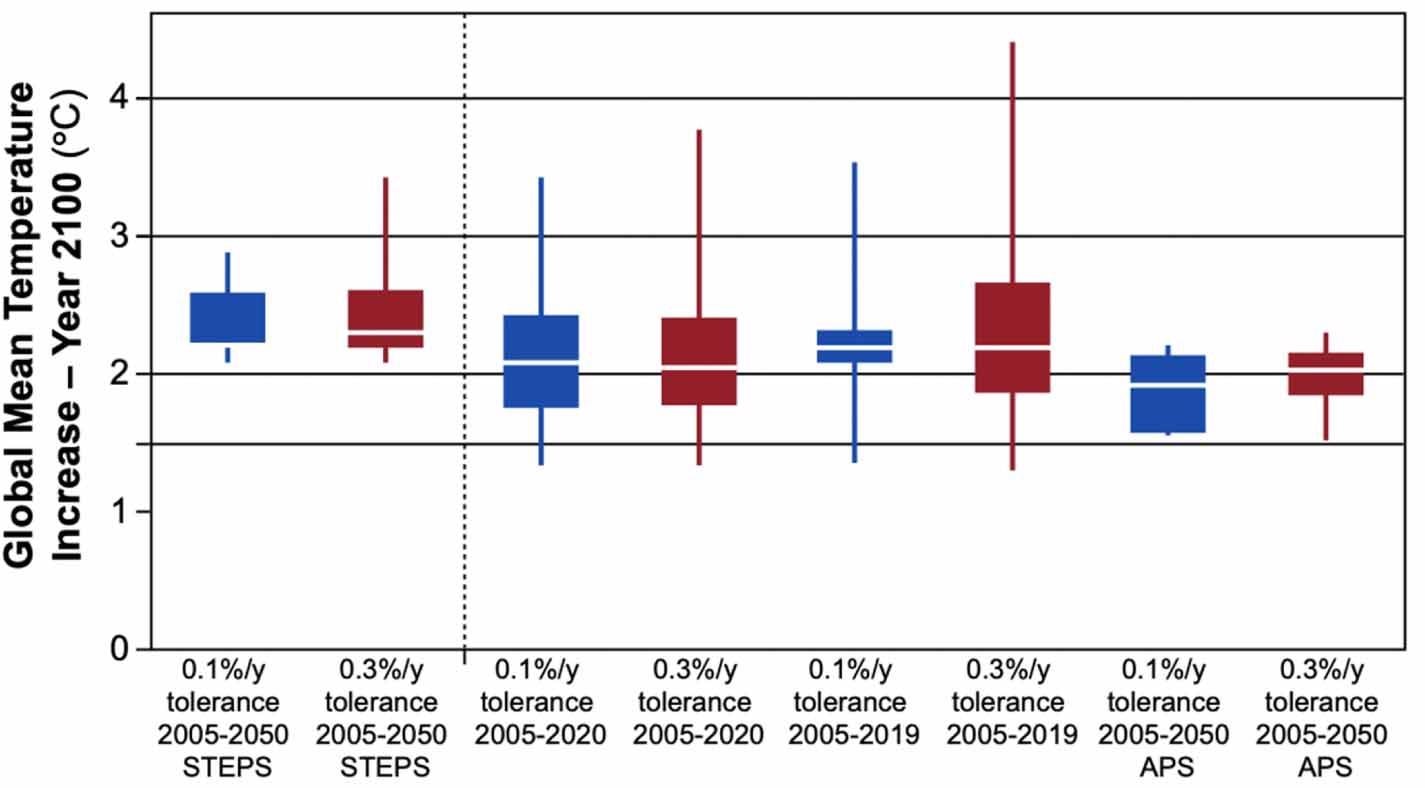
Figure 3. Projected temperature increases (2100, compared to the pre-Industrial baseline) in sets of AR5 and SSP scenarios selected by the various filters used in our analysis, in terms of divergences in FFI CO2 emission growth rates observed and projected by IEA STEPS or APS scenarios. Boxes denote the 25th to 75th percentile ranges; white line denotes the medians; and whiskers denote the minima and maxima. Image Credit: Pielke Jr, et al., 2022
Discussion
The “plausible” subset of IPCC scenarios identified—most consistent with observations to 2020 and IEA estimates to 2050 (Figure 1)—is also compatible with a world that is now well-positioned for future climate policy success via ongoing adoption of policies that take the world closer to meeting or almost achieving a 2 °C target by 2100.
In recent years, however, actual decarbonization has surpassed IEA estimates. As a result, the findings emphasize the importance of continuing efforts to speed global economic decarbonization if the trajectory of currently probable scenarios is to be met or exceeded in the future.
Even if they were established in recent years and decades, the great majority of scenarios that estimate futures beyond 2100 failed the simple criterion of believability by 2020. This raises concerns about using long-term scenarios as forecasts of conceivable futures rather than exploratory tools and highlights the need for policy-relevant scenarios that are updated much more often with fresh observational data, similar to the IEA’s near-term scenarios.
Conclusion
The IEA’s STEPS near-term CO2 emission predictions for 2021 confirm expectations for a long-plateau in CO2 emissions over the following few decades, with projections of less than 3 °C warming by 2100. The envelope of potential situations found in the investigation (Figures 1–3) independently supports such assumptions. Of course, the future is unknown, as it is determined by policy decisions and expectations that will change as time passes.
Deep decarbonization remains a huge task, and achieving net-zero CO2 emissions by 2050—a mainstream policy goal—remains outside even the most plausible scenario paths (Figure 1). decision-makers throughout the world may choose to increase CO2 emissions, but based on evaluations such as the UNEP Emission Gap study, this appears to be very improbable.
The findings show that the world is in an advantageous position to meet the challenge of deep decarbonization, at least in comparison to where IPCC baseline scenarios and some public debate predicted the globe to be in 2021. Climate research and policy rely on the formulation and continuous updating of credible scenarios to enable sustained efforts to achieve deep decarbonization.
Journal Reference:
Pielke Jr, R., Burgess, M. G., & Ritchie, J. (2022). Plausible 2005-2050 emissions scenarios project between 2 and 3 °C of warming by 2100. Environmental Research Letters, 17. Available Online: https://iopscience.iop.org/article/10.1088/1748-9326/ac4ebf.
References and Further Reading
- Anderson, K & Peters, G (2016) The trouble with negative emissions, Science, 354(6309), pp. 182–183. doi.org/10.1126/science.aah4567.
- Bankes, S (1993) Exploratory modeling for policy analysis. Operations Research, 41(3), pp. 435–449. doi.org/10.1287/opre.41.3.435.
- Burgess, M. G., et al. (2020) Optimistically biased economic growth forecasts and negatively skewed annual variation.
- Burgess M. G., et al. (2021) IPCC baseline scenarios have over-projected CO2 emissions and economic growth. Environmental Research Letters, 16, p. 014016. doi.org/10.1088/1748-9326/abcdd2.
- 2100 warming projections (2021) Climate Action Tracker. Available at: https://climateactiontracker.org/global/temperatures/.
- de Resende, C (2014) An assessment of IMF medium-term forecasts of GDP growth (Washington: Independent Evaluation Office of the IMF). IEO Background Paper No. BP/14/01.
- Frankel, J (2011) Over-optimism in forecasts by official budget agencies and its implications. Oxford Review of Economic Policy, 27(4), pp. 536–562. doi.org/10.1093/oxrep/grr025.
- Global Carbon Project (2021) Supplemental data of global carbon budget 2021, (version 1.0). doi.org/10.18160/gcp-2021.
- Hausfather, Z (2021) Flattening the curve of future emissions. Available at: https://thebreakthrough.org/issues/energy/flattening-the-curve-of-future-emissions.
- Hausfather Z &Peters, G P (2020b) RCP8.5 is a problematic scenario for near-term emissions. Processing of the National Academy of Sciences of the USA, 117(45), pp. 27791–27792. doi.org/10.1073/pnas.2017124117.
- Hausfather, Z &Peters, G (2020a) Emissions—the 'business as usual' story is misleading. Nature, 577, pp. 618–620. doi.org/10.1038/d41586-020-00177-3.
- Höök, M (2011) Future coal production outlooks in the IPCC Emission Scenarios: are they plausible? Energy Environment, 22(7), pp. 837–857. doi.org/10.1260/0958-305X.22.7.837.
- IEA (2020) World Energy Outlook 2020. IEA.
- IEA (2021) World Energy Outlook 2021.IEA. Available at: https://gotcp.net/wp-content/uploads/2021/10/WEO2021_Launch_Presentation-1.pdf.
- Intergovernmental Panel on Climate Change (IPCC) (2014) Synthesis Report. Contribution of Working Groups I, II and III to the Fifth Assessment Report of the Intergovernmental Panel on Climate Change (IPCC). Intergovernmental Panel on Climate Change (IPCC). Available at: https://epic.awi.de/id/eprint/37530/.
- International Energy Agency (IEA) (2019) World energy outlook 2019 (IEA)
- International Institute for Applied Systems Analysis (IIASA) (2018) SSP database (shared socioeconomic pathways)—version 2.0. International Institute for Applied Systems Analysis (IIASA). Available at: https://tntcat.iiasa.ac.at/SspDb/dsd.
- IPCC WGIII (2014b) AR5 scenario database version 1.0.2. International Institute for Applied Systems Analysis (IIASA). Available online at: https://tntcat.iiasa.ac.at/AR5DB/dsd.
- IPCC (2018) Special report on global warming of 1.5 °C. Intergovernmental Panel on Climate Change. Available at: https://www.ipcc.ch/site/assets/uploads/sites/2/2019/06/SR15_Full_Report_Low_Res.pdf.
- IPCC (2021) Climate change 2021: the physical science basis Contribution of Working Group I to the Sixth Assessment Report of the Intergovernmental Panel on Climate Change. Intergovernmental Panel on Climate Change.
- Kaya, Y &Yokoburi, K (1997) Environment, Energy, and Economy: Strategies for Sustainability. United Nations University Press, Tokyo. Available at: https://www.researchgate.net/profile/Gilbert-Ahamer/publication/318589446_Decarbonization_of_the_World_Representative_Countries_and_Regions/links/5971d7070f7e9b25e8606f35/Decarbonization-of-the-World-Representative-Countries-and-Regions.pdf.
- Le Quéré, C., et al. (2020) Temporary reduction in daily global CO2 emissions during the COVID-19 forced confinement. Nature Climate Change, 10, pp. 647–653. doi.org/10.1038/s41558-020-0797-x.
- Liddicoat, S. K., et al. (2021) Compatible fossil fuel CO2 emissions in the CMIP6 earth system models' historical and shared socioeconomic pathway experiments of the twenty-first century. Journal of Climate, 34(8), pp. 2853–2875. doi.org/10.1175/JCLI-D-19-0991.1.
- Liu, P R &Raftery, A E (2021) Country-based rate of emissions reductions should increase by 80% beyond nationally determined contributions to meet the 2 °C target. Communications Earth &Environment, 2(29), pp. 1–10. doi.org/10.1038/s43247-021-00097-8.
- Moss R. H., et al. (2010) The next generation of scenarios for climate change research and assessment. Nature, 463, pp. 747–756. doi.org/10.1038/nature08823.
- O'Neill, B., et al. (2020) Achievements and needs for the climate change scenario framework. Nature Climate Change, 10, pp. 1074–1084. doi.org/10.1038/s41558-020-00952-0.
- Pielke Jr, R (2018) Opening up the climate policy envelope. Issues in Science and Technology, 34(4), pp. 30–36. Available at: https://www.jstor.org/stable/26597987.
- Pielke Jr, R & Ritchie, J (2021a) Distorting the view of our climate future: the misuse and abuse of climate pathways and scenarios. Energy Research & Social Science, 72, p. 101890. doi.org/10.1016/j.erss.2020.101890.
- Pielke, R & Ritchie, J (2021b) How climate scenarios lost touch with reality: a failure of self-correction in science has compromised climate science’s ability to provide plausible views of our collective future. Issues in Science and Technology, 37(4), pp. 74–84. Available at: https://www.proquest.com/openview/bf38075fba2245c9537fe15bd89cb513/1?pq-origsite=gscholar&cbl=32581.
- Riahi K., et al. (2017) The shared socioeconomic pathways and their energy, land use, and greenhouse gas emissions implications: an overview. Global Environmental Change, 42, pp. 153–168. doi.org/10.1016/j.gloenvcha.2016.05.009.
- Ritchie, H & Roser, M (2021) CO2 and greenhouse gas emissions. OurWorldInData.org. Available at: https://ourworldindata.org/co2-and-other-greenhouse-gas-emissions.
- Ritchie, J & Dowlatabadi, H (2017) Why do climate change scenarios return to coal? Energy. 140(1), pp. 1276–1291. doi.org/10.1016/j.energy.2017.08.083.
- Rogelj, J., et al. (2016) Paris agreement climate proposals need a boost to keep warming well below 2 °C. Nature, 534. pp. 631–639. doi.org/10.1038/nature18307.
- Schwalm, C. R., et al. (2020) RCP8.5 tracks cumulative CO2 emissions. Processing of the National Academy of Sciences of the USA, 117(33), pp. 19656–19657. doi.org/10.1073/pnas.2007117117.
- Sognnaes, I., et al. (2021) A multi-model analysis of long-term emissions and warming implications of current mitigation efforts. Nature Climate Change, 11, pp. 1055–1062. doi.org/10.1038/s41558-021-01206-3.
- Stammer, D., et al. (2021) Hamburg climate futures outlook 2021: assessing the plausibility of deep decarbonization by 2050.University of Hamburg. doi.org/10.25592/uhhfdm.9104.
- Tebaldi, C., et al. (2021) Climate model projections from the scenario model intercomparison project (ScenarioMIP) of CMIP6. Earth System Dynamics, 12(1), pp. 253–293. doi.org/10.5194/esd-12-253-2021.
- United Nations Environment Programme (UNEP) (2021) Emissions gap report 2021. United Nations Environment Programme. Available at: https://www.unep.org/resources/emissions-gap-report-2021.
- Walton, S., et al. (2019) Developing a theory of plausibility in scenario building: Designing plausible scenarios. Futures, 111, pp. 42–56. doi.org/10.1016/j.futures.2019.03.002.
- Wiek, A., et al. (2013) Plausibility indications in future scenarios. International Journal of Foresight and Innovation Policy, 9(2,3,4) pp. 133–147. doi.org/10.1504/IJFIP.2013.058611.
- Working Group III of the Intergovernmental Panel on Climate Change (IPCC WGIII) (2014a) Climate change 2014: mitigation of climate change Working Group III contribution to the fifth assessment report of the Intergovernmental Panel on Climate Change (IPCC).