In many places and seasons, soil moisture is a possible source of rainfall prediction. Two conditions must be met for these “hotspots” of soil moisture-precipitation feedback to exist.

Image Credit: Piyaset/Shutterstock.com
To begin with, soil moisture deficiencies must exert a considerable influence on the partitioning of surface energy into sensible and latent heat fluxes. Second, assuming suitable land surface fluxes, the atmosphere must be capable of supporting deep convection.
According to an ensemble of global forecast models, these conditions are met in countries such as India and the US Great Plains during boreal summer, when soil moisture deficiencies intersect with periods of convective rainfall.
The African Sahel meets these criteria and offers the most satisfactory evidence of soil moisture-precipitation feedback in operation, according to global observational assessments.
The high concentration of yearly rain in June–September leads to sparse, fast-emerging plant cover, with surface energy balance dynamics dominated by the presence of near-surface soil moisture from recent rain. Mesoscale convective systems (MCSs) produce the vast bulk of Sahel rainfall.
Severe storm forecasts are urgently needed here, as heavy rain and high winds can cause significant damage. Increased flash flooding damages are caused by the fast expansion of metropolitan centers across the region, frequently with inadequate drainage networks.
In the context of climate change, this problem is escalating. The frequency of the extreme MCSs has already increased dramatically in the region, and this tendency is expected to continue.
Due to the obvious fast expansion and persistence of MCSs, NRT rainfall projections must include current active convection and pre-convective instability. Even in places with significantly more observations and computer resources for rapid data assimilation, this remains a challenge for Numerical Weather Prediction (NWP) systems. Extrapolation-based nowcasting is a crucial forecasting tool in the absence of dependable NWP.
Researchers look at how to combine NRT satellite data of the ground surface and clouds to improve the ability to predict dangerous long-lived storms in the Sahel.
Methodology
Researchers concentrate on the West African Monsoon, which runs from June to September (JJAS), and pay special attention to the latitudes 10°–20° N, which encompass the Southern, Mid, and Northern Sahel (Figure 1a).
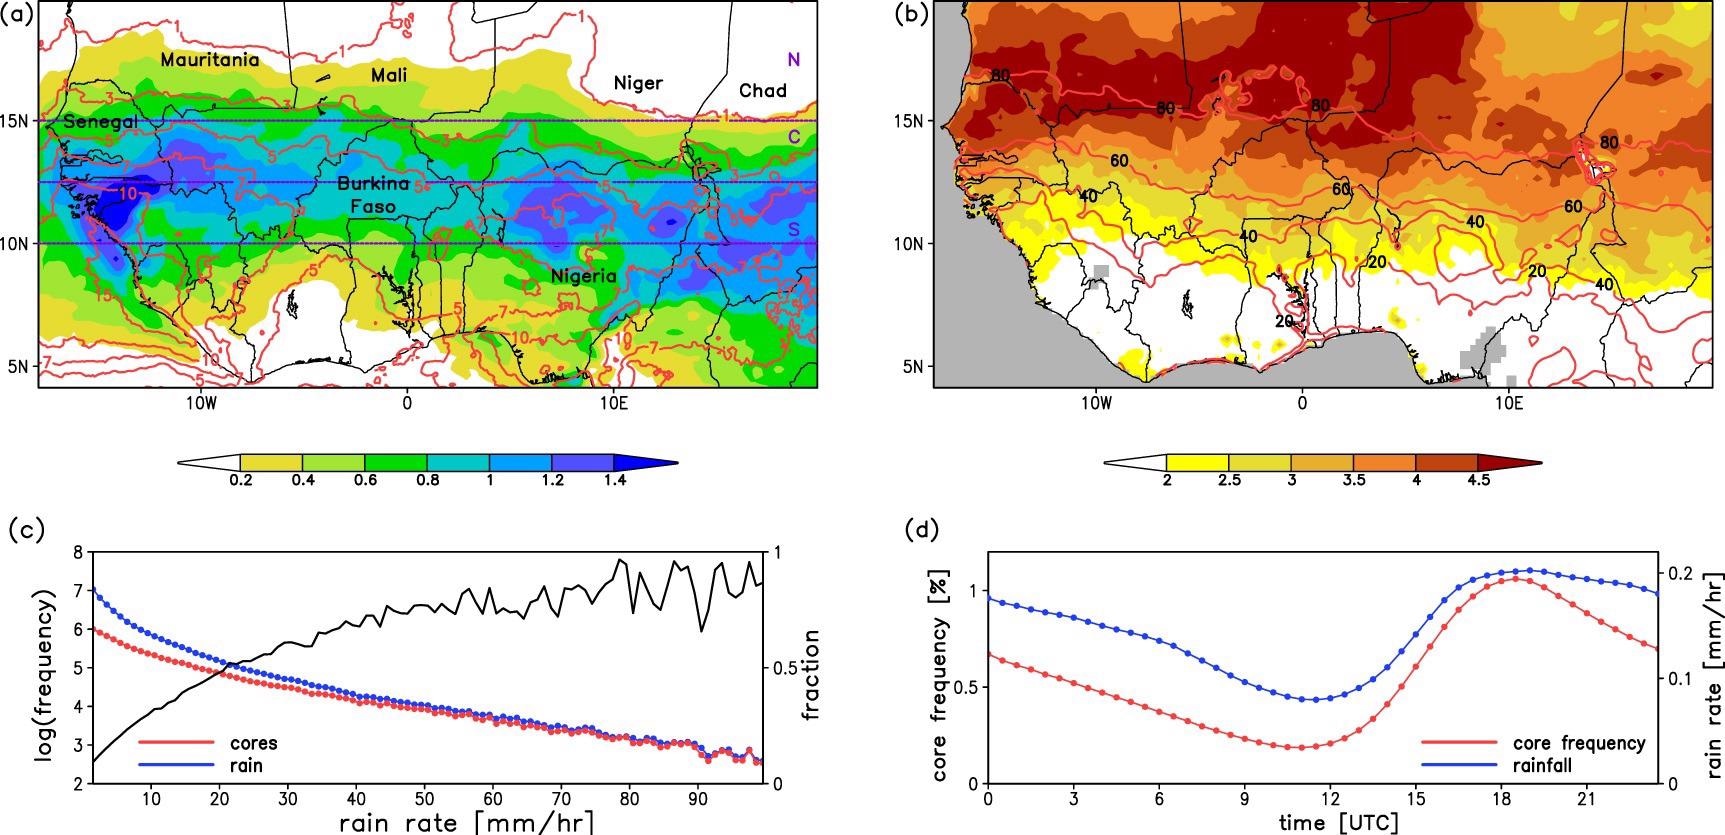
Figure 1. (a) Mean core frequency (shading; %) and rainfall (red contours; mm d−1) across West Africa. Horizontal dashed lines denote the boundaries of the Southern (‘S’), Central (‘C’), and Northern (‘N’) Sahel. (b) The standard deviation of LSTA (shading; K) and a fraction of days with valid data (contours; %). (c) Frequency of cores (red) and rain rate (blue) as a function of rain rate. The black line shows the fraction of rainfall within convective cores, amounting to 0.69 for rain rates of 30 mm h−1 or more. (d) Diurnal cycle of core frequency (red; %) and rain rates (blue; mm h−1). The data in all panels are for the period 2004–2015 and the months June–September. Image Credit: Taylor, et al., 2022
Researchers use data from the Meteosat Second Generation series of satellites’ Spinning Enhanced Visible and Infrared Imager (SEVIRI). This generates photos every 15 minutes from 12 channels with a spatial resolution of roughly 3 km and a delay of 30 minutes over the domain.
Land surface temperature (LST) measurements taken from the 10.8- and 12-meter SEVIRI channels under clear skies are used to define the land surface state.
The standard deviation of daily LSTA (Figure 1b) depicts fundamental elements of Sahelian land surface behavior. In the south, where soil moisture control on ET is minimal and the well-vegetated surface is aerodynamically rougher, day-to-day fluctuation in LSTA is lowest.
To apply in NRT, researchers first build climatological connections between antecedent LSTA and the likelihood of a convective core. They produce a “cores” sample of LSTAs for every 30 minutes of the day within the historical period, which lay below the maximum wavelet power in each convective core.
Researchers utilize LSTA data produced from an average of all photos between 0700 and 1200 UTC on that day for cores detected between 1200 and 1700 UTC, and LSTA data based on images from 0700 to 1700 UTC for succeeding hours.
This relationship is shown in Figure 2a for all 19 908 Sahelian convective cores observed at 1700 UTC. The frequency of cores detected within each decile would be around 10% if there were no link between LSTA and convection. Instead, a large positive association exists.
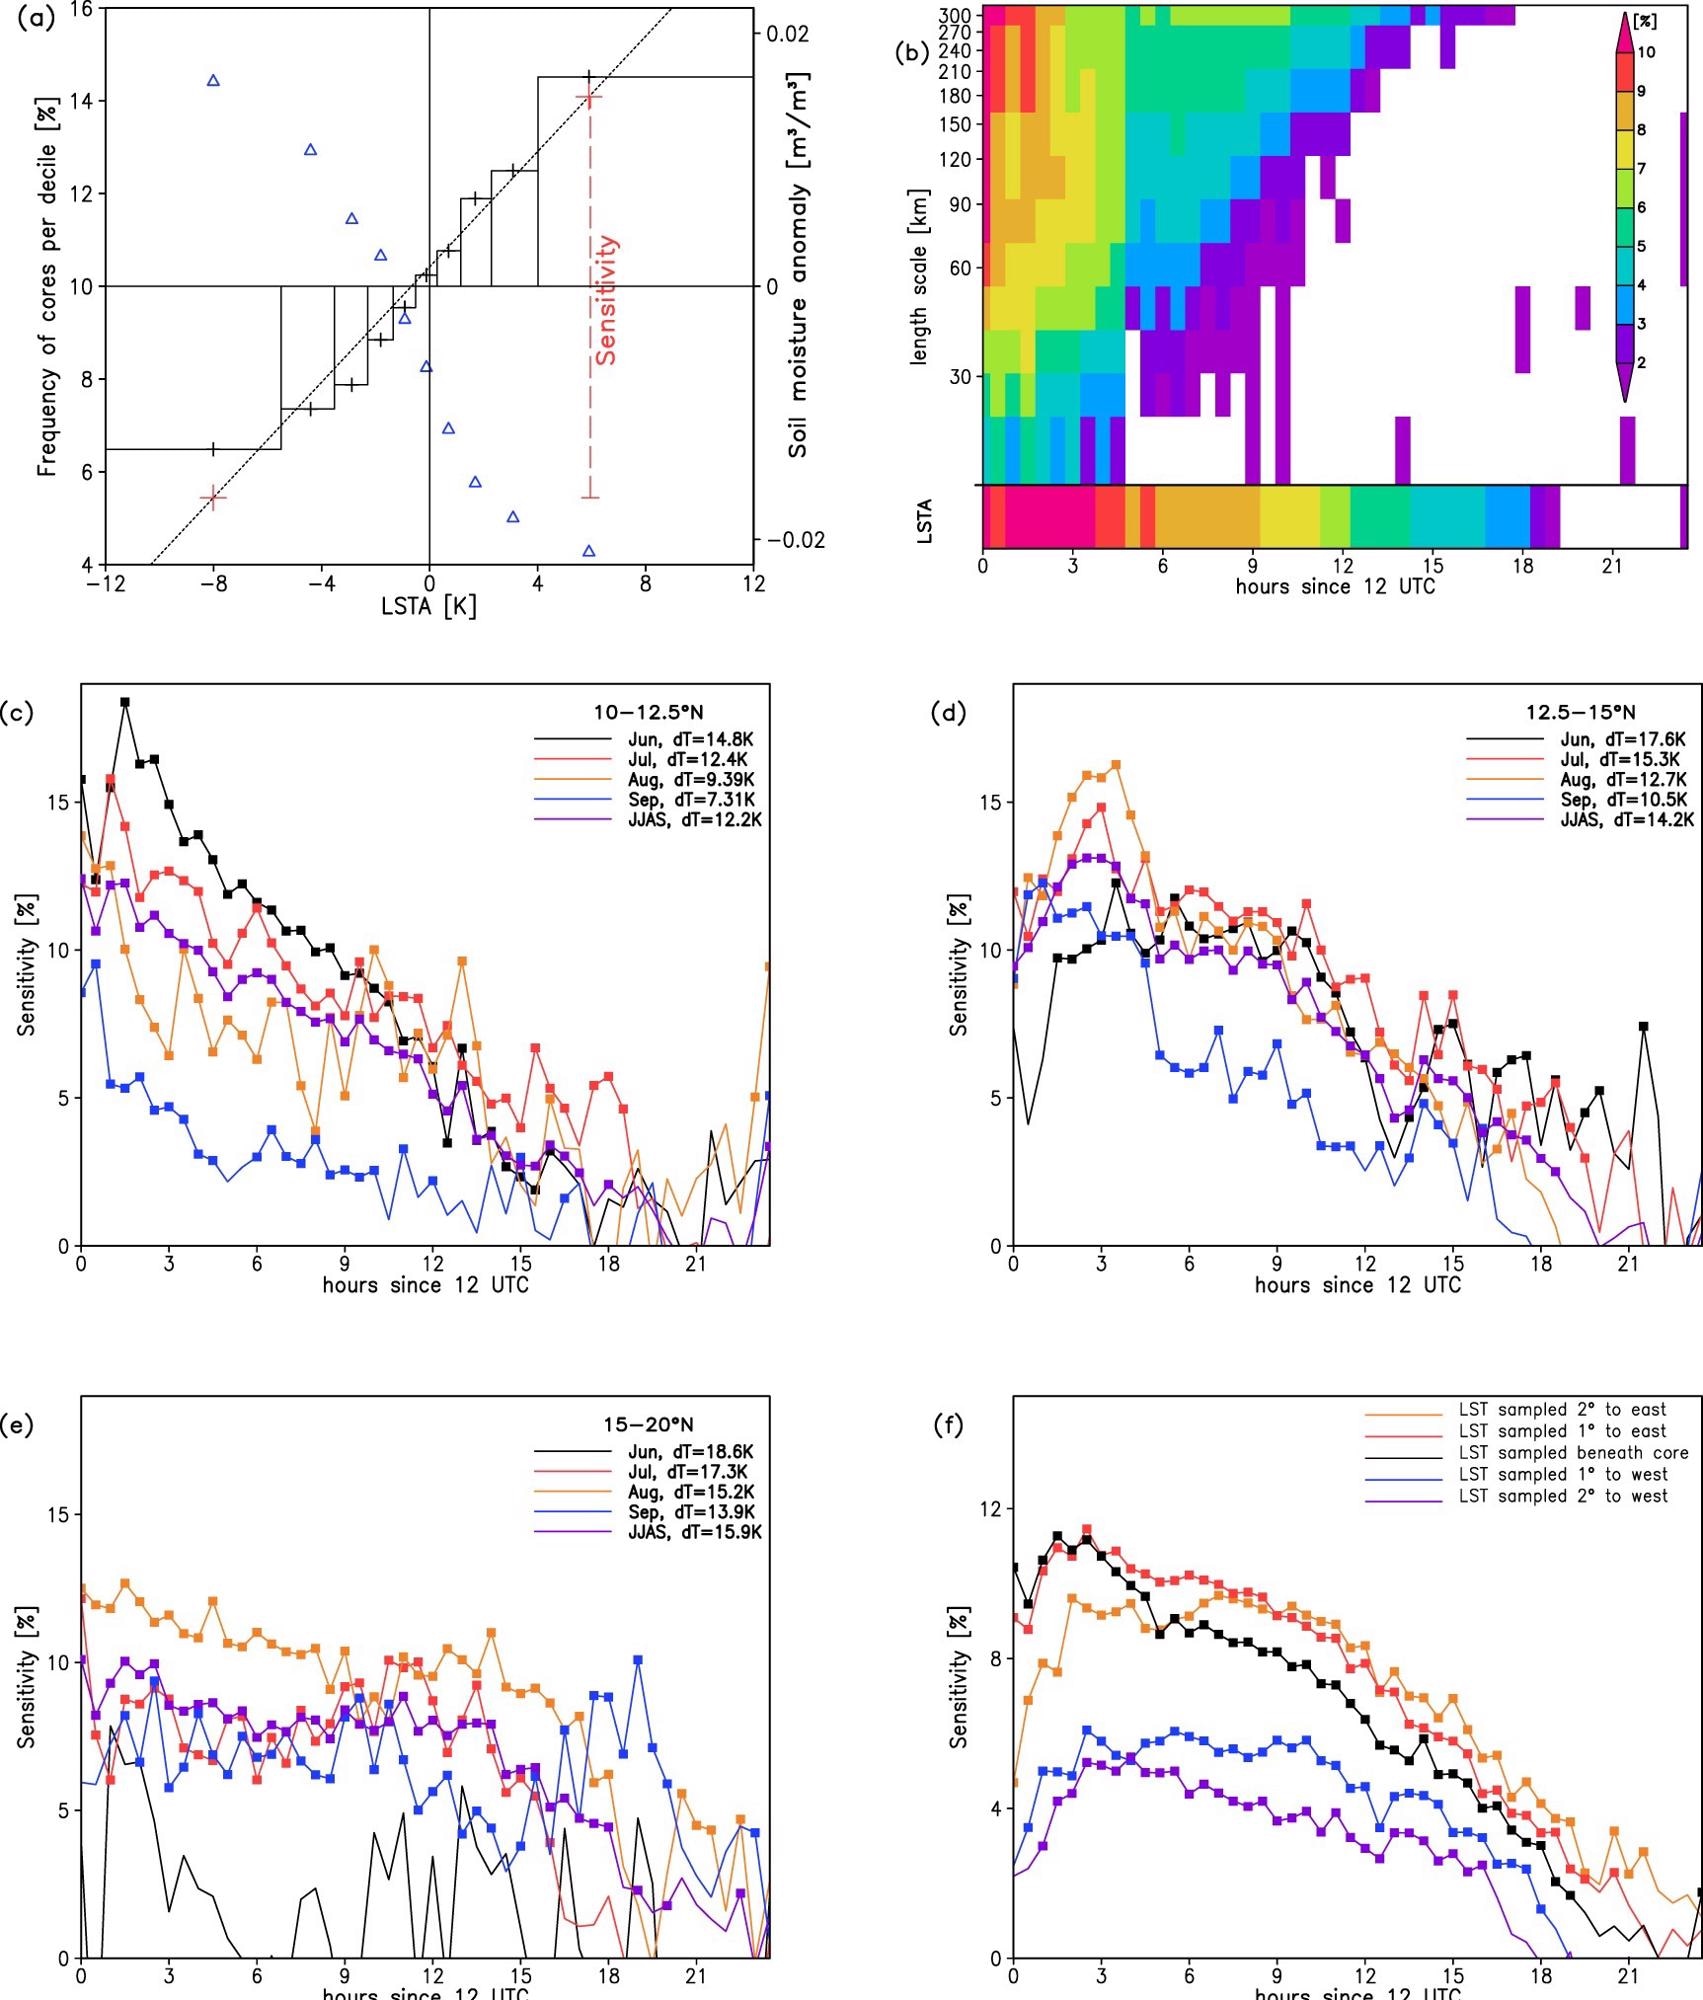
Figure 2. Sensitivity (%) of cores to LSTA (K) based on data 2004–2015. (a) The frequency of cores was observed within each LSTA decile at 1700 UTC. The distance along the red dashed line defines the sensitivity of cores to LSTA. Blue triangles denote observed soil moisture (m3 m−3) averaged over all days and locations in the control sample. (b) Sensitivity of cores to LSTA as a function of time since 1200 UTC (lower panel). Sensitivity of cores to LSTA variability at different length scales (km) and times of day (upper panel). Note that LSTA variability is normalized by its standard deviation for each length scale considered. Sensitivity of cores to LSTA by month for (c) 10–12.5° N, (d) 12.5–15° N, and (e) 15–20° N. For each month, the difference in LSTA between the 10th and 1st deciles (dT; K) is given in the legend. (f) Sensitivity of cores to LSTA sampled at different longitudinal offsets. Apart from (c)–(e), the regressions are based on data from 10 to 20° N and months JJAS. Only sensitivities where the regression gradient is significantly positive (P < 0.05) are plotted in (b) and have squares in (c)–(f). Image Credit: Taylor, et al., 2022
Convective cores should be particularly sensitive to LSTA in the afternoon when the planetary boundary layer is well developed and daytime flux patterns drive its spatial variability. Figure 2b, on the other hand, shows that from midday to 0800 UTC the next day, there is a considerable positive association.
In other words, even 12 hours after sunset, convection from the previous day’s LSTA is still predictable.
Figure 2b shows the surface length scales responsible for this signal, depending on the same sensitivity calculation but with LSTA wavelet power instead of LSTA.
The sensitivities for the Southern, Central, and Northern Sahel are shown in Figures 2c–e by month. After a very high signal in June, the sensitivity in the Southern Sahel falls as the season proceeds. We attribute this primarily to decreasing day-to-day surface energy balance fluctuation, as measured by the change in LSTA between the 10th and 1st deciles.
Figure 2f shows how changing the LSTA’s sampling site by 1° longitude can significantly impact the sensitivity. The sensitivity of the local LSTA is highest in the early afternoon when local initiation causes an increase in core frequency (figure 1d).
Figure 3 shows the frequency distribution of LMFs beneath each core recorded in September 2021 as a basic demonstration of the method’s capability.
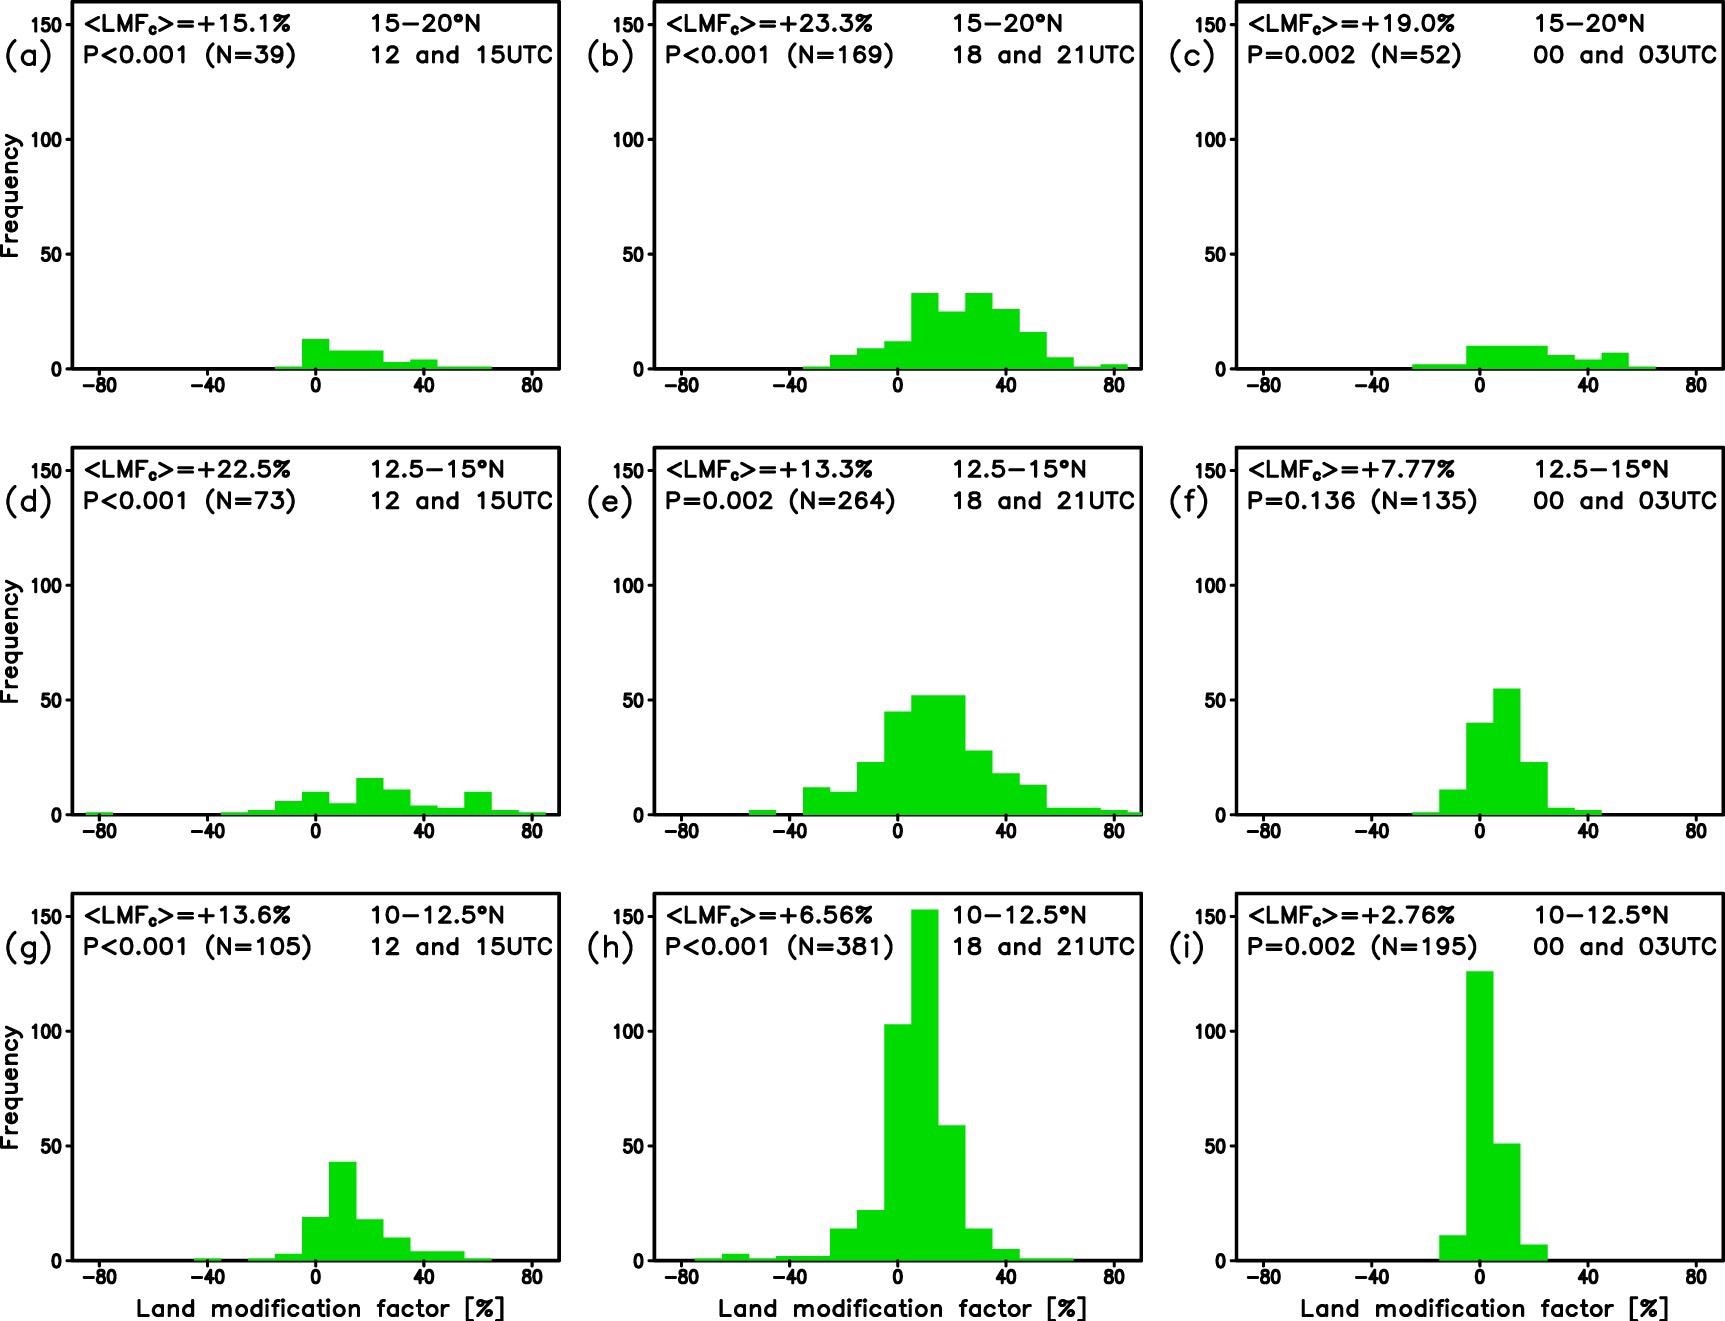
Figure 3. Evaluation of core frequency during September 2021. Frequency of observed cores, binned by land modification factor (green bars). The data are presented in rows by latitude band from the Northern (top) to Southern (bottom) of the Sahel. Each column combines data from two forecast hours (left: 1200 and 1500 UTC, middle 1800 and 2100 UTC, right: 0000 and 0300 UTC). Noted in each panel is the probability (P) of randomly sampling a mean LMF as large as the observed core pixel mean (<LMFC>), based on N events. Image Credit: Taylor, et al., 2022
Figure 4 displays the situation on September 15, 2021, when a strong MCS hit the Western Sahel, triggering shorter-lived convective storms along a line that ran across Mali and Niger.
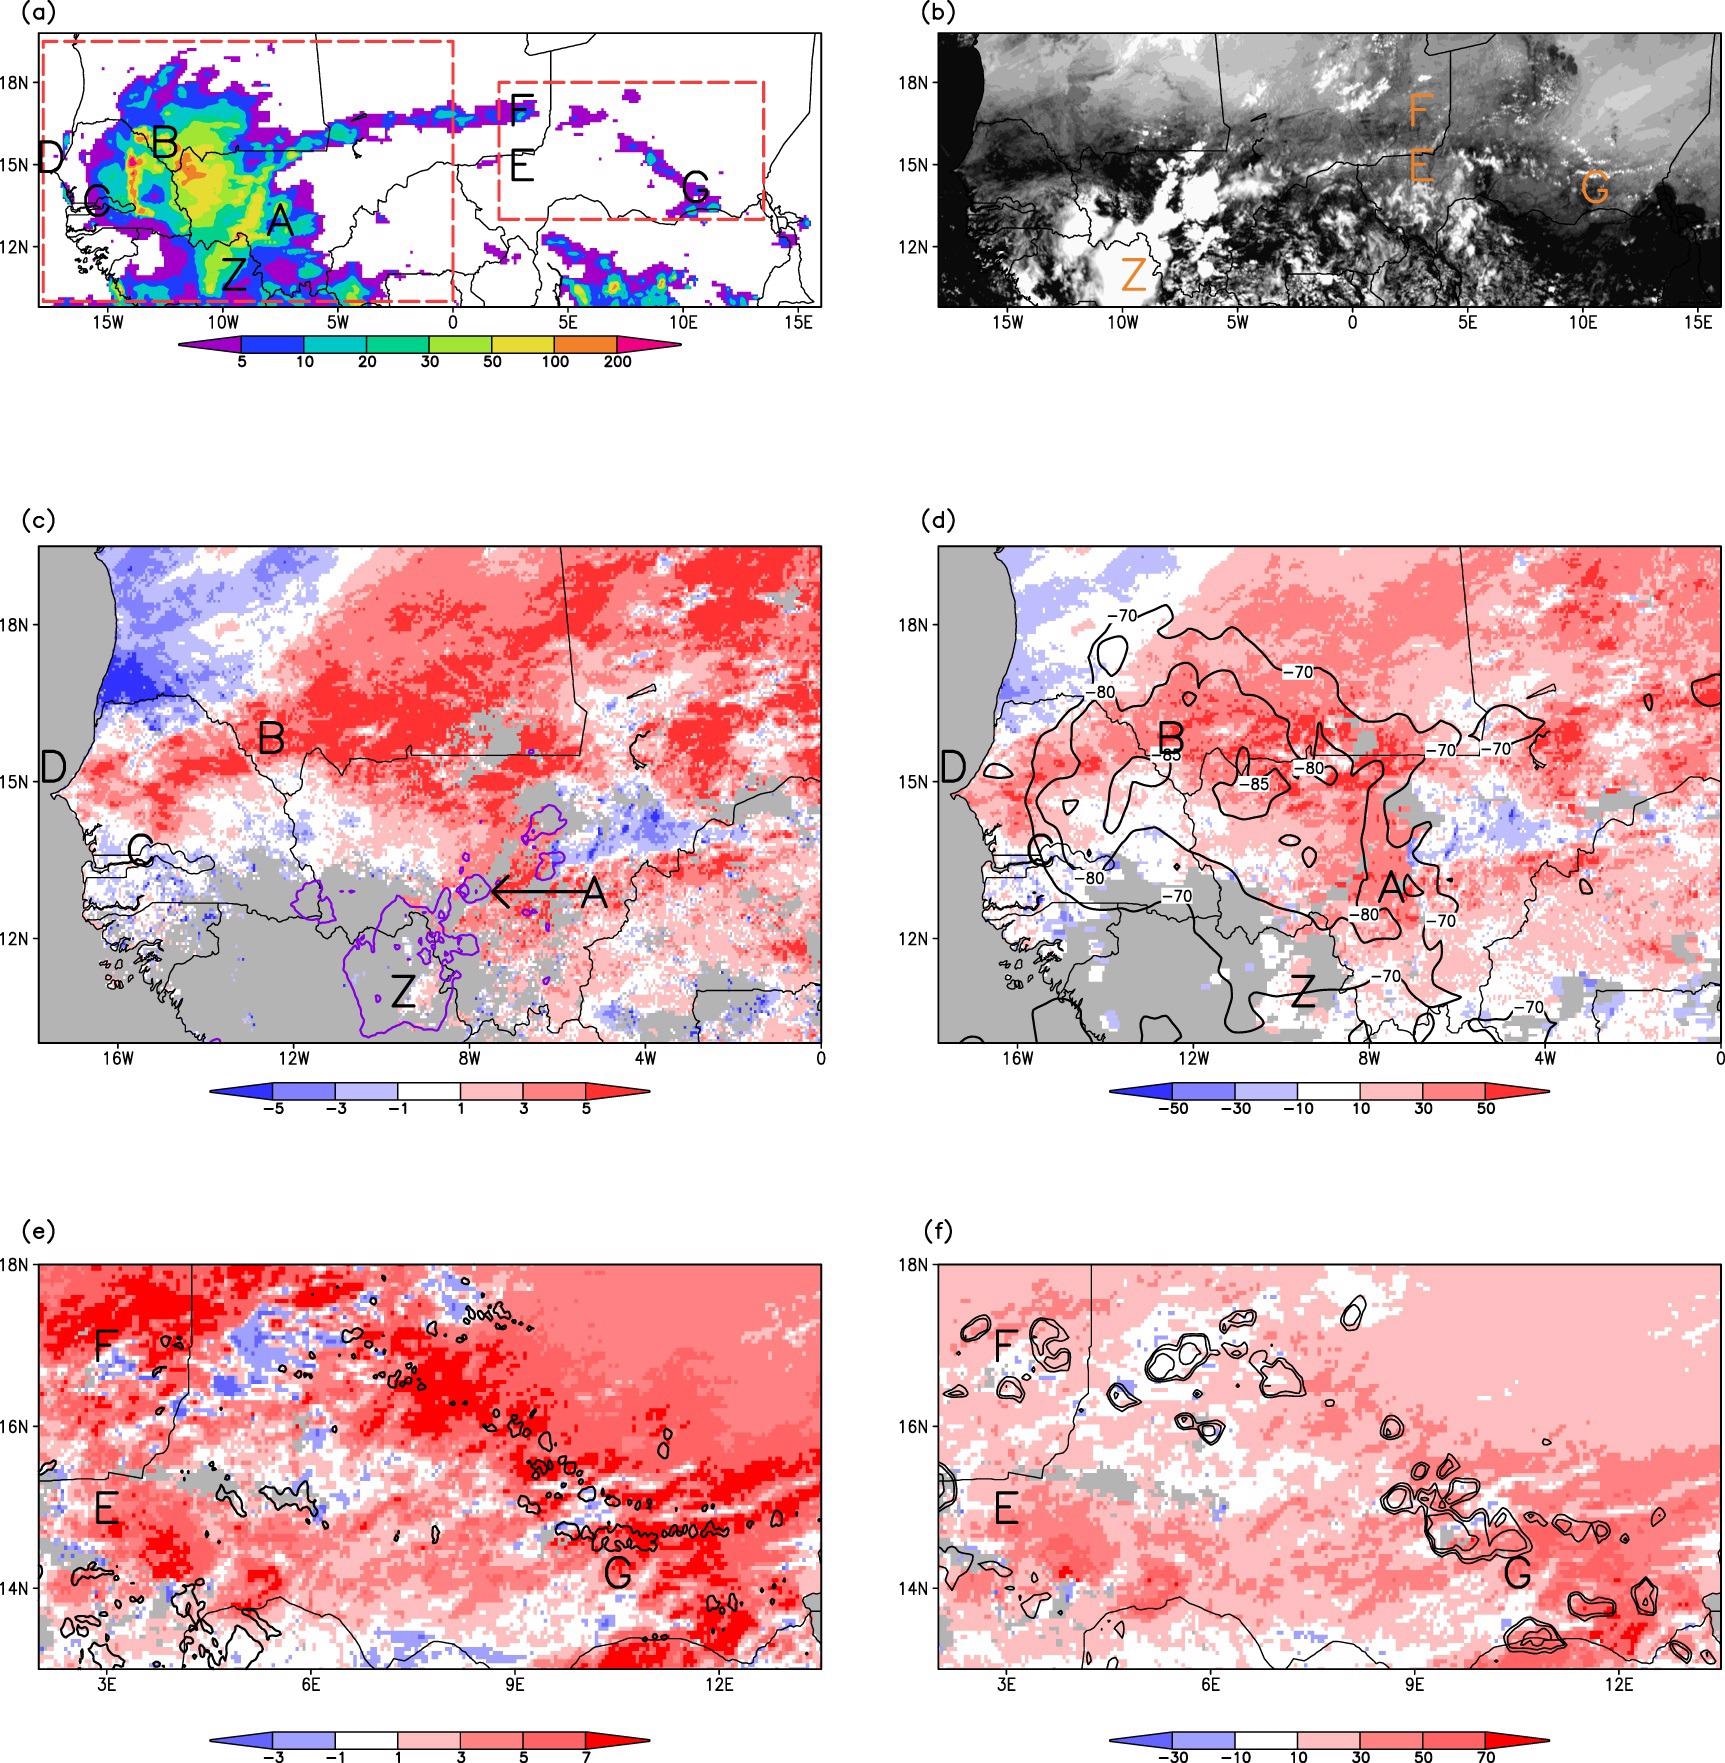
Figure 4. Satellite data from the Testbed case study day of 15 September. (a) IMERG late run accumulated rainfall (mm) 1300–2400 UTC. (b) Visible channel data at 1300 UTC. Major MCS over Western Sahel (c), (d). (c) Initiating (‘A’) and decaying (‘Z’) MCSs at 1230 UTC are depicted by contours at −80 °C and −70 °C, with shading depicting LSTA (K). (d) Non-local land modification factor (%; valid at 1800 UTC) and minimum cloud-top temperature (−85 °C, −80 °C, −70 °C contours) between 1400 and 2400 UTC. Initiation of isolated convective storms in the Central Sahel (e), (f). (e) LSTA (shading) and clouds were detected from the visible channel at 1330 UTC. (f) Local land modification factor (%, valid at 1500 UTC) and cold cloud top temperatures (−60 °C, −40 °C, −20 °C) at 1515 UTC. In (c)–(f), grey pixels indicate no land data due to cloud cover. Additional letters denote locations defined in the text. Image Credit: Taylor, et al., 2022
Results and Discussion
Researchers found a substantial relationship between positive LSTAs and subsequent intense convection within MCSs in the Sahel in this research. This sensitivity is not limited to the afternoon when land-atmosphere feedbacks are projected to be at their peak.
Warmer surface features on many hundred-kilometer length scales help maintain prediction capability overnight, while the effects of smaller-scale land variability eventually fade in the evening.
Physically, enhanced LSTAs indicate areas where ET is more moisture-stressed than usual, with much excess surface energy warming the boundary layer. The importance of LSTA variability on scales of several hundred kilometers is consistent with KT20; propagating MCSs tend to weaken over wetter surfaces and intensify over drier soils.
Upstream soil conditions that are favorable (dry) improve the possibility of an MCS propagating further overnight. The mixture of both long-lived and sensitive storms to slowly changing land states enables skillful nowcasting of MCSs tracks out to many hours, much longer than previously tried.
One does not anticipate a rigorous statistical signal every day with such a small number of cores. Interestingly, the signal was seen at the 99% level on five out of the twelve Testbed days.
On the other aspect, the dependence on cloud-free LST data will limit the applicability of our strategy during the rainy season, especially in the Southern Sahel.
Conclusion
Researchers have shown how land surface data can help enhance manual severe weather forecasts, especially at scales of tens of kilometers. At least in places without strong orographic or coastal forcing, reliable prediction at such scales is well beyond the capabilities of present NWP systems in the Sahel.
In recent research in West Africa, forecasting is based purely on antecedent rainfall outperformed forecasts from a cutting-edge ensemble forecasting system. The impact of synoptic rainfall organization identified in their research is included in the approach, as is data on antecedent rain.
The nature of that land information could be improved in several ways. For instance, by adjusting the location of the upstream LSTA target and filtering out fine-scale land highlights in overnight nowcasts, re-introducing elements of the climatological LST field associated with substantial mesoscale landscapes such as wetlands and urban areas, and incorporating microwave soil moisture retrievals to transcend cloud cover problems.
Such advancements could be immensely beneficial to decision-makers in West African areas such as civil defense, agriculture, travel, and aviation. Beyond West Africa, and depending on the intensity of the soil moisture-MCS coupling, these strategies could potentially be used in other semi-arid regions with poor forecasts.
Journal Reference:
Taylor, C. M., Klein, C., Dione, C., Parker, D. J., Marsham, J., Diop, C. A., Fletcher, J., Chaibou, A. A. S., Nafissa, D. B., Semeena, V. S., Cole, S. J., Anderson, S. R. (2022) Nowcasting tracks of severe convective storms in West Africa from observations of land surface state. Environmental Research Letters, 17(3), p. 034016. Available Online: https://iopscience.iop.org/article/10.1088/1748-9326/ac536d.
References and Further Reading
- Dirmeyer, P. A., et al. (2018) On the harvest of predictability from land states in a global forecast model. Journal of Geophysical Research: Atmospheres, 123, pp. 13–111. doi.org/10.1029/2018JD029103.
- Koster R., et al. (2011) The second phase of the global land–atmosphere coupling experiment: soil moisture contributions to subseasonal forecast skill. Journal of Hydrometeorology, 12, pp. 805–22. doi.org/10.1175/2011JHM1365.1.
- Koster, R. D., et al. (2004) Regions of strong coupling between soil moisture and precipitation. Science, 305, pp. 1138–40. doi.org/10.1126/science.1100217.
- Taylor, C. M., et al. (2012) Afternoon rain more likely over drier soils. Nature, 489, pp. 423–426. doi.org/10.1038/nature11377.
- Dirmeyer, P. A (2011) The terrestrial segment of soil moisture-climate coupling. Geophysical Research Letters, 38, p. L16702. doi.org/10.1029/2011GL048268.
- Seneviratne, S. I., et al. (2010) Investigating soil moisture-climate interactions in a changing climate: a review. Earth-Science Reviews, 99, pp. 125–61. doi.org/10.1016/j.earscirev.2010.02.004.
- Findell, K L & Eltahir, E A B (2003) Atmospheric controls on soil moisture-boundary layer interactions. Part I: framework development. Journal of Hydrometeorology, 4, pp. 552–69. doi.org/10.1175/1525-7541(2003)004%3C0552:ACOSML%3E2.0.CO;2.
- Guillod, B. P., et al. (2015) Reconciling spatial and temporal soil moisture effects on afternoon rainfall. Nature Communications, 6, p. 6443. doi.org/10.1038/ncomms7443.
- Lohou, F., et al. (2014) Surface response to rain events throughout the West African monsoon. Atmospheric Chemistry and Physics, 14, pp. 3883–98. doi.org/10.5194/acp-14-3883-2014.
- Mathon, V., et al. (2002) Mesoscale convective system rainfall in the Sahel. Journal of Applied Meteorology and Climatology, 41, pp. 1081–92. doi.org/10.1175/1520-0450(2002)041%3C1081:MCSRIT%3E2.0.CO;2.
- Futyan, J M & Genio, A D D (2007) Deep convective system evolution over Africa and the tropical Atlantic. The Journal of Climate, 20, pp. 5041–60. doi.org/10.1175/JCLI4297.1.
- Taylor, C. M., et al. (2007) An observational case study of mesoscale atmospheric circulations induced by soil moisture. Geophysical Research Letters, 34, p. L15801. doi.org/10.1029/2007GL030572.
- Taylor, C. M., et al. (2011) Frequency of Sahelian storm initiation enhanced over mesoscale soil-moisture patterns. Nature Geoscience, 4, pp. 430–3. doi.org/10.1038/ngeo1173.
- Gantner, L & Kalthoff, N (2010) Sensitivity of a modelled life cycle of a mesoscale convective system to soil conditions over West Africa. Quarterly Journal of the Royal Meteorological Society, 136, pp. 471–82. doi.org/10.1002/qj.425.
- Klein, C & Taylor, C M (2020) Dry soils can intensify mesoscale convective systems. Proceedings of the National Academy of Sciences of the United States of America, 117, pp. 21132–7. doi.org/10.1073/pnas.2007998117.
- Cook, K H (1999) Generation of the African easterly jet and its role in determining West African precipitation. The Journal of Climate, 12, pp. 1165–84. doi.org/10.1175/1520-0442(1999)012%3C1165:GOTAEJ%3E2.0.CO;2.
- Vizy, E K & Cook, K H (2018) Mesoscale convective systems and nocturnal rainfall over the West African Sahel: role of the inter-tropical front. Climate Dynamics, 50, pp. 587–614. doi.org/10.1007/s00382-017-3628-7.
- Taylor, C. M., et al. (2017) Frequency of extreme Sahelian storms tripled since 1982 in satellite observations. Nature, 544, pp. 475–8. doi.org/10.1038/nature22069.
- Taylor, C. M, et al. (2005) Observations of synoptic scale land surface variability and its coupling with the atmosphere. Quarterly Journal of the Royal Meteorological Society, 131, pp. 913–38. doi.org/10.1256/qj.04.119.
- Parker, D J (2008) A simple model of coupled synoptic waves in the land surface and atmosphere of the northern Sahel. Quarterly Journal of the Royal Meteorological Society, 134, pp. 2173–84. doi.org/10.1002/qj.343.
- di Baldassarre, G., et al. (2010) Flood fatalities in Africa: from diagnosis to mitigation. Geophysical Research Letters, 37, p. L22402. doi.org/10.1029/2010GL045467.
- Panthou, G., et al. (2018) Rainfall intensification in tropical semi-arid regions: the Sahelian case Environmental Research Letters, 13, p. 064013.
- Klein, C., et al. (2021) Combining CMIP data with a regional convection-permitting model and observations to project extreme rainfall under climate change. Environmental Research Letters, 16, p. 104023.
- Berthou, S., et al. (2019) Larger future intensification of rainfall in the West African Sahel in a convection-permitting model. Geophysical Research Letters, 46, pp. 13299–307. doi.org/10.1029/2019GL083544.
- Vogel, P., et al. (2018) Skill of global raw and postprocessed ensemble predictions of rainfall over northern tropical Africa. Weather Forecast, 33, pp. 369–88. https://doi.org/10.1175/WAF-D-17-0127.1.
- Baumgart, M., et al.(2019) Quantitative view on the processes governing the upscale error growth up to the planetary scale using a stochastic convection scheme. Monthly Weather Review, 147, pp. 1713–31. doi.org/10.1175/MWR-D-18-0292.1.
- Vogel, P., et al. (2021) Statistical forecasts for the occurrence of precipitation outperform global models over northern tropical Africa. Geophysical Research Letters, 48, p. e2020GL091022. https://doi.org/10.1029/2020GL091022.
- Yano, J. I., et al. (2018) Scientific challenges of convective-scale numerical weather prediction. Bulletin of the American Meteorological Society, 99, pp. 699–710. doi.org/10.1175/BAMS-D-17-0125.1.
- Wilson, J., et al. (2020) NWP and radar extrapolation: comparisons and explanation of errors. Monthly Weather Review, 148, pp. 4783–98. doi.org/10.1175/MWR-D-20-0221.1.
- Jones, T. A, et al. (2016) Storm-scale data assimilation and ensemble forecasting with the NSSL experimental warn-on-forecast system. Part II: combined radar and satellite data experiments. Weather Forecast, 31, pp. 297–327. doi.org/10.1175/WAF-D-15-0107.1.
- Fabry, F & Meunier, V (2020) Why are radar data so difficult to assimilate skillfully? Monthly Weather Review, 148, pp. 2819–36. doi.org/10.1175/MWR-D-19-0374.1.
- Roberts, A. J., et al. (2021) Nowcasting for Africa: advances, potential and value Weather. doi.org/10.1002/wea.3936.
- Kolios, S & Feidas, H (2013) An automated nowcasting system of mesoscale convective systems for the Mediterranean basin using Meteosat imagery. Part I: system description. Meteorological Applications, 20, pp. 287–95. doi.org/10.1002/met.1282.
- Pulkkinen, S., et al. (2019) Pysteps: an open-source Python library for probabilistic precipitation nowcasting (v1.0). Geoscientific Model Development, 12, pp. 4185–219. doi.org/10.5194/gmd-12-4185-2019.
- Ravuri, S., et al. (2021) Skilful precipitation nowcasting using deep generative models of radar. Nature, 597, pp. 672–7. doi.org/10.1038/s41586-021-03854-z.
- Chen, L., et al. (2020) A deep learning-based methodology for precipitation nowcasting with radar. Earth and space Science, 7, p. e2019EA000812. doi.org/10.1029/2019EA000812.
- James, P. M, et al. (2018) NowCastMIX: automatic integrated warnings for severe convection on nowcasting time scales at the German Weather Service. Weather Forecast, 33, pp. 1413–33. doi.org/10.1175/WAF-D-18-0038.1.
- Parker, D. J., et al. (2021) The African SWIFT project: growing science capability to bring about a revolution in weather prediction. Bulletin of the American Meteorological Society, pp. 1–53. doi.org/10.1175/BAMS-D-20-0047.1.
- Hill, P. G., et al. (2020) How skilful are nowcasting satellite applications facility products for tropical Africa? Meteorological Applications, 27, p. e1966. doi.org/10.1002/met.1966.
- Burton, R. R., et al. (2022) Satellite-based nowcasting of West African mesoscale storms has skill at up to four hours lead time. Weather Forecast. doi.org/10.1175/WAF-D-21-0051.1.
- WMO (2017) Guidelines for Nowcasting Techniques (Geneva: World Meteorological Organisation)
- Klein, C., et al. (2018) Wavelet scale analysis of mesoscale convective systems for detecting deep convection from infrared imagery. Journal of Geophysical Research: Atmospheres, 123, pp. 3035–50. doi.org/10.1002/2017JD027432.
- Sobrino, J A & Romaguera, M (2004) Land surface temperature retrieval from MSG1-SEVIRI data. Remote Sensing of Environment, 92, pp. 247–54. doi.org/10.1016/j.rse.2004.06.009.
- Anderson, M & Kustas, W (2008) Thermal remote sensing of drought and evapotranspiration. Eos Transactions American Geophysical Union, 89, p. 233. doi.org/10.1029/2008EO260001.
- Fisher, J. B., et al. (2020) ECOSTRESS: NASA's next generation mission to measure evapotranspiration from the international space station. Water Resources Research, 56, p. e2019WR026058. doi.org/10.1029/2019WR026058.
- Carlson, T (2007) An overview of the 'triangle method' for estimating surface evapotranspiration and soil moisture from satellite imagery. Sensors, 7, pp. 1612–29. doi.org/10.3390/s7081612.
- Gallego-Elvira, B., et al., (2016) Global observational diagnosis of soil moisture control on the land surface energy balance. Geophysical Research Letters, 43, pp. 2623–31. doi.org/10.1002/2016GL068178.
- Owe, M., et al. (2008) Multisensor historical climatology of satellite-derived global land surface moisture. Journal of geophysical research. Earth surface, 113. doi.org/10.1029/2007JF000769.
- Parker, D. J., et al. (2005) The diurnal cycle of the West African monsoon circulation. Quarterly Journal of the Royal Meteorological Society, 131, pp. 2839–60. doi.org/10.1256/qj.04.52.
- Dione, C., et al. (2013) Phenomenology of Sahelian convection observed in Niamey during the early monsoon. Quarterly Journal of the Royal Meteorological Society, pp. 500–16. doi.org/10.1002/qj.2149.
- Rieck, M., et al. (2014) The influence of land surface heterogeneities on cloud size development. Monthly Weather Review, 142, pp. 3830–46. doi.org/10.1175/MWR-D-13-00354.1.