Hydrogen is an important component in the production of chemicals and fertilizers, and it is a promising source of heat in the future. The use of steam methane reforming to produce hydrogen can be coupled with carbon capture utilization and storage (CCUS). The combination of fossil-derived hydrogen and CCUS is known as “blue hydrogen.” This article looks at recent research published in Clean Technologies detailing advanced steam reforming of bio-oil using carbon capture.

Image Credit: Alexander Limback/Shutterstock.com
Green hydrogen can be made from water electrolysis or biogenic fuel, and is a viable way to cut CO2 emissions. Steam reforming can transform bio-oil into hydrogen, which is considered a useful technique to improve bio-oil.
New developments in steam reforming techniques such as sorption enhancement and chemical looping may well be the catalyst for bringing hydrogen from biomass and bioenergy with carbon capture and storage (BECCS) into prospective energy markets.
SE-CLSR (sorption-enhanced chemical looping steam reforming) is an autothermal process that combines CLSR and SESR to create high-purity bio-oil with in-situ carbon capture.
This paper carried out techno-economic analyses of CO2 capture from bio-oil steam reforming and compared it to other options. This is particularly interesting owing to the possibility of negative emissions when utilizing a biogenic feedstock such as bio-oil.
Methodology
Teesside was chosen as the location for the case study since the region would undoubtedly be involved in prospective CO2 capture and storage (CCS), with CO2 being routed to empty North Sea oil fields. To ensure the integrity of the transit and storage infrastructure, a set of purity standards were imposed on the separated CO2.
Since there are no established CO2 purity standards, the ones employed in this study and given in Table 1 are based on those produced by CO2 Europipe project stakeholders. The specified CO2 pressure for supercritical phase transportation was anticipated to be 110 bar.
Table 1. CO2 specifications. Source: Reeve J, et al.
| Component |
Limit in CO2 |
| CO2 |
>95 vol% |
Ar
CH4
H2
N2
O2 |
Total noncondensables
<5 vol% |
| H2O |
No free water (<500 ppmv) |
The facility in question takes feedstock from several pyrolysis facilities and integrates economies of scale with actual bio-compound pyrolysis capacity.
The influence of scale on the techno-economics was studied using a range of 5000 to 100,000 Nm3 h−1 of bio-oil from 1 to 20 pyrolysis plants to feed a central reforming facility.
A proxy combination with a composition equivalent to a real palm empty fruit bunch bio-oil was used to simulate bio-oil. To lower the viscosity and density of the bio-oil, it was combined with 10 wt% methanol.
There was no detailed process design for desulfurization. Instead, order of magnitude estimations was utilized for techno-economic considerations based on information from Maples, such as the utilities shown in Table 2 and a single-point cost data shown in Table 3.
An association within the same paper was used to calculate hydrogen consumption for a particular wt% sulfur in the feed.
Table 2. Utilities consumption for desulfurization. Source: Reeve J, et al, 2022.
| Utility |
Requirement per m3 Bio-Oil/Methanol Feed |
| Power |
12.58 kWh |
| Steam |
42.79 kg |
| Fuel gas |
55.30 kWh |
The cost of the processes and comparator systems in the literature was compared using the levelized cost of hydrogen (LCOH). Table 3 lists the process units that were costed using this approach, together with the data from the relevant equations.
Table 3. Single point cost data for bare module cost. Source: Reeve J, et al, 2022.
| Unit |
Base Size |
Base Cost (mUSD) |
f |
Installation Factor |
Year |
Ref. |
| WGS |
15.6 Mmol h-1 CO + H2 |
36.9 |
0.85 |
1 |
2001 |
[37] |
| PSA |
9600 kmol h-1 throughput |
28 |
0.7 |
1.69 |
2001 |
[37] |
| CO2 capture (MDEA) |
62.59 kg s-1 CO2 captured |
104.2 |
0.8 |
- |
2017 |
[37] |
| CO2 compression and drying |
13 MW compressor power |
17.9 |
0.67 |
- |
2017 |
[18] |
| High temperature three-way valve |
2 m3 s-1 |
0.1695 |
0.6 |
- |
2014 |
[18] |
| HDS plant |
30,000 BPD |
16 |
0.65 |
- |
1991 |
[31] |
Based on catalyst weight, hourly space velocity and sorbent amount, the SE-CLSR research evaluated the cost of refractory-lined reactor vessels.
The sum of operating expenses, operational labor costs, utility costs, waste treatment costs, and raw materials costs is the total cost of manufacturing without depreciation (COMd).
Table 4 shows further assumptions produced for the calculation of COMd.
Table 4: Operating cost calculation assumptions. Source: Reeve J, et al, 2022.
| Materials |
| Bio-oil price |
0.2 USD kg-1 |
[41,42,43] |
| Methanol price |
0.37 USD kg-1 |
[44] |
| Reforming catalyst/oxygen carrier price |
20 USD kg-1 |
[45,46] |
| WGS catalyst price |
60 USD kg-1 |
[47] |
| CaO sorbent |
1.1 USD kg-1 |
[48] |
| WHSV for steam reforming |
1 h-1 |
[49] |
| GHSV for WGS |
3000 h-1 |
[45,50] |
| WHSV for reforming stage of SE-CLSR |
0.8 h-1 |
[51] |
| Reforming catalyst lifetime (C-SR) |
1 year |
Assumed |
| Oxygen carrier lifetime (SE-CLSR) |
2 years |
Assumed |
| WGS catalyst lifetime |
5 years |
[52] |
| CaO sorbent lifetime |
2 years |
Assumed |
| MDEA solvent a |
0.04 mUSD/year per kgCO2/s |
[18] |
| Waste treatment |
| Waste water disposal |
0.538 USD t-1 |
[53] |
| Catalyst recovery |
-0.11 USD/kg |
[54] |
| Utilities |
| Process water |
2 USD m-3 |
[55] |
| Electricity (purchase) |
100 USD MWh-1 |
[14] |
| Electricity (export) |
50 USD MWh-1 |
[14] |
| Steam (purchase/export) |
20.9 USD MWh-1 |
Calculated b |
| Natural gas |
25 USD MWh-1 |
[14] |
| Cooling water |
0.4 USD m-3 |
[55] |
| Other assumptions |
| Plant availability |
360 days per year |
- |
| Conversion GBP to USD |
1.29 |
[56] |
| Conversion EUR to USD |
1.13 |
[56] |
| Labour cost for workers in UK industry |
GBP 40,000 per year |
[57] |
| Shifts worked per worker per week |
5 |
- |
| Shifts per day |
3 |
- |
| Weeks worked per year |
47 |
- |
a MDEA solvent cost estimated from [18] prorated to process size. b Based on natural gas boiler with 90% efficiency [18].
RGibbs reactors were utilized to mimic the reforming process in all models. The adiabatic RGibbs blocks were employed in the SE-CLSR model, whereas REquil reactors were utilized in the WGS model.
Due to its packed bed structure, SE-CLSR reactors are complicated to model. The process flow diagram is shown in Figure 1a, and the temperature-pressure diagram is shown in Figure 1b.
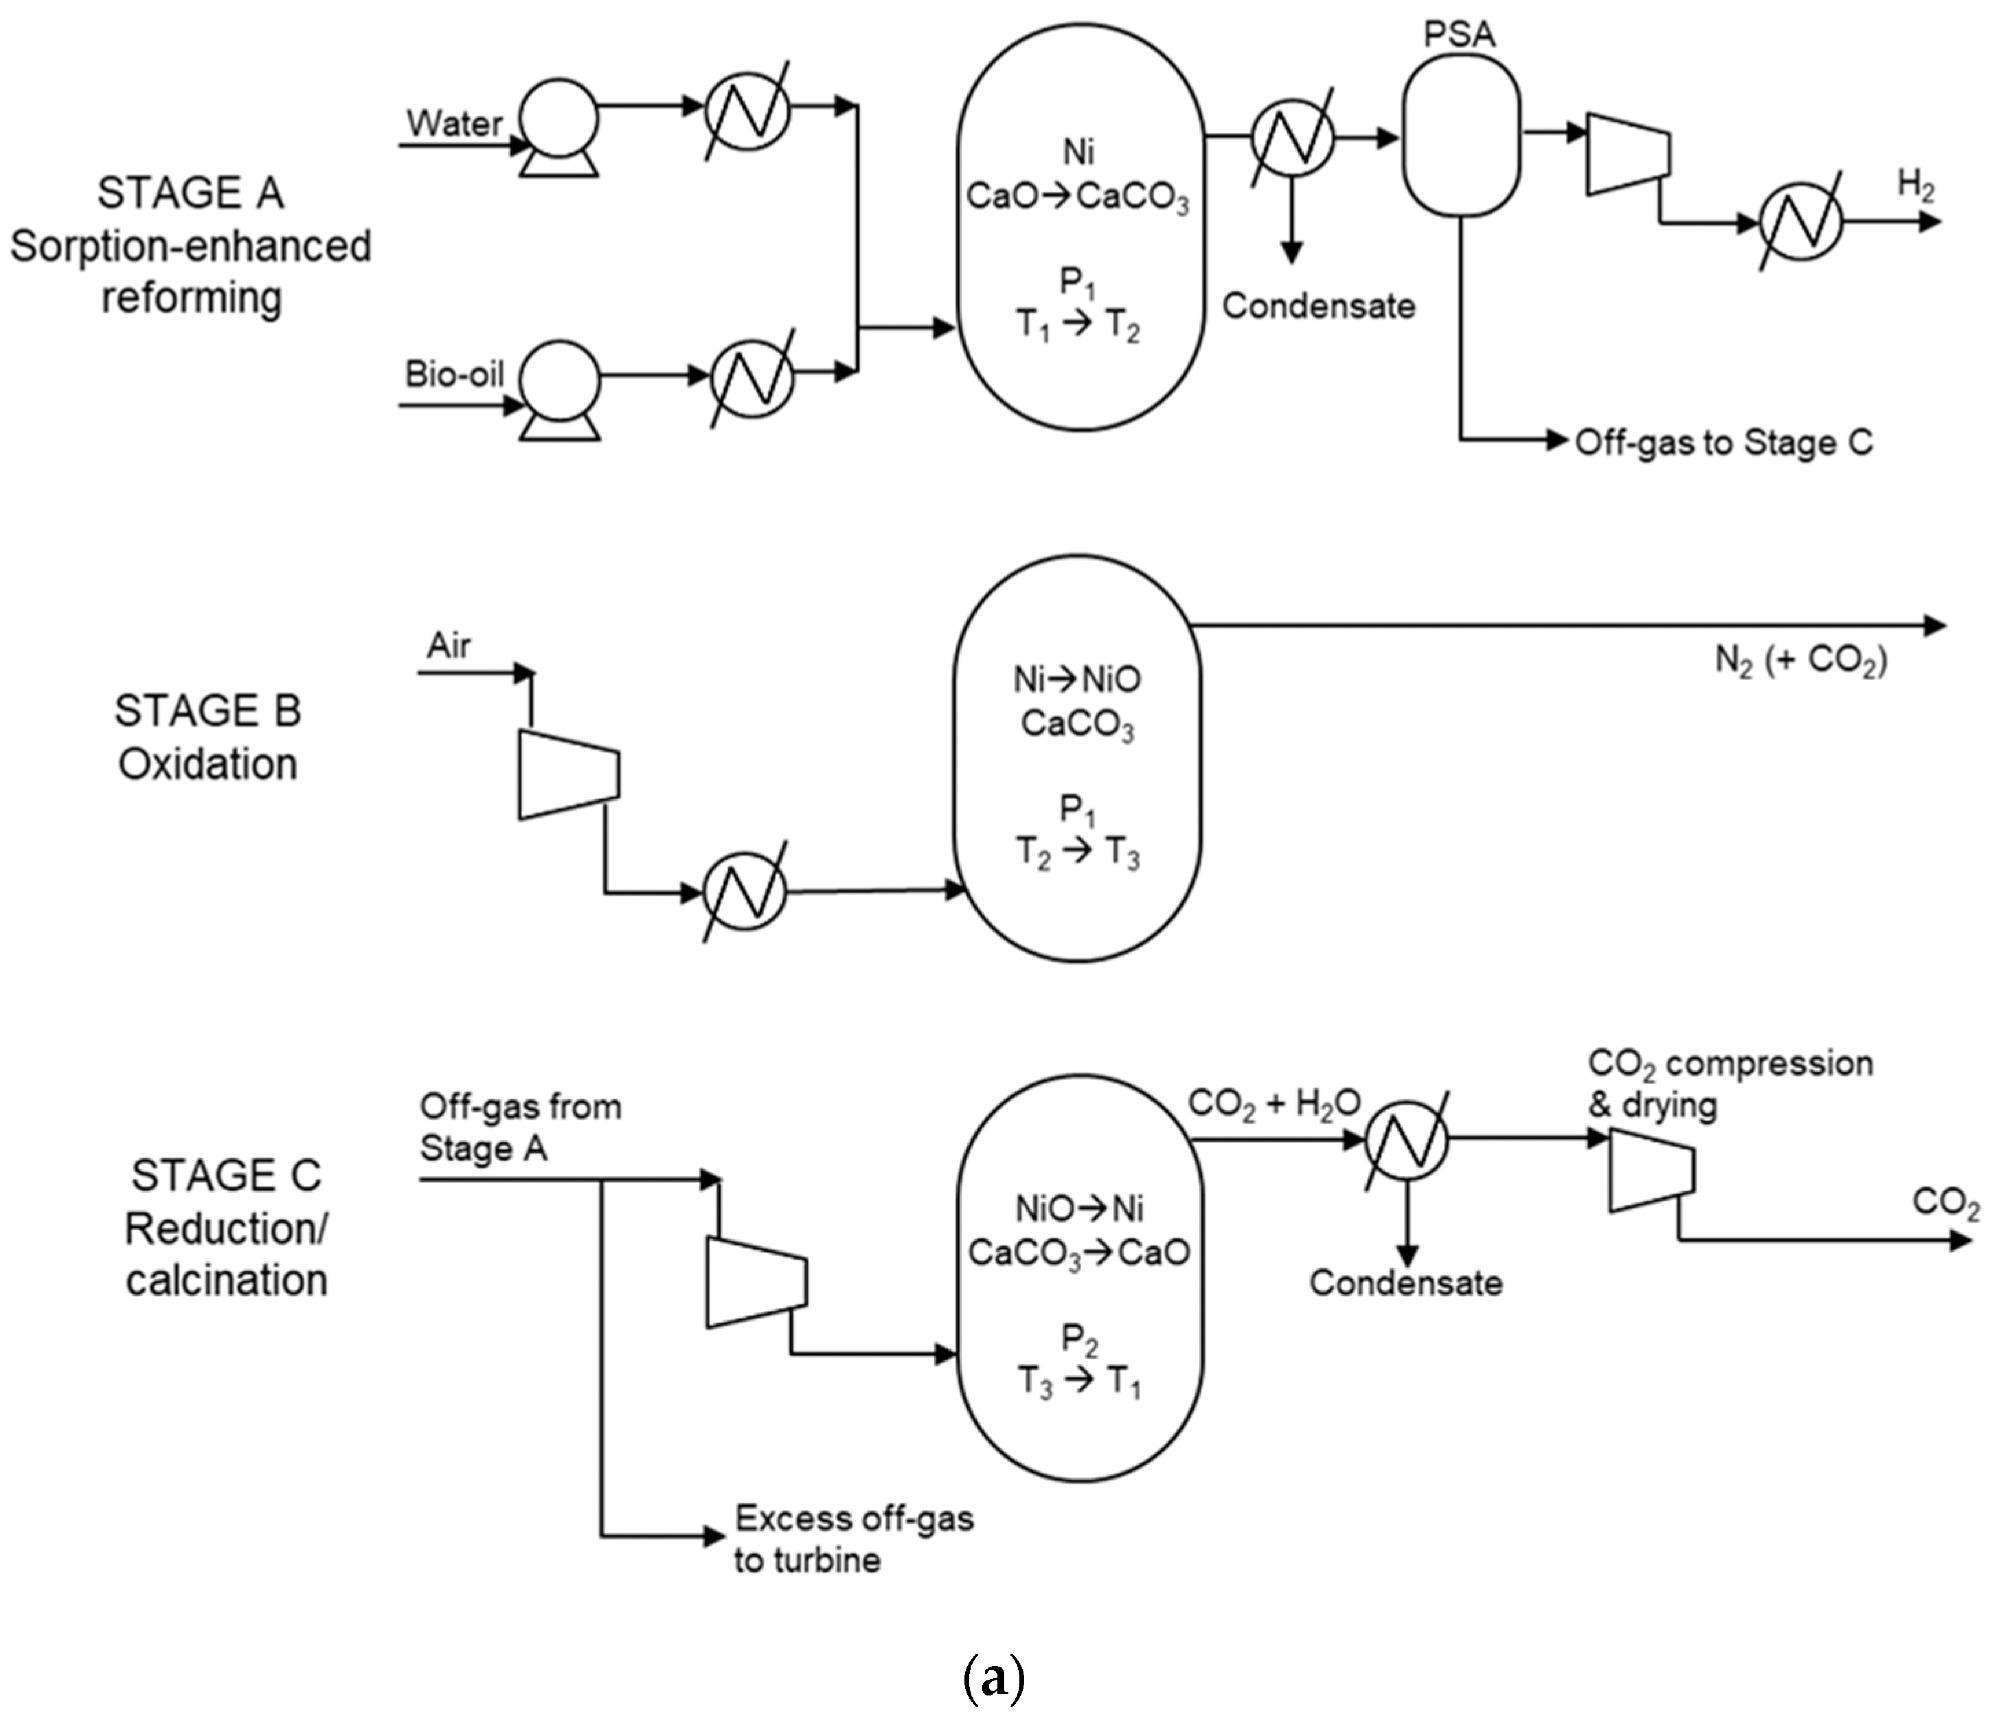
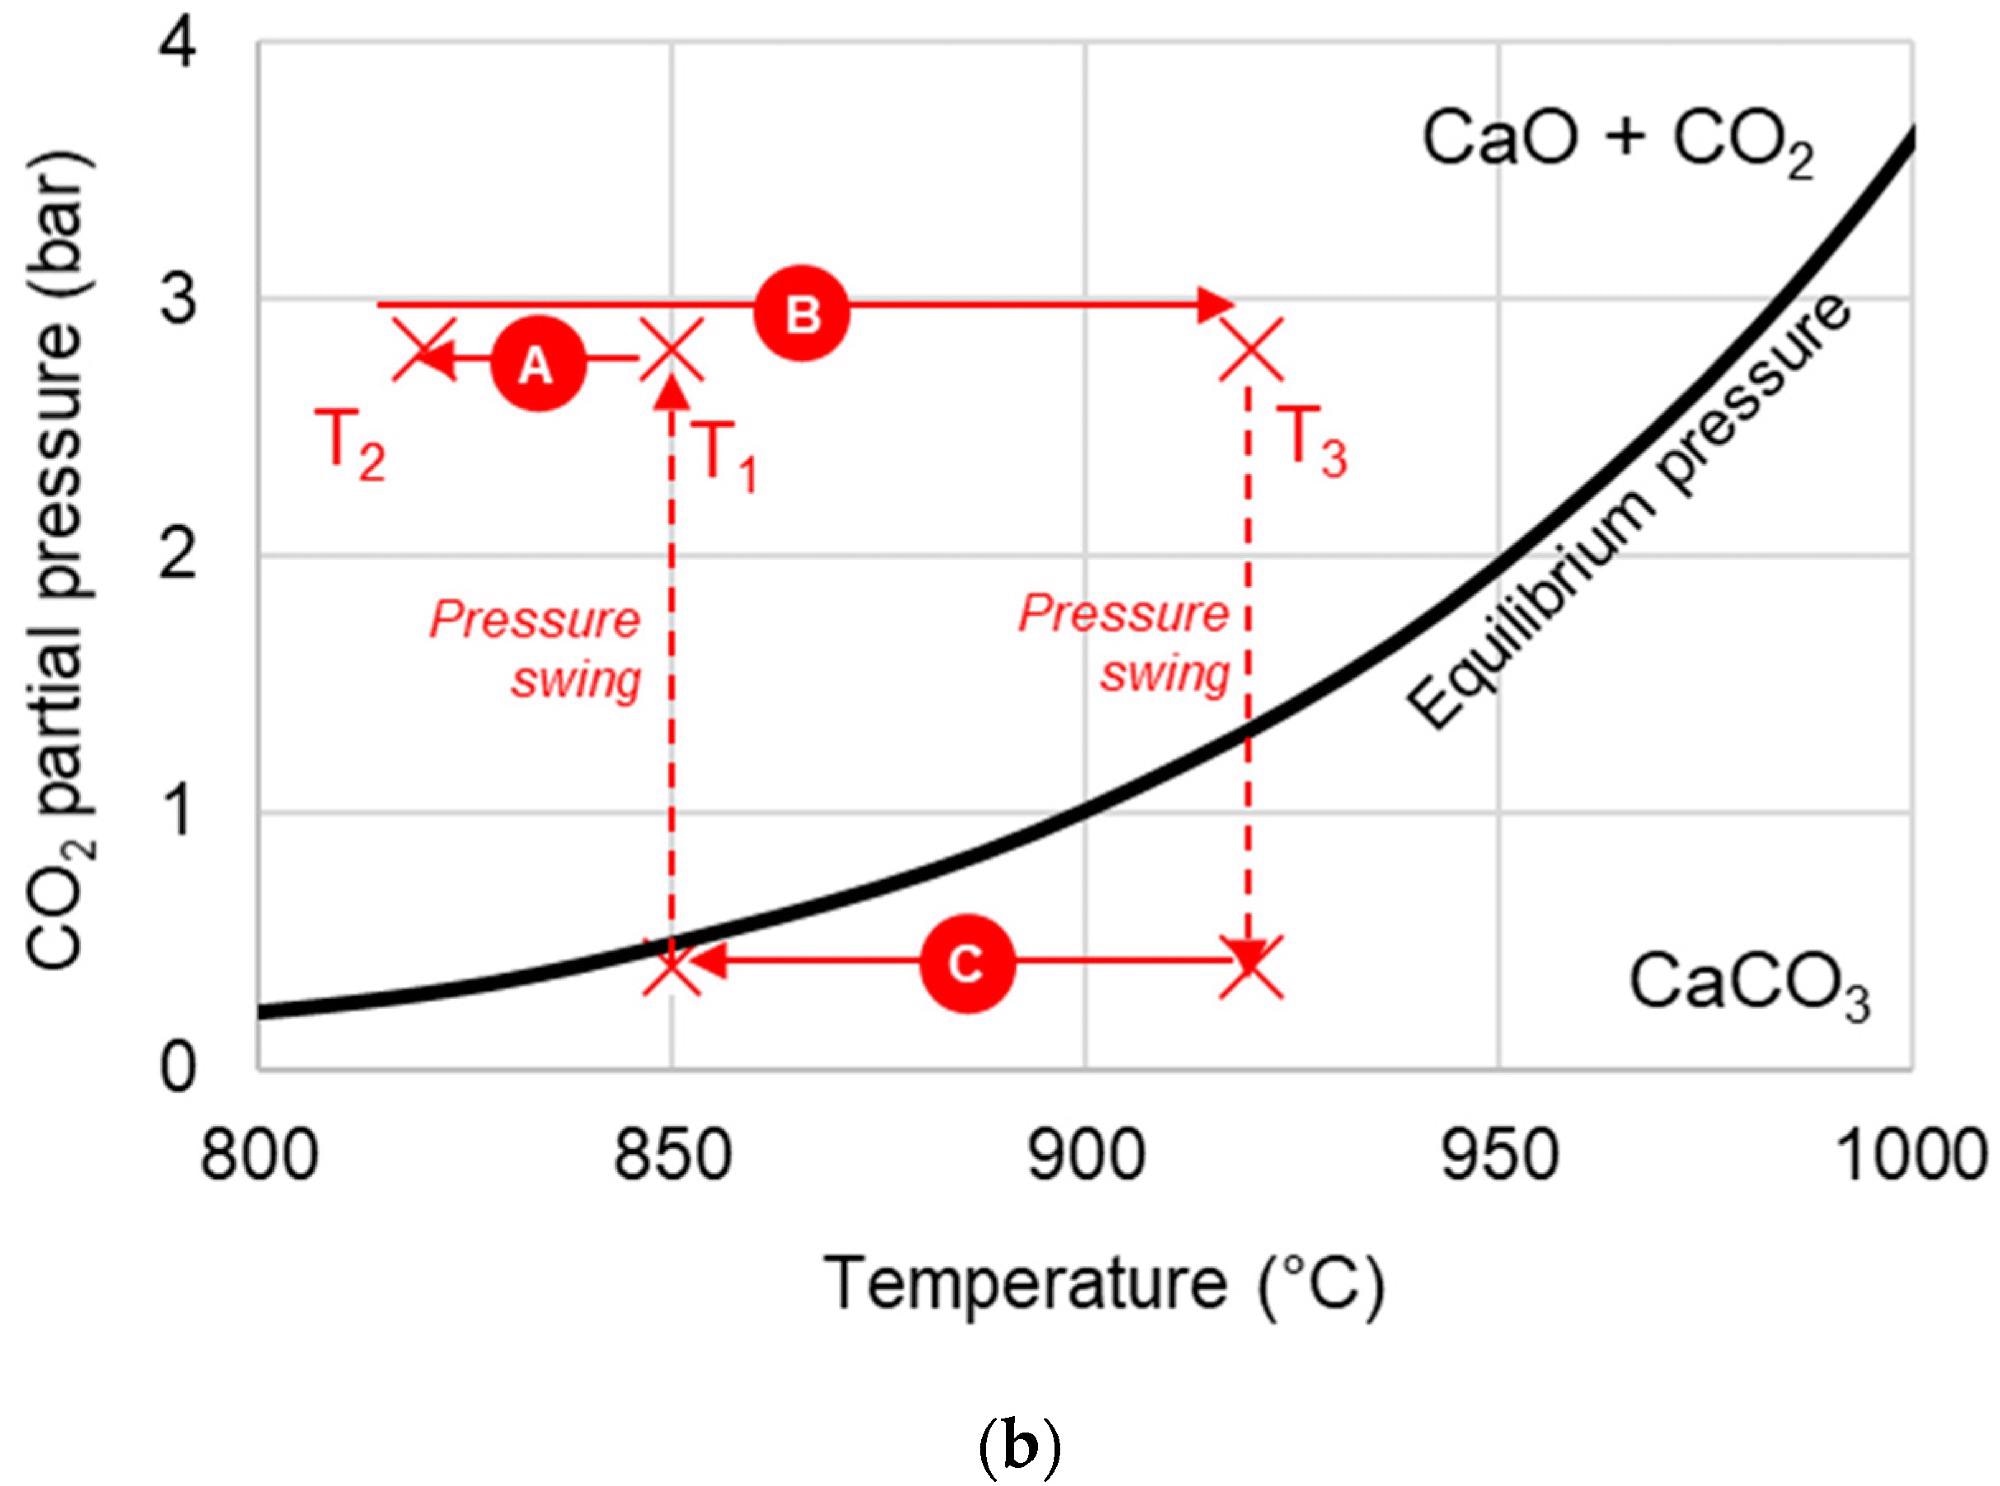
Figure 1. (a) Simplified process flow diagram of bio-oil SE-CLSR. (b) Example SE-CLSR operating conditions on CO2 equilibrium partial-pressure diagram. CaO/CO2 equilibrium properties from. Image Credit: Reeve, J, et al., 2022
Each stage of the gas switching process is represented by a distinct reactor block in Aspen Plus, and solids are copied as inputs to the next stage using transfer blocks. This method replicates solids retention in the same reactor, similar to a semi-batch process.
Separator blocks were utilized to imitate the PSA, which recovered 90% of the H2, and the absorption-based capture process, which recovered 95% of the CO2.
Figure 2, Figure 3, and Figure 4 show the process flow diagrams for the Aspen Plus models for C-SR sans CO2 capture, C-SR with CO2 capture, and the SE-CLSR process respectively.
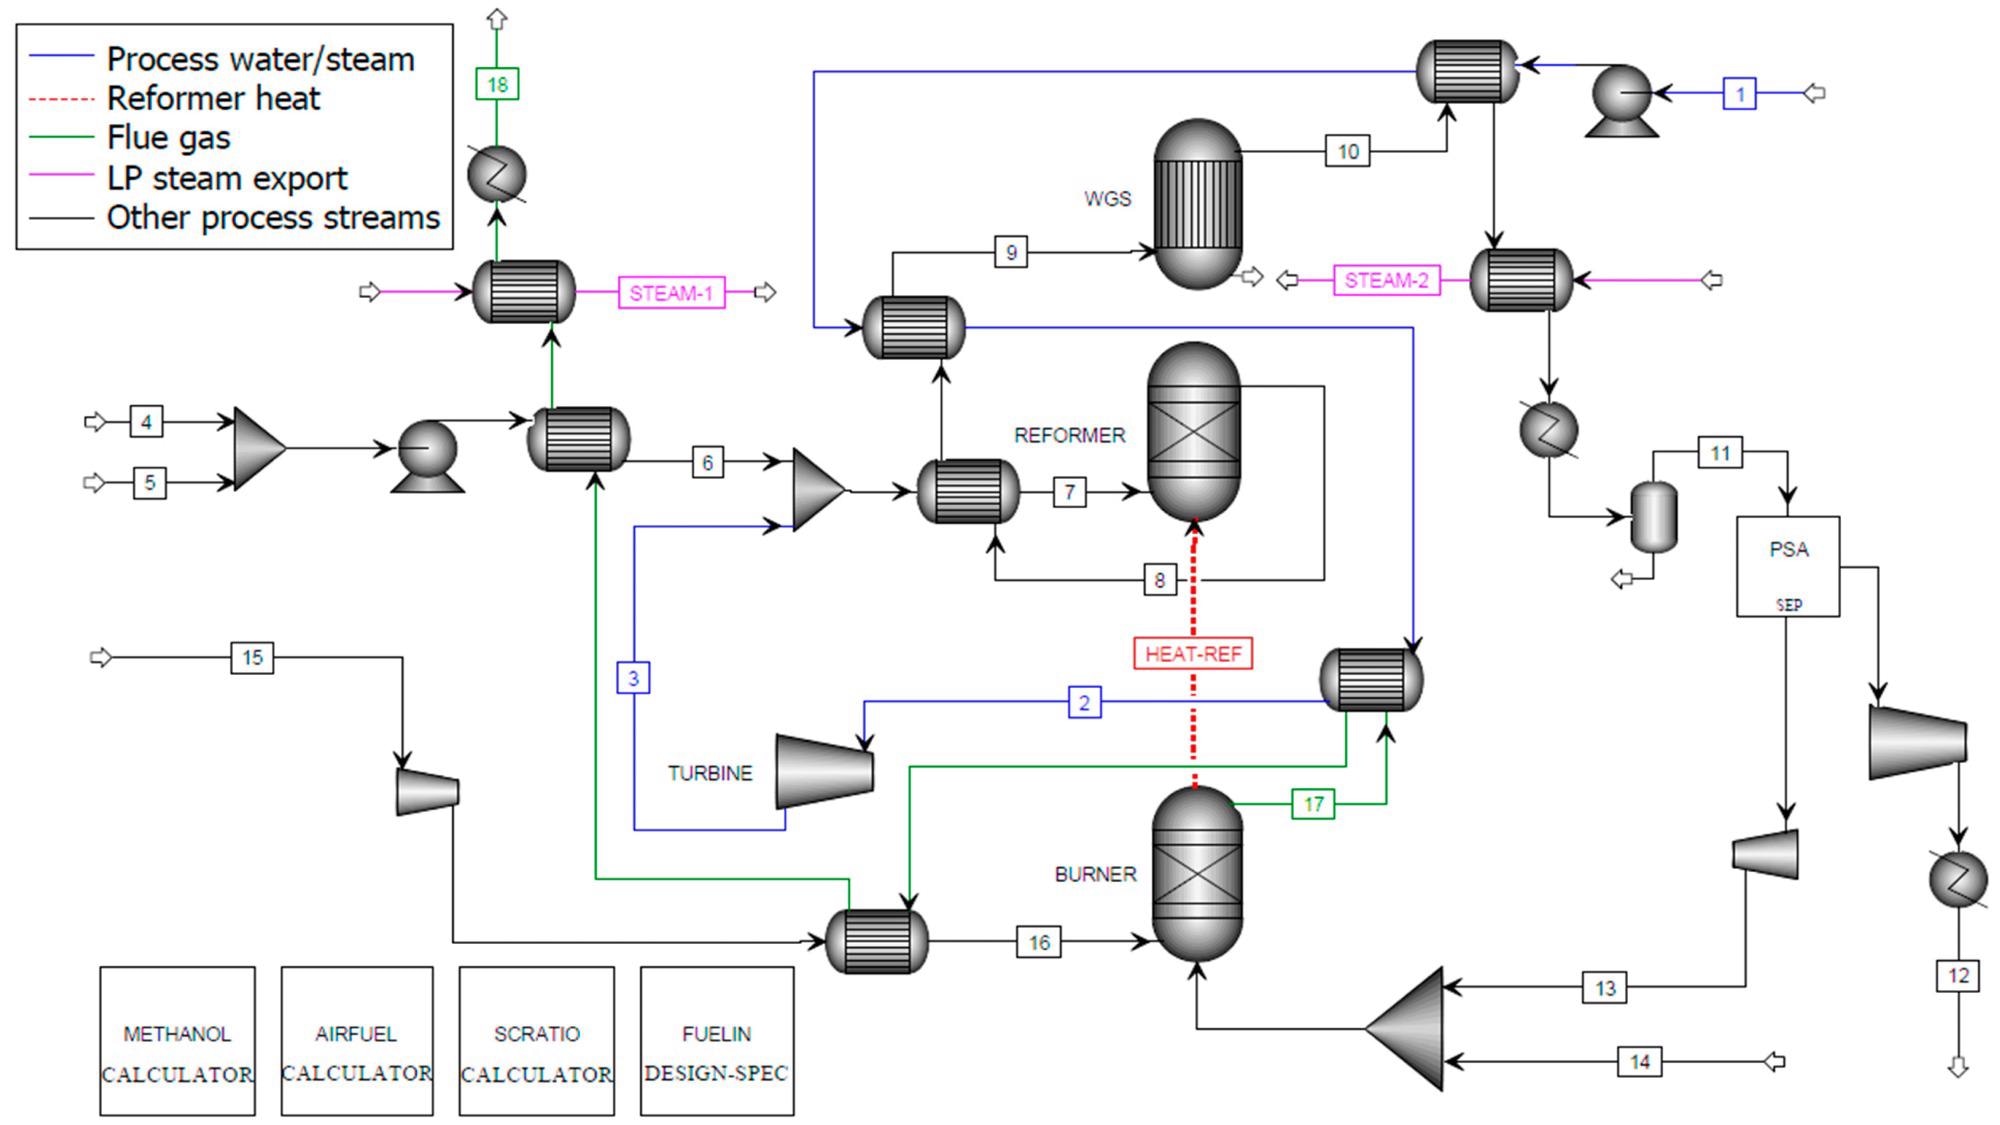
Figure 2. Aspen Plus flowsheet for C-SR of bio-oil without CO2 capture. Image Credit: Reeve, J, et al., 2022
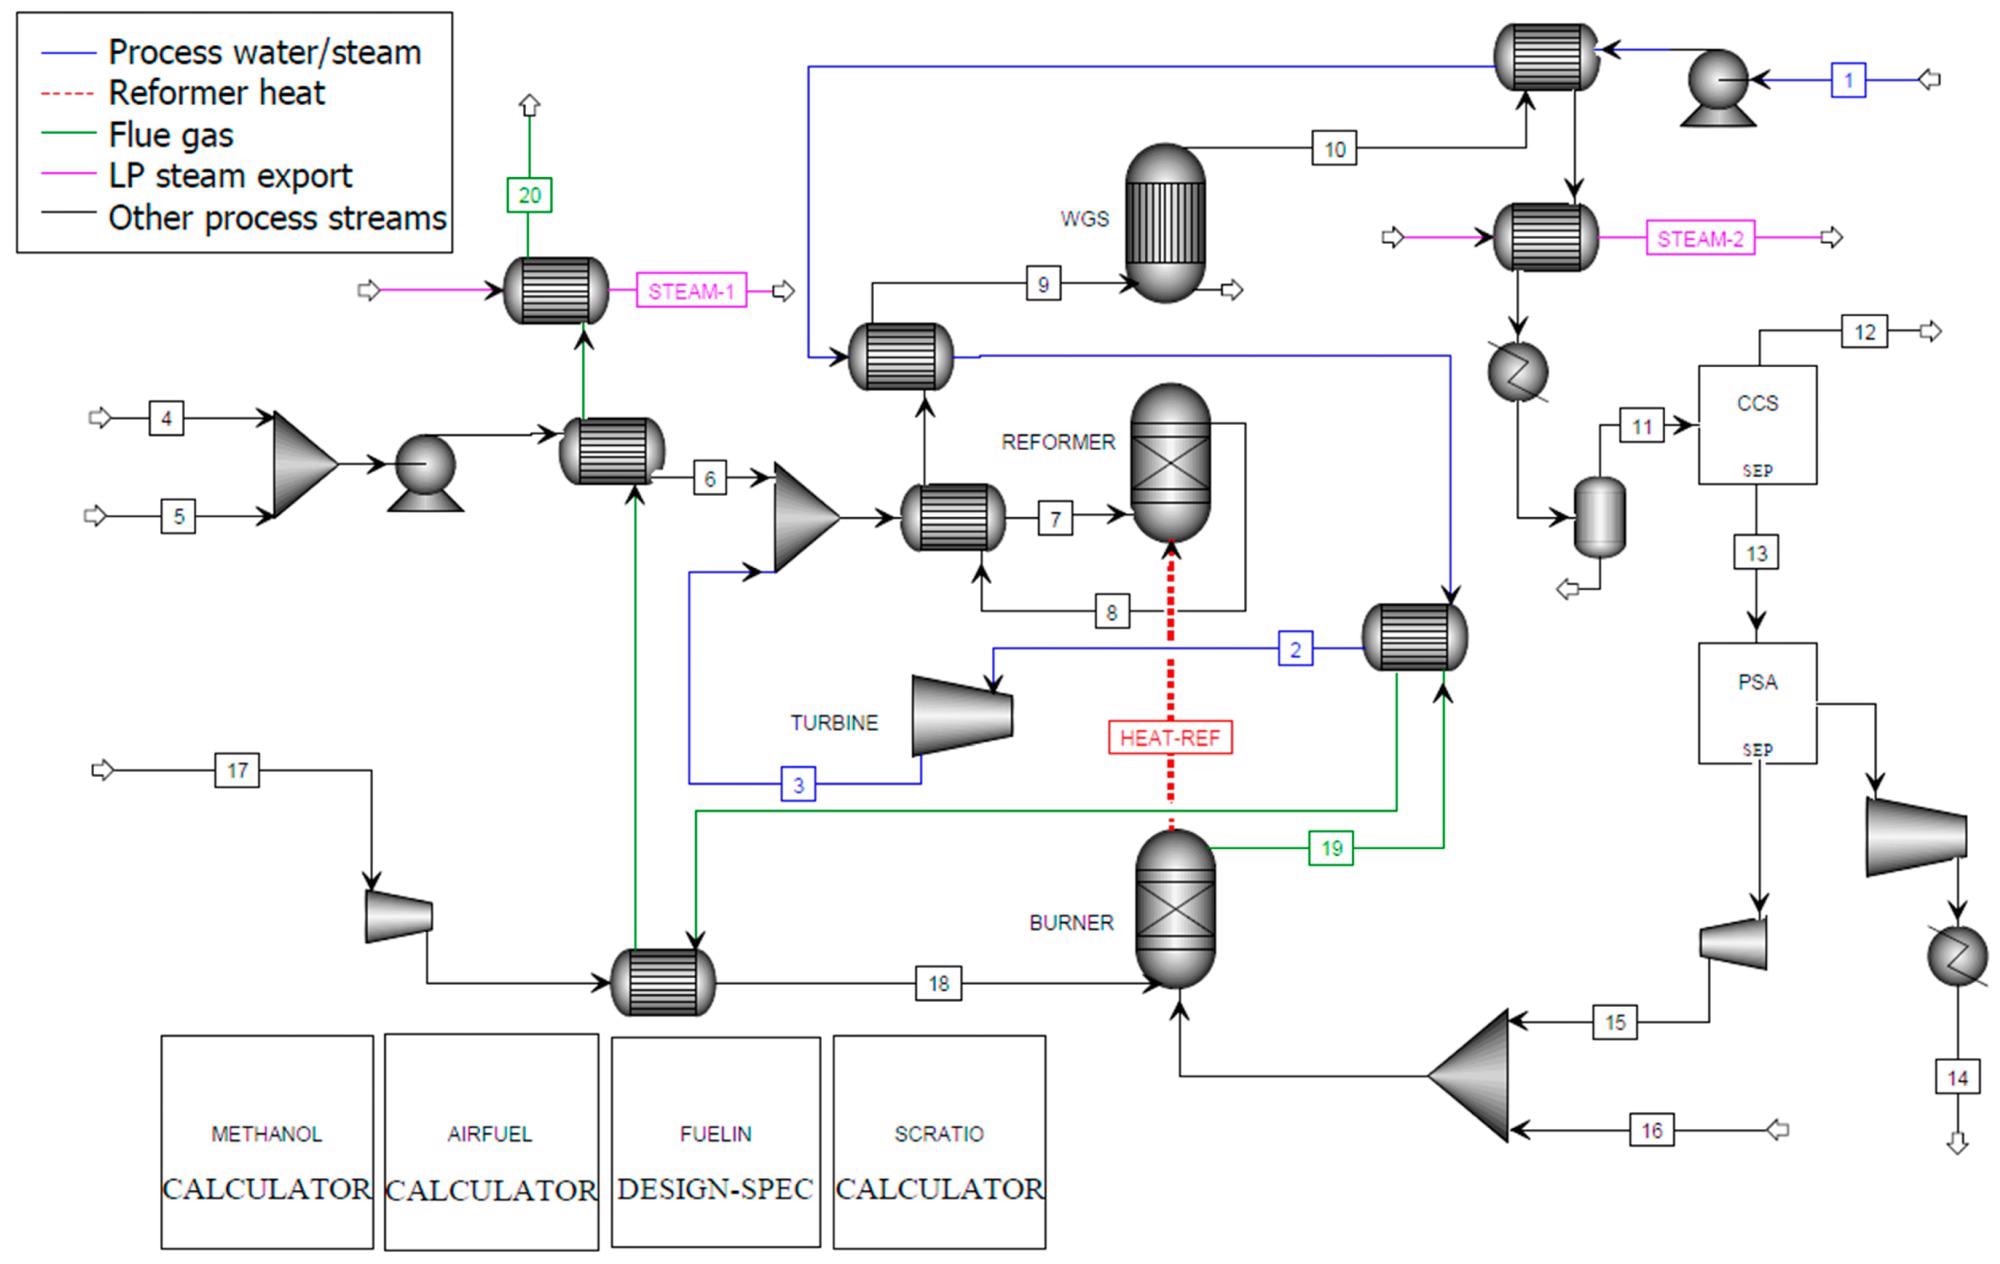
Figure 3. Aspen Plus flowsheet for C-SR of bio-oil with CO2 capture. Image Credit: Reeve, J, et al., 2022
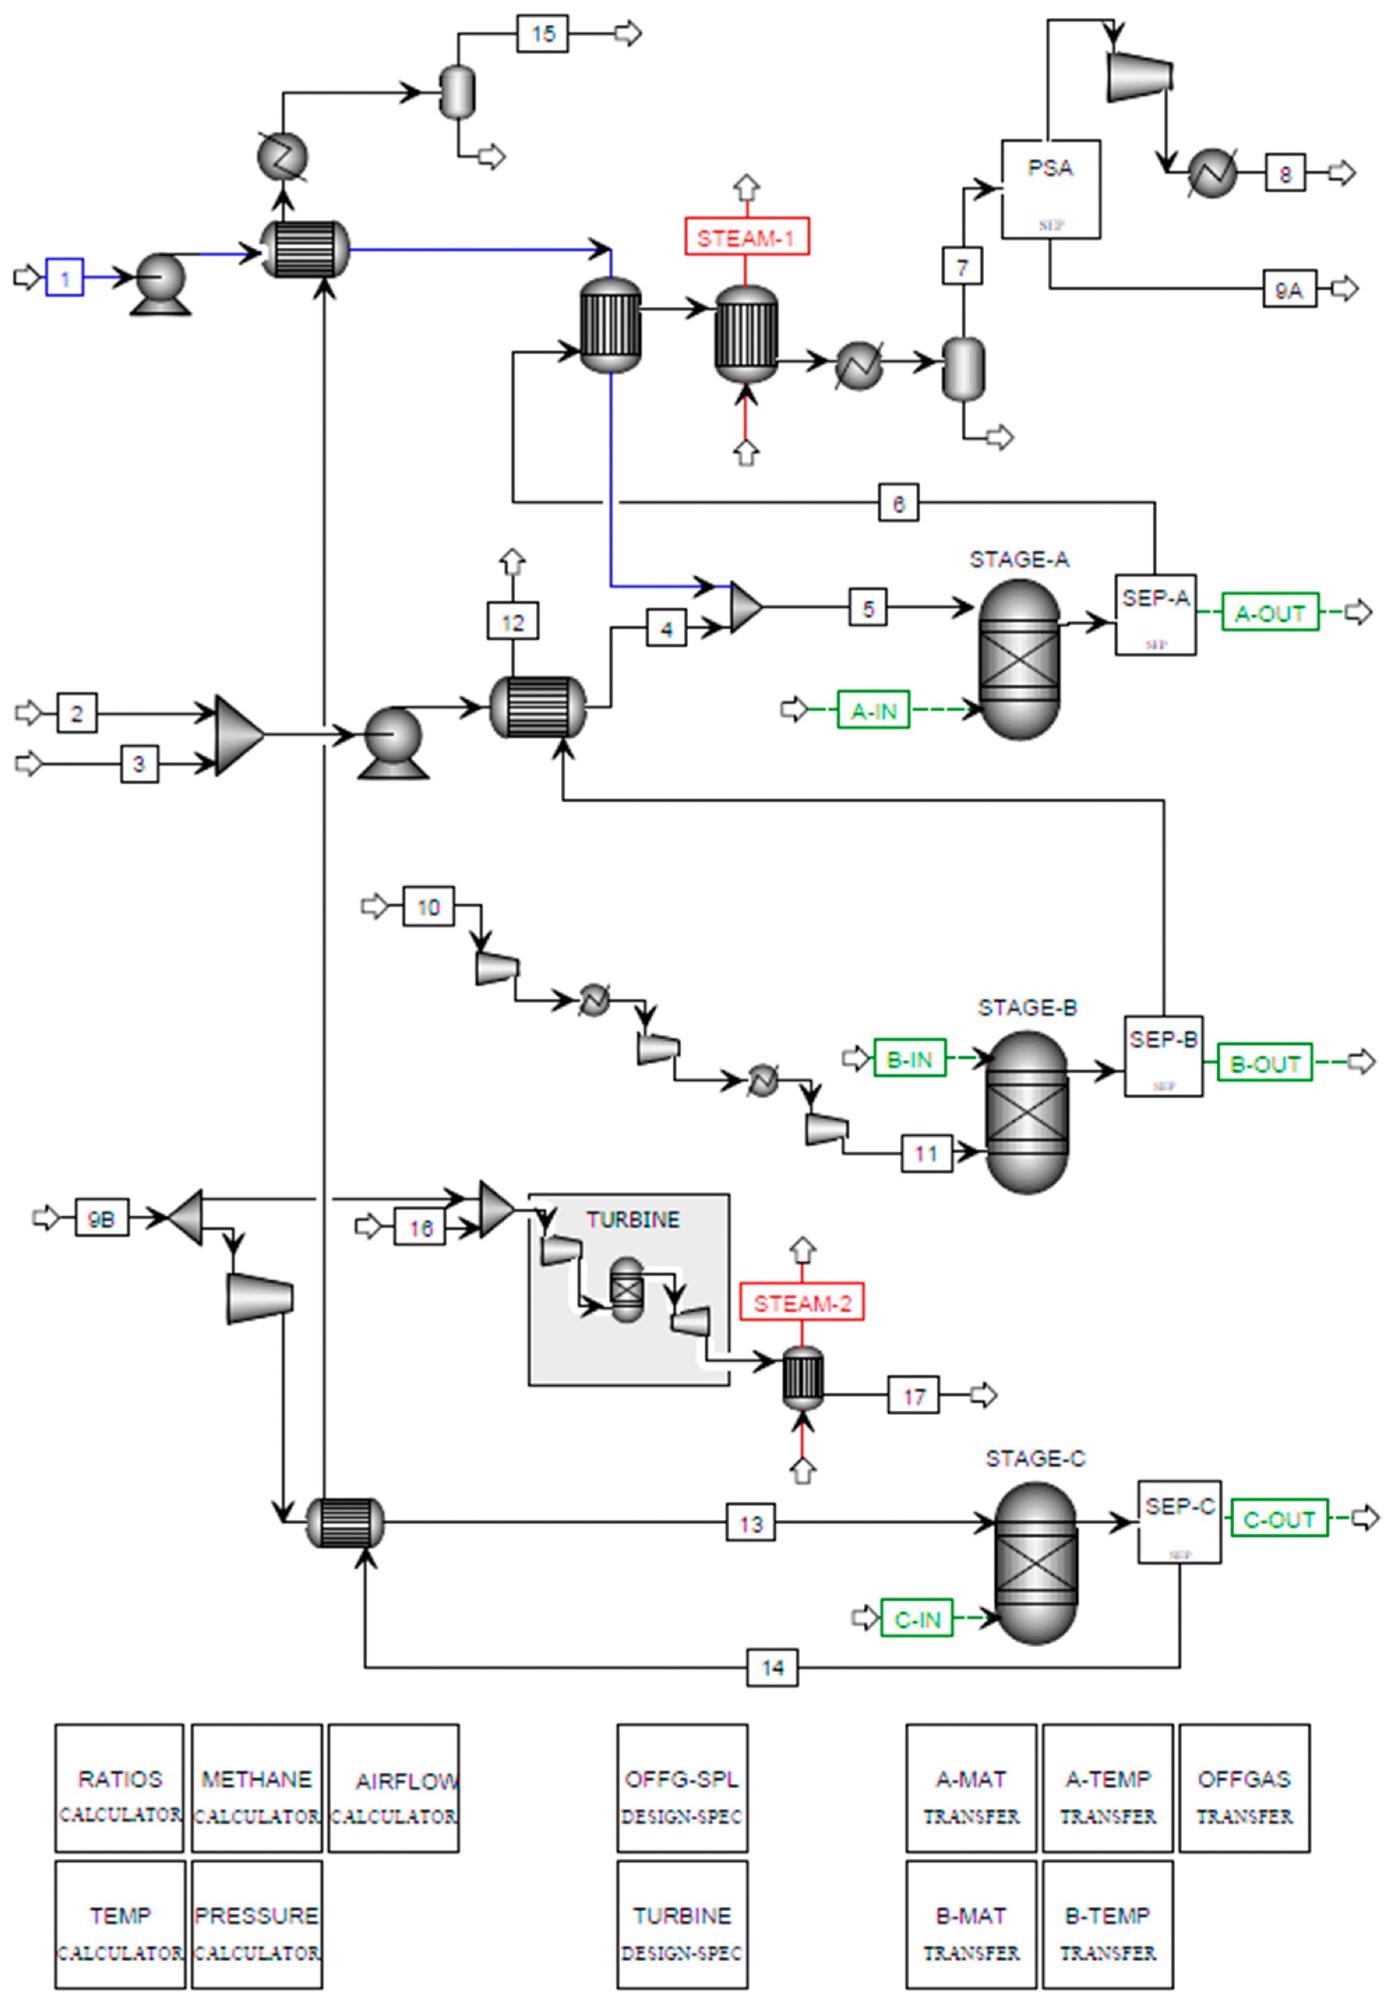
Figure 4. Aspen Plus flowsheet for SE-CLSR of bio-oil. Image Credit: Reeve, J, et al., 2022
Results
The Aspen Plus process simulation provides sensitivity analysis for numerous process parameters. These findings were utilized to choose a design foundation for a more in-depth economic study.
Table 5 lists the critical conditions determined by the sensitivity analysis.
Table 5. Design basis for economic comparisons. Source: Reeve, J, et al.
| |
C-SR |
C-SR-CCS |
SE-CLSR |
| Reformer pressure (bar) |
30 |
30 |
20 |
| Reformer temperature (°C) |
900 |
900 |
850 |
| S/C ratio |
5 |
5 |
2 |
| NiO/C ratio |
- |
- |
0.7 |
Due to the sheer complicated influence of S/C on operation, the effect of altering S/C on LCOH at various scales was studied and is shown in Figure 5. It reveals that the LCOH difference between S/C 3 and 5 situations is quite minimal.
This occurs as the higher costs of producing more steam are countered by higher H2 yields and boosted by the possibility of steam export (Figure 5b). However, at S/C 7, steam generation costs are significantly higher, resulting in the LCOH rise seen in Figure 5.
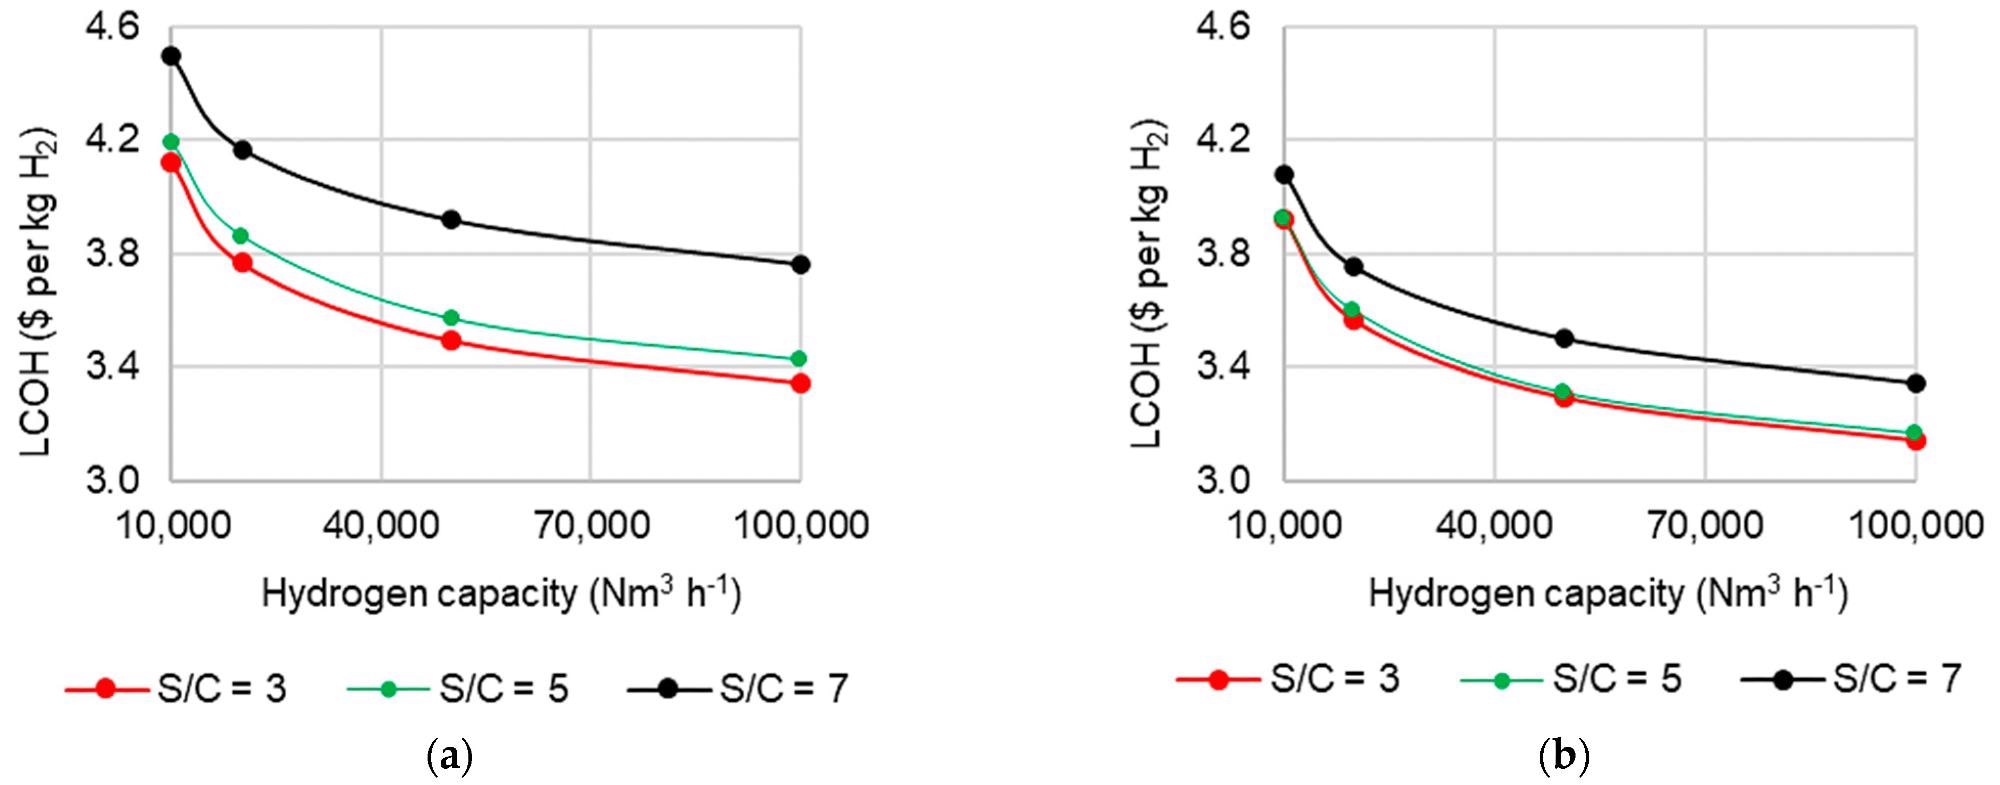
Figure 5. Effect of S/C ratio and capacity on levelized cost of hydrogen in C-SR at 30 bar and 900 °C (a) without steam export and (b) with steam export. Image Credit: Reeve, J, et al., 2022
Figure 6 shows the results of fixed capital, cost of production, and LCOH versus capacity.
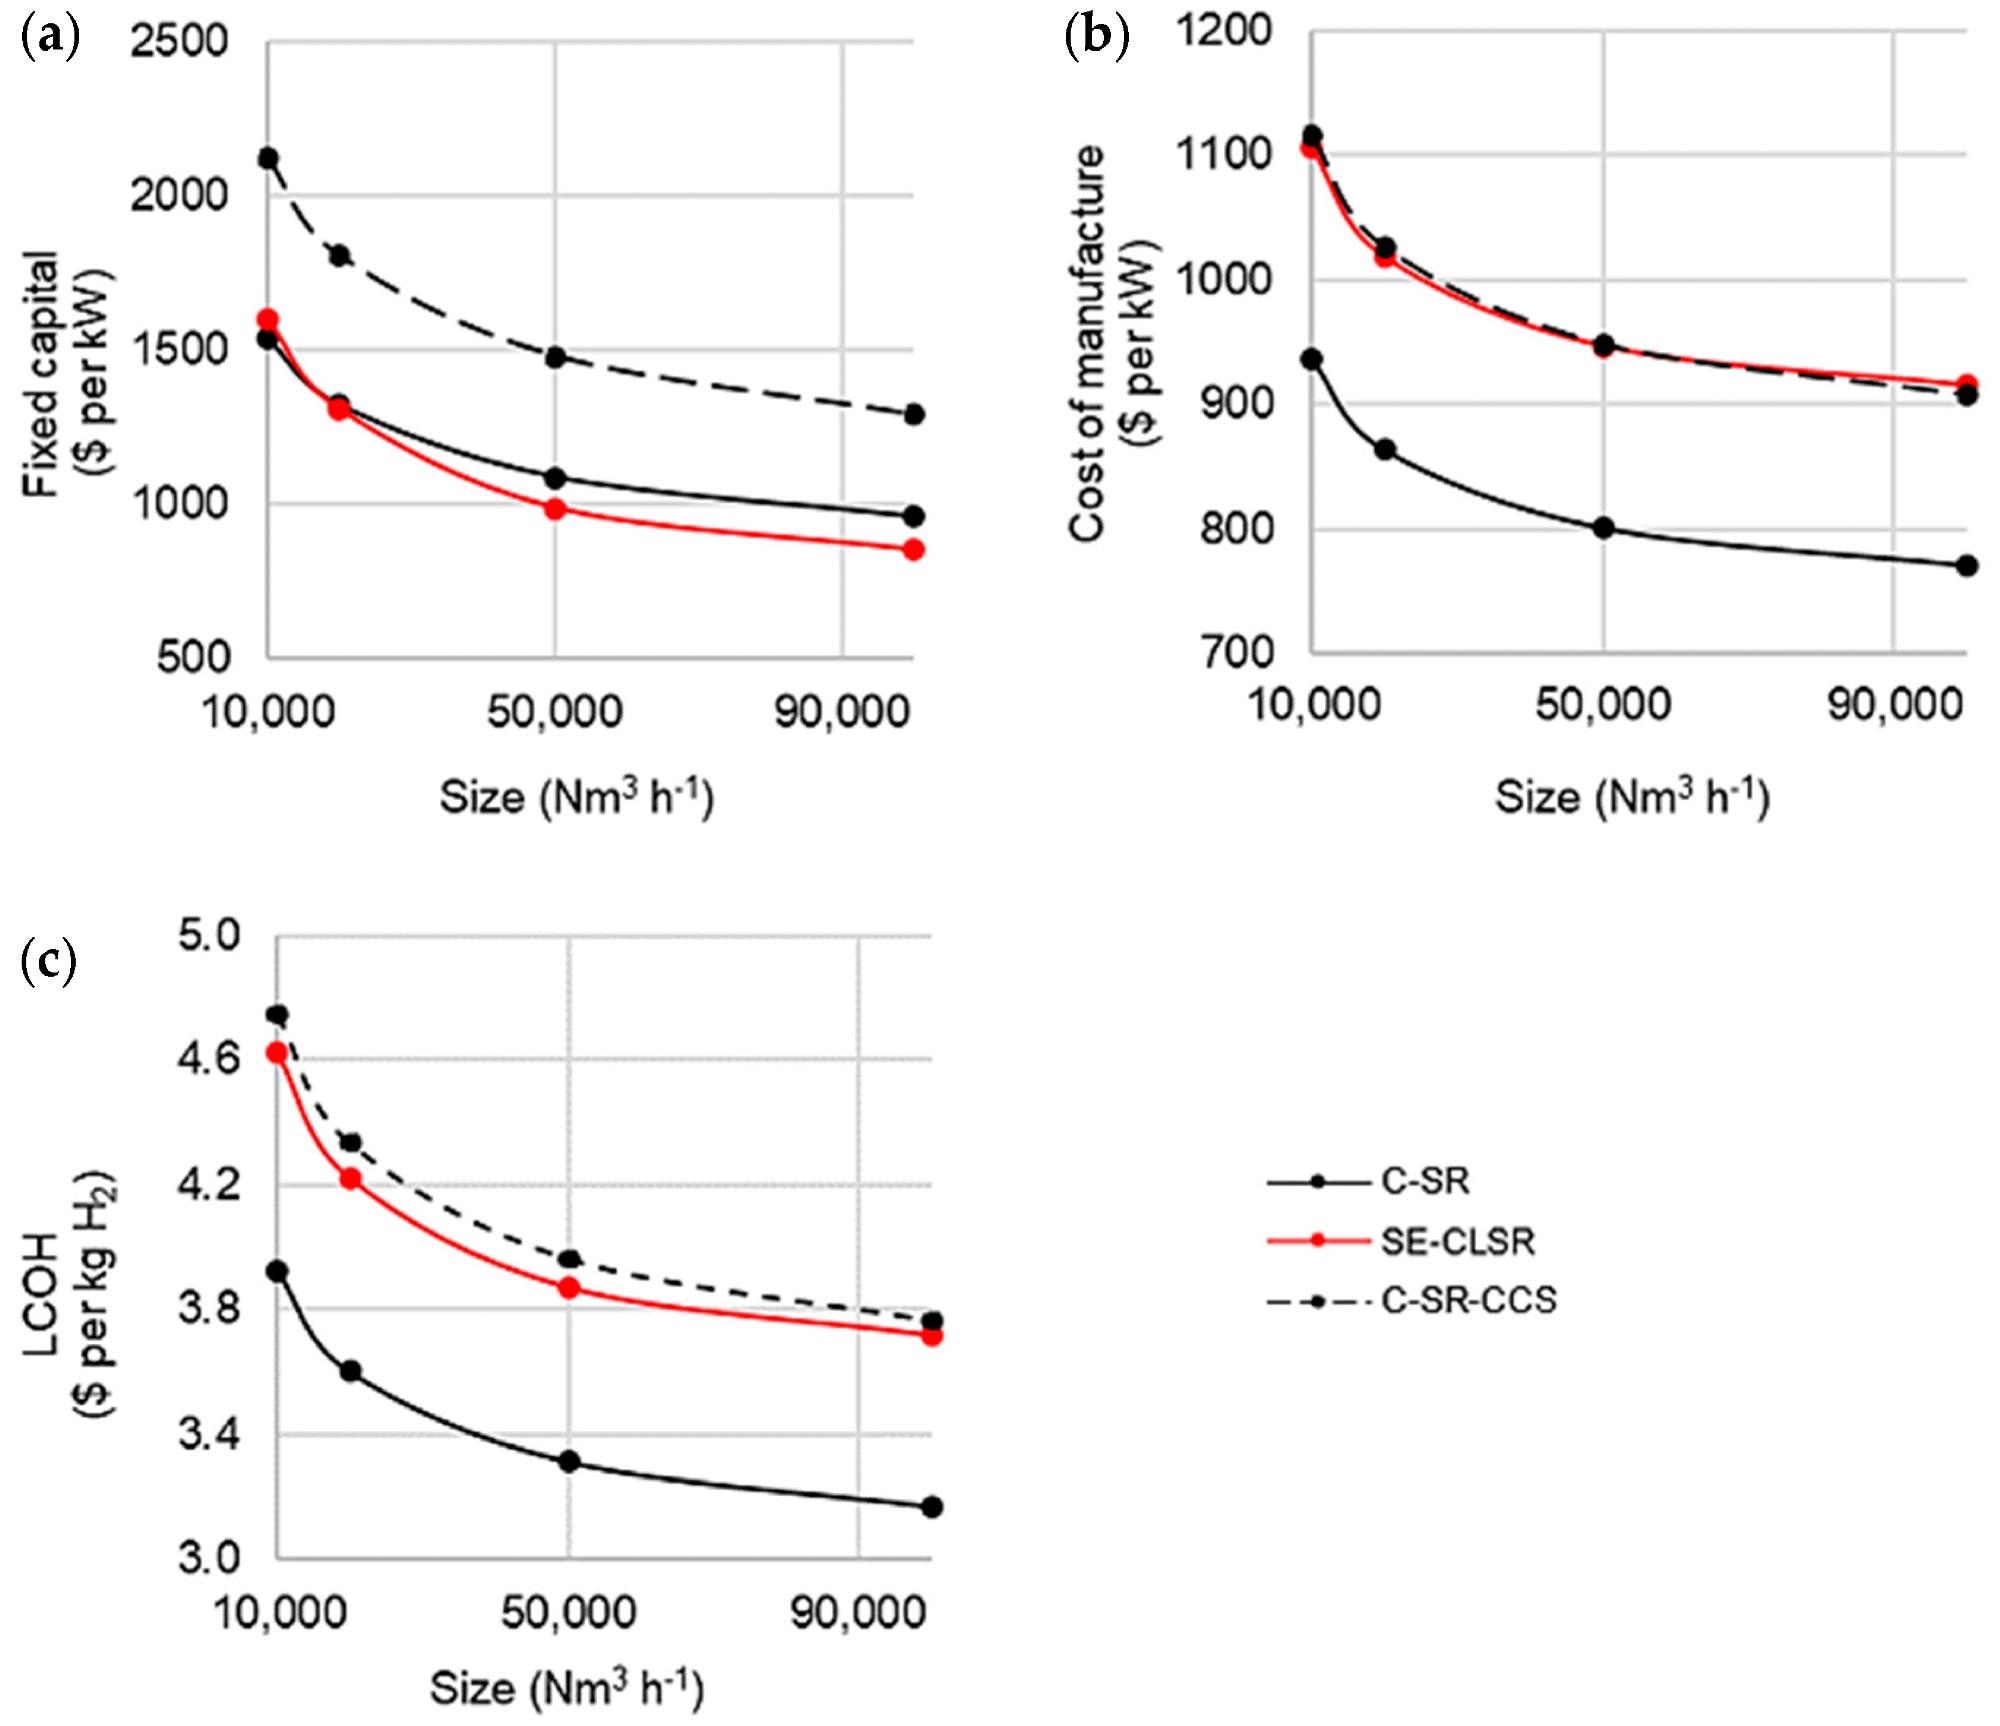
Figure 6. Cost analysis of base case C-SR and SE-CLSR processes with steam export: (a) fixed capital costs, (b) cost of manufacture, and (c) LCOH. Image Credit: Grasham, O, et al., 2022
For C-SR-CCS and SE-CLSR, the bare module and manufacturing costs have been broken down further for understanding, as shown in Figure 7. The PSA is the most expensive module in both processes, accounting for 28% and 41% of overall costs for C-SR-CCS and SE-CLSR, respectively.
The CO2 collection unit for C-SR-CCS is increased by 25%. This raises the total cost of gas separation in C-SR-CCS (PSA plus CO2 collection) to 53% of the total, whereas gas separation in SE-CLSR does not require an equivalent CO2 capture unit.
SE-three-way CLSR’s valves contribute a substantial amount of money, accounting for 13% of the overall cost.
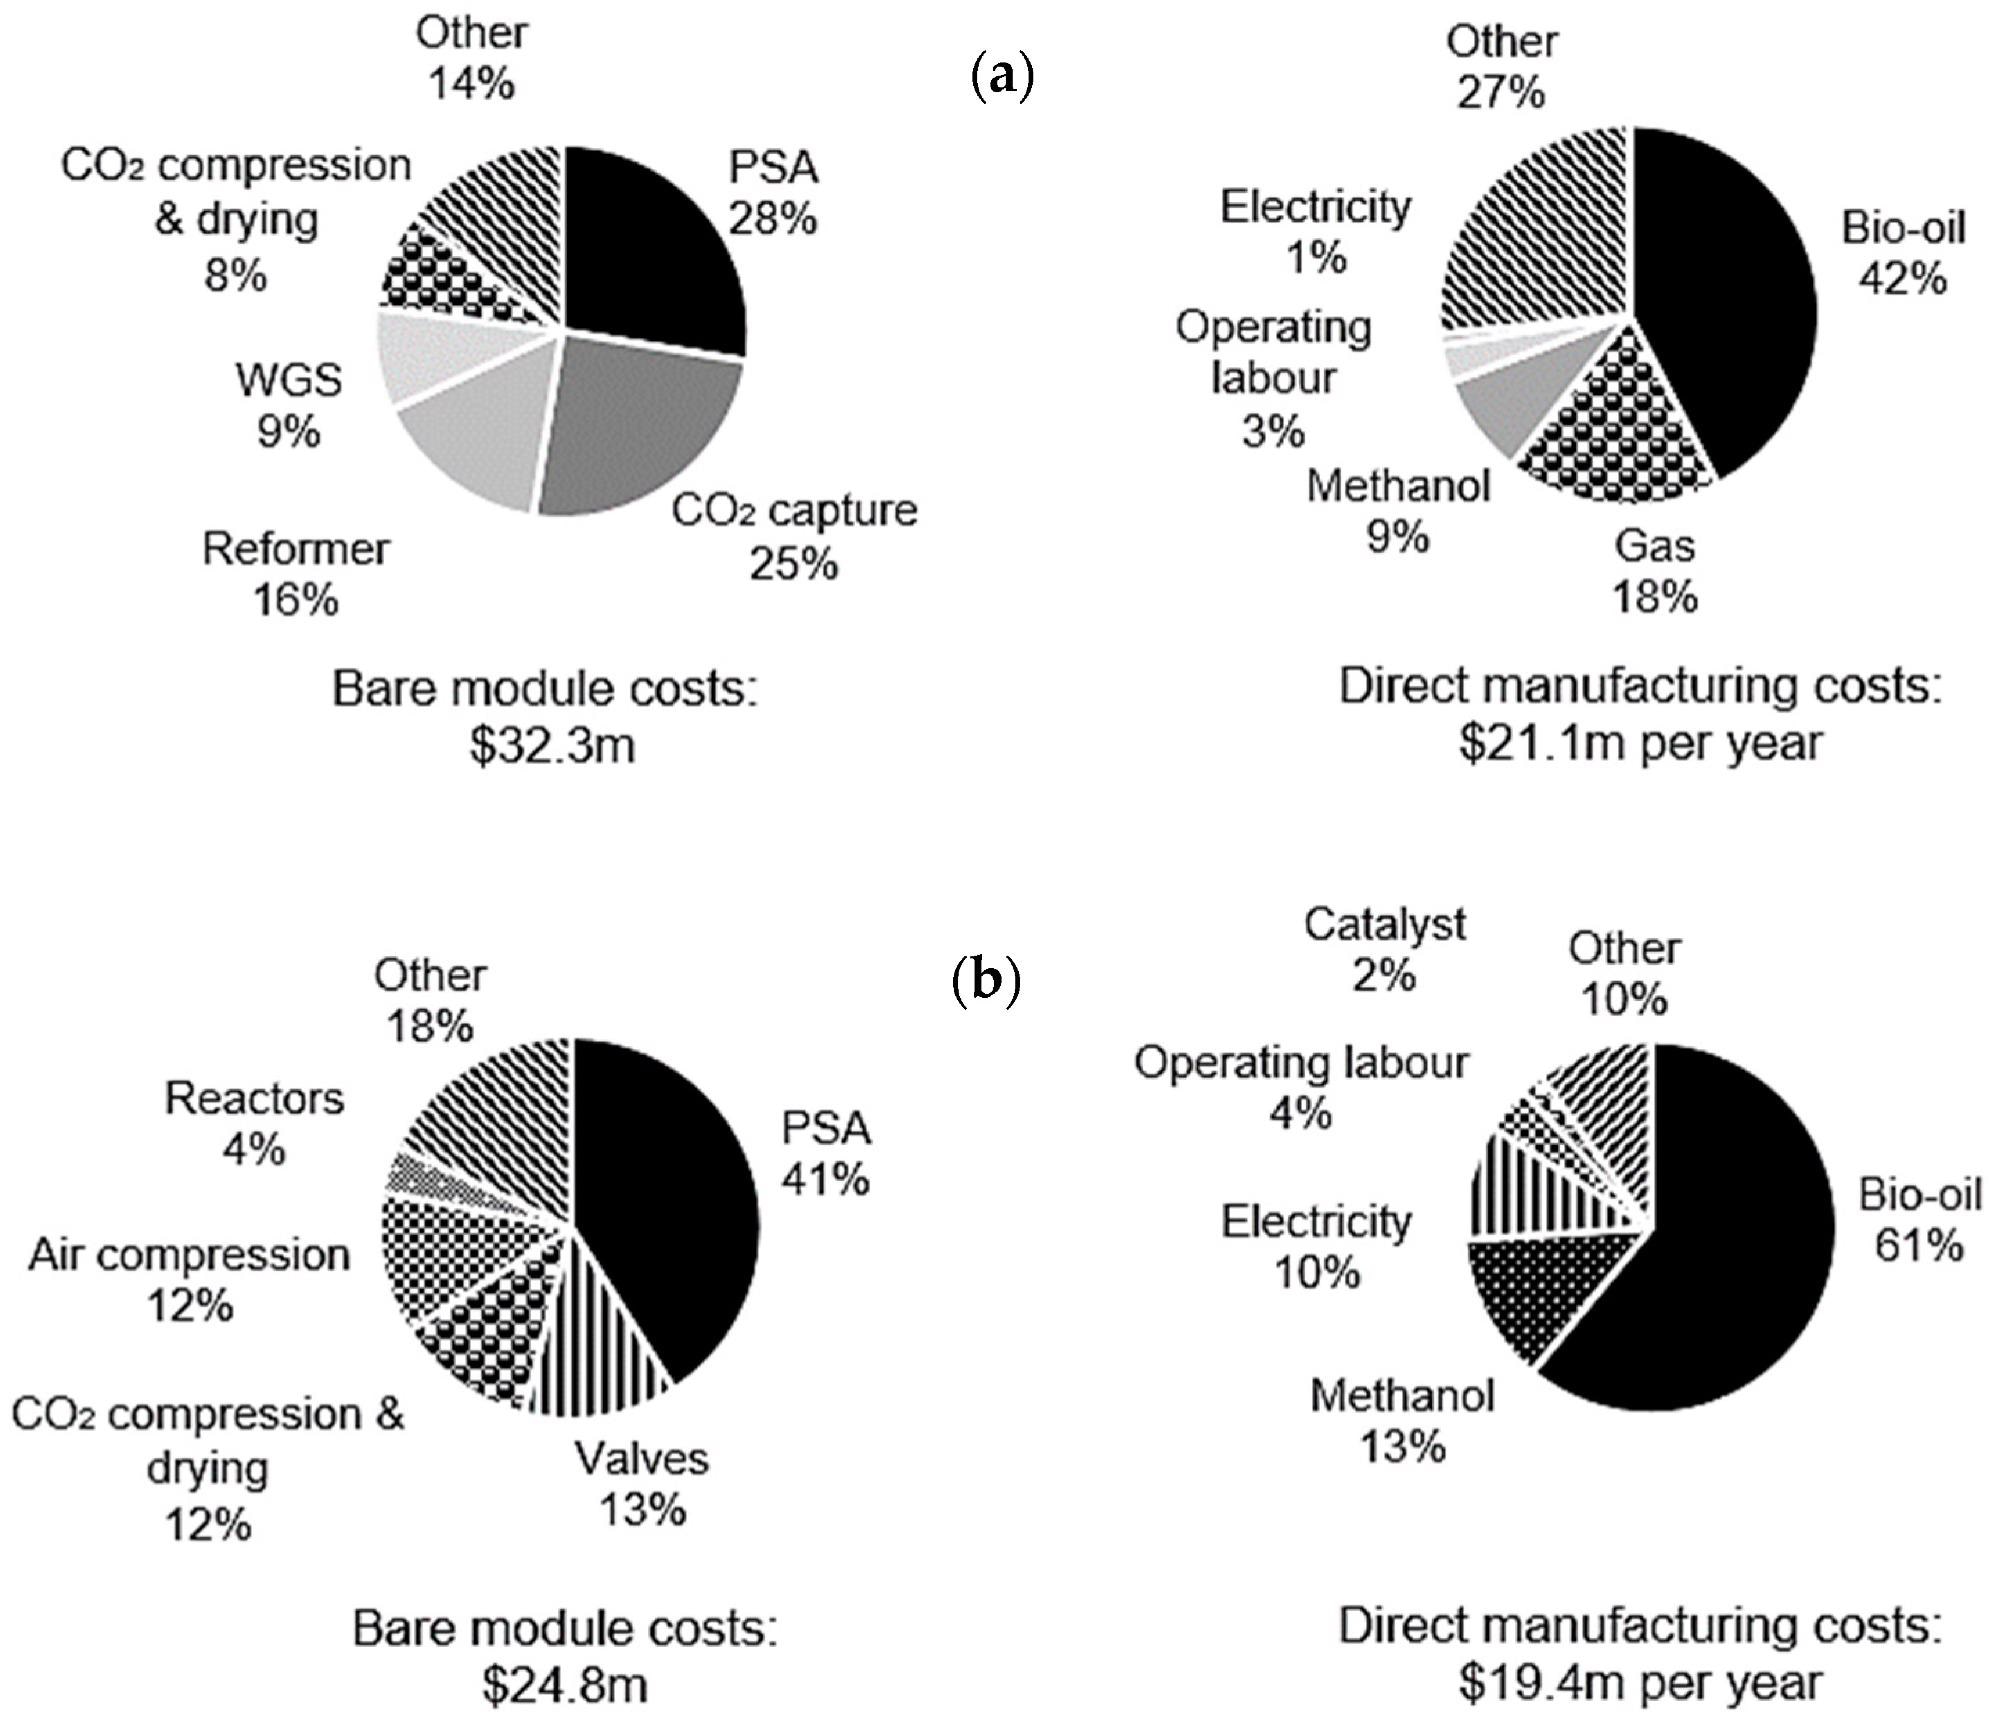
Figure 7. Breakdown of bare module costs and direct manufacturing costs in a 10,000 Nm3 h−1 process for (a) C-SR-CCS and (b) SE-CLSR. Image Credit: Reeve, J, et al., 2022
Bio-oil purchases account for the majority of manufacturing costs in both C-SR-CCS and SE-CLSR, with bio-oil having a bigger impact on SE-CLSR manufacturing costs due to the heat provided by the bio-oil/methanol feeds.
The emission balance for every process is shown in Table 6. Since only 10% of the system's CO2 emissions are sourced by power import and methanol consumption, SE-CLSR has a better emission forecast than C-SR-CCS.
Table 6. Comparison of emissions from processes (kgCO2 kgH2−1). Source: Reeve, J, et al.
| Process |
Fossil-Based CO2 Emitted |
Biogenic CO2 Captured |
Net CO2 Emissions |
CO2 Avoided |
| C-SR |
3.2 |
0 |
3.2 |
- |
| C-SR-CCS |
0.46 |
8.7 |
-8.2 |
11.4 |
| SE-CLSR |
1.1 |
10.6 |
-9.5 |
12.7 |
The cost of carbon reflects the difference in emissions, as seen in Figure 8, where the CCA for SE-CLSR is less than that for C-SR-CCS at all scales. The CCA of SE-CLSR varies from 44 to 55 USD/teCO2, while C-SR-CCS ranges from 52 to 72 USD/teCO2 for the scale option indicated in Figure 8.
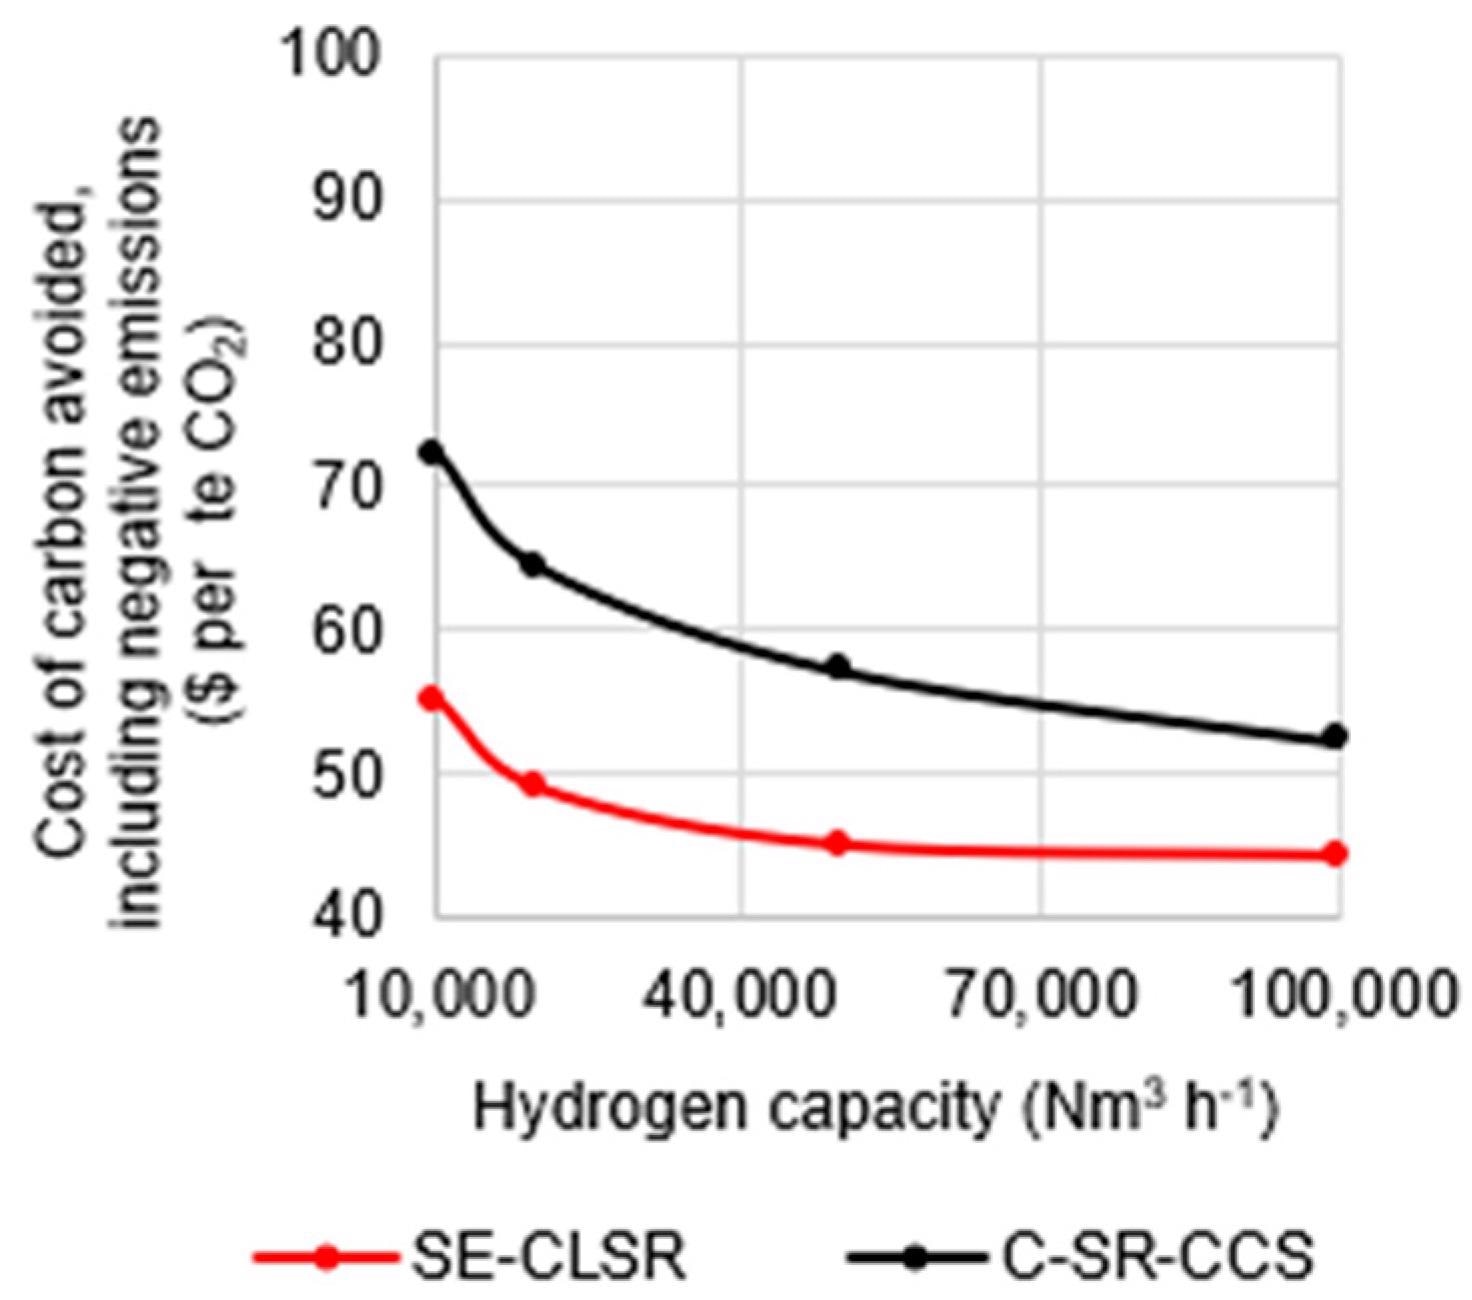
Figure 8. Cost of carbon avoided in C-SR-CCS and SE-CLSR, compared to bio-oil C-SR base case. Image Credit: Reeve, J, et al., 2022
Through sensitivity analysis, Figure 9 shows the impact of significant economic parameters on the LCOH and CCA. Since bio-oil purchases account for the majority of manufacturing expenses (Figure 7), changing its price (+/) 20% has the greatest influence on LCOH when compared to other costs.
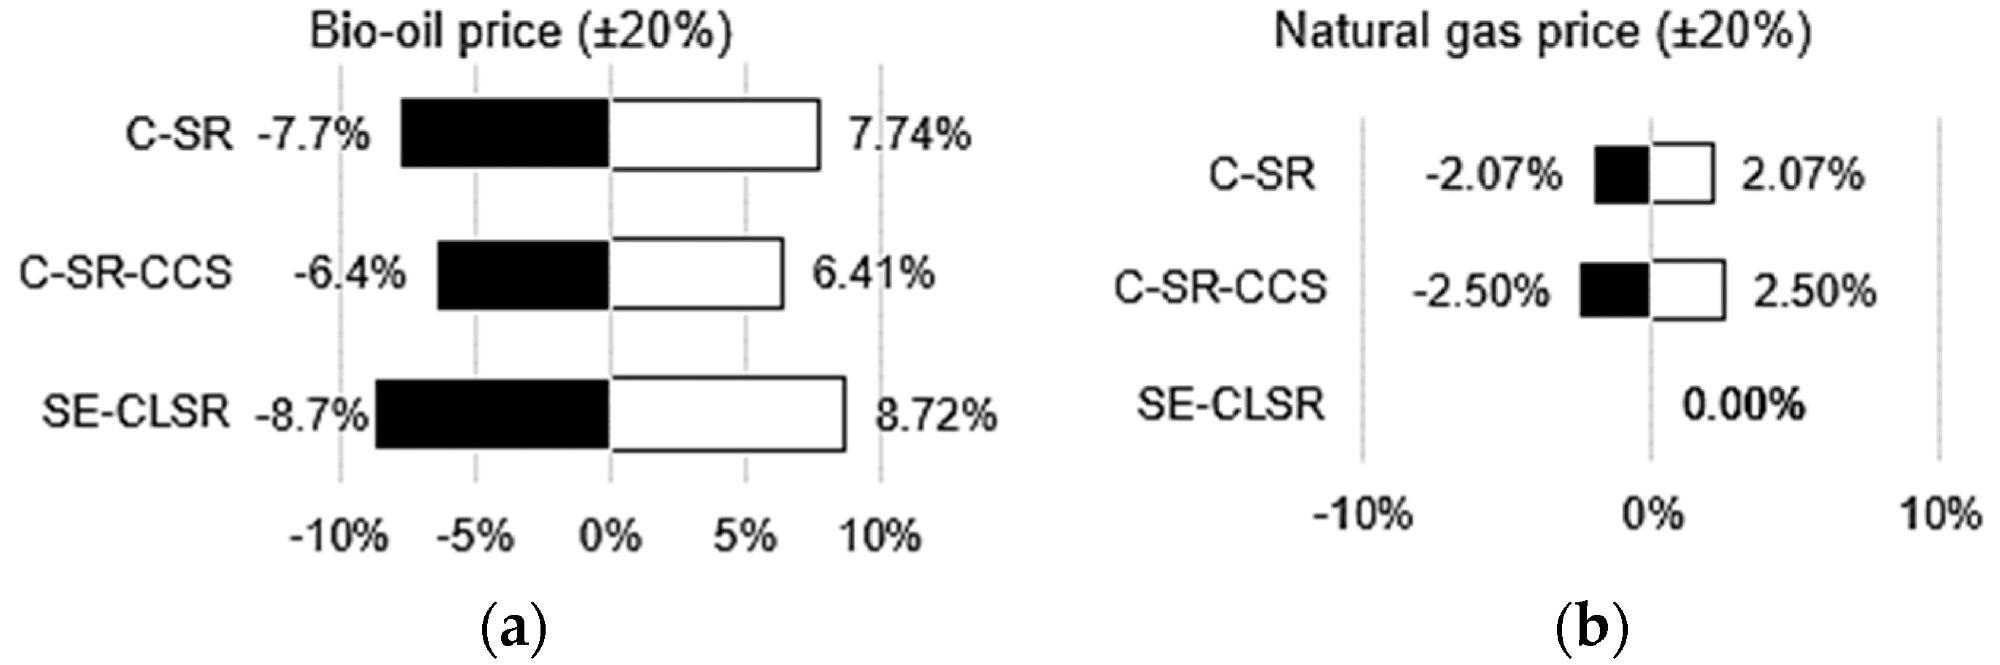
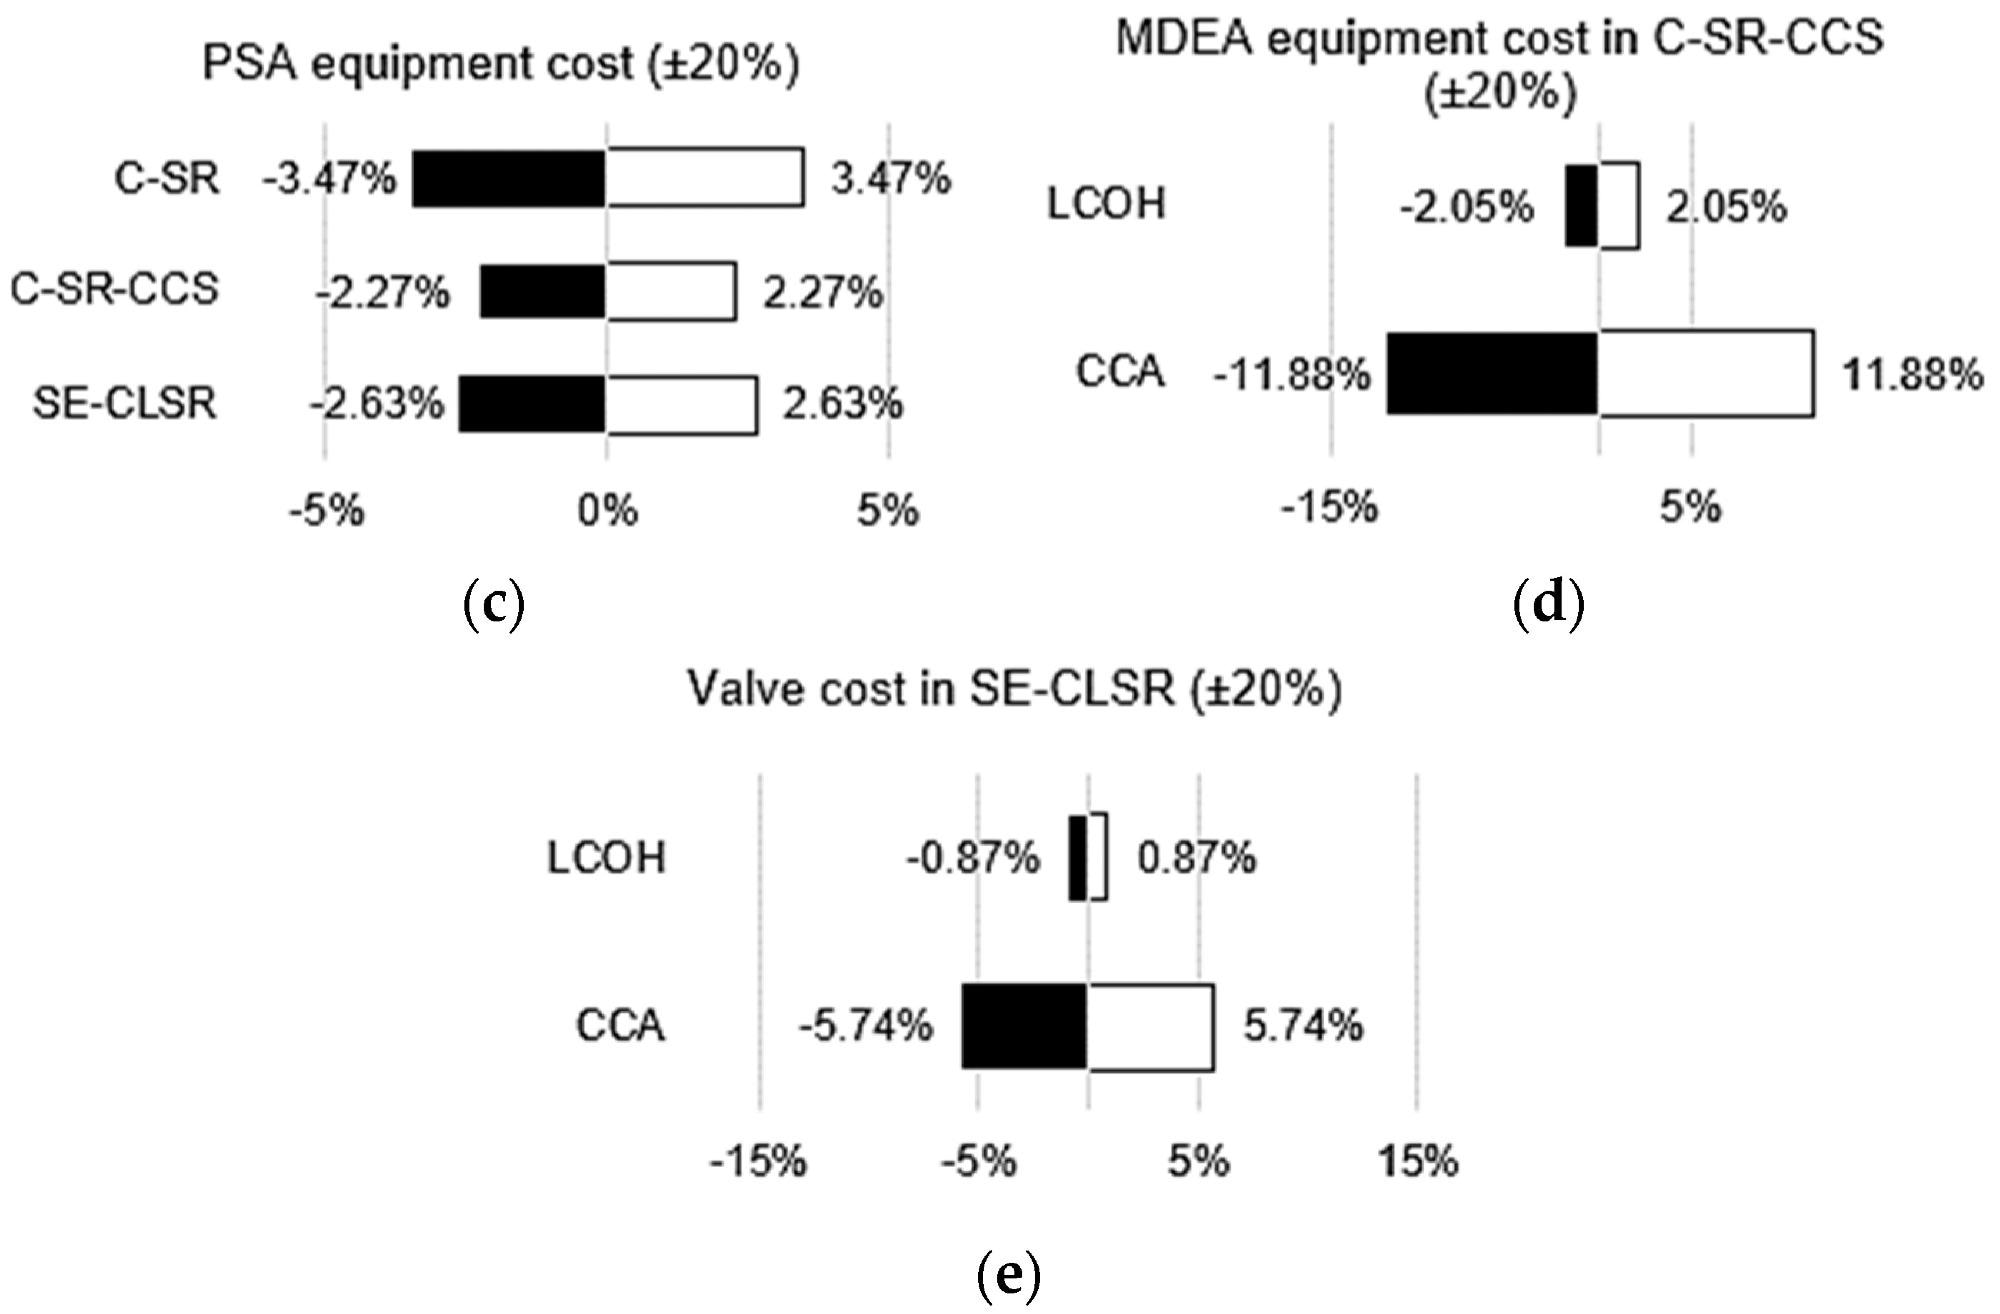
Figure 9. Various economic sensitivity analyses: (a) effect of bio-oil price on LCOH; (b) effect of natural gas price on LCOH; (c) effect of PSA equipment cost on LCOH; (d) effect of MDEA cost on LCOH and CCA for C-SR-CCS; (e) effect of valve cost on LCOH and CCA for SE-CLSR. Image Credit: Reeve, J, et al., 2022
Desulfurization is frequently overlooked in bio-oil reforming research due to the assumption that sulfur levels are low enough. Desulfurization advantages would be greater than those illustrated in Figure 10 in practice since fewer catalyst replacements would result in reduced maintenance costs.
The impact of reforming catalyst lifetime on LCOH for C-SR at 10,000 Nm3 h-1 is seen in Figure 10. It demonstrates that there is little variation in LCOH after a two-year catalyst lifespan.
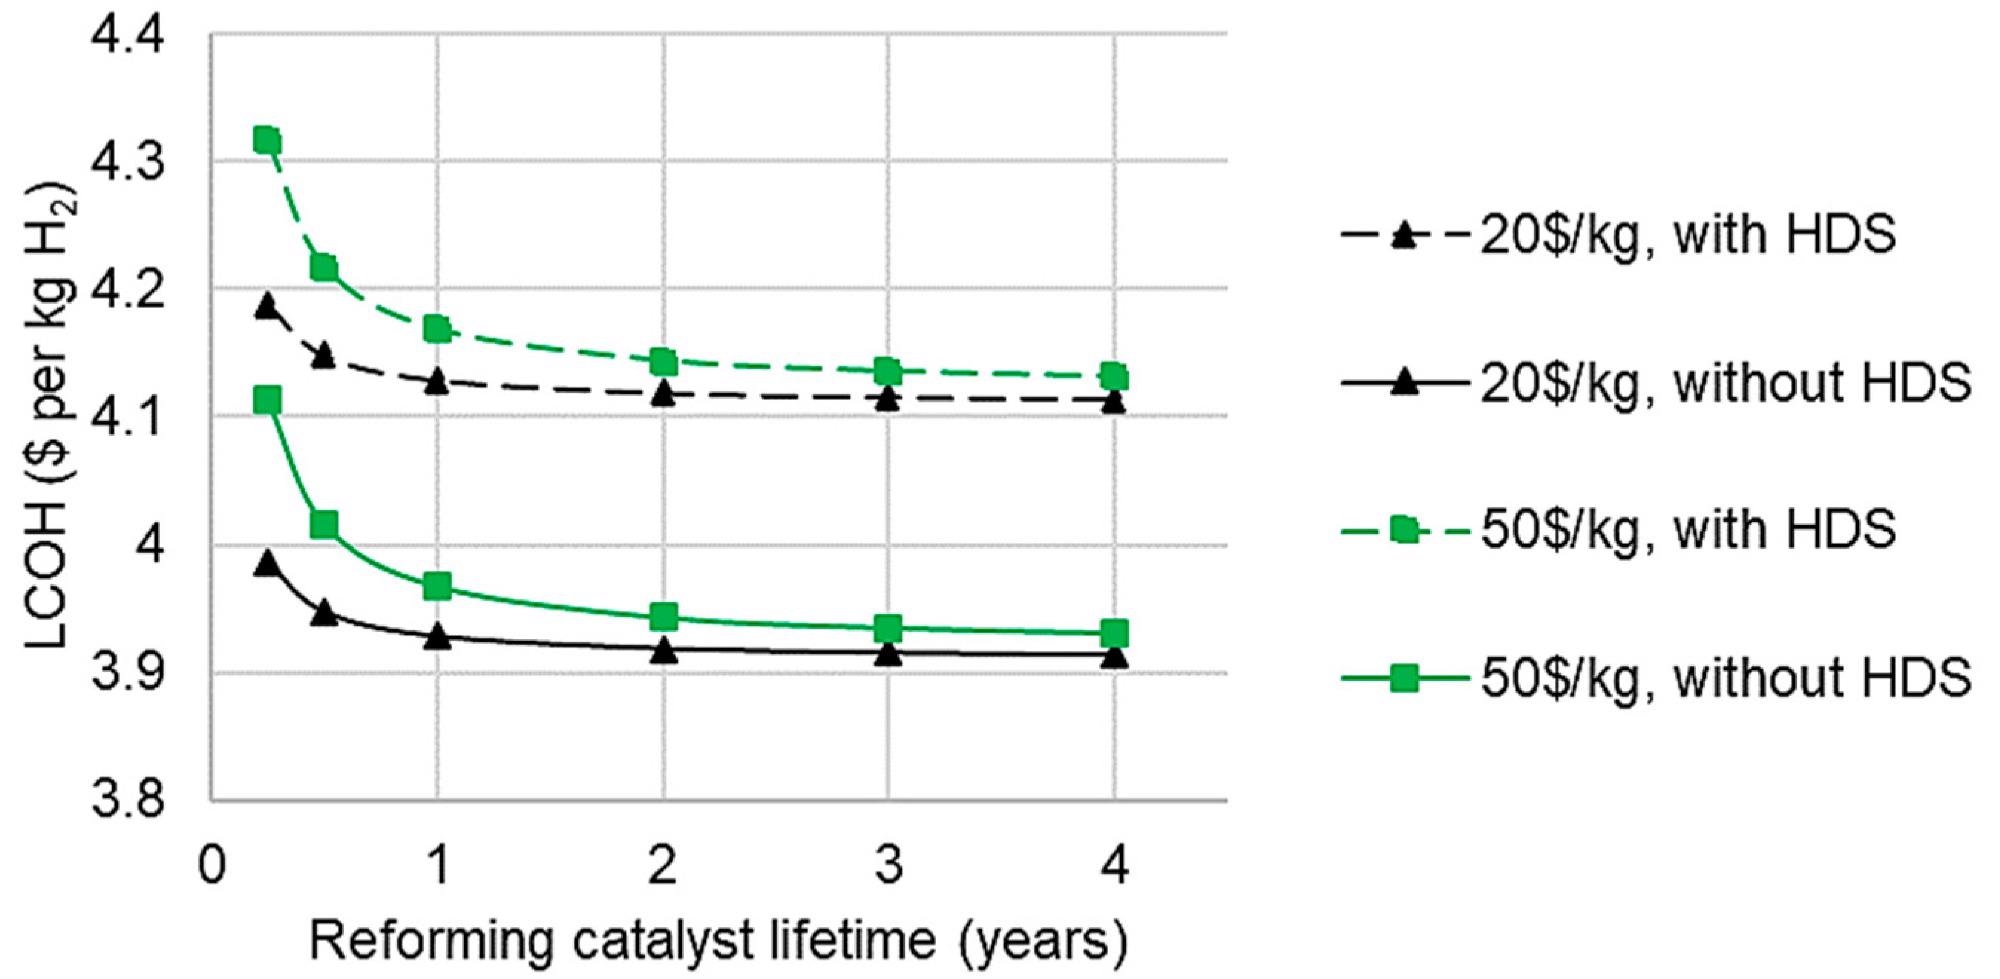
Figure 10. Effect of catalyst lifetime, cost, and hydrodesulfurization on levelized cost of hydrogen from C-SR, 10,000 Nm3 h−1. Image Credit: Reeve, J, et al., 2022
HDS may not be the most cost-effective guard bed for bio-oil, as metal oxide sulfur guard beds are. However, the existing techno-economic effect study is constrained by the little accessible data, and this topic is proposed for future investigation.
Conclusions
For the levelized cost of hydrogen, the economics of SE-CLSR are equivalent to C-SR-CCS, and are comparable to expected prices for more conventional hydrogen via the BECCS biomass gasification pathway.
The cost of carbon avoided (CCA) for BECCS varies greatly relying on the method of computation. If collected biogenic emissions are deemed “negative emissions,” the CCA is decreased to USD 40 to USD 70 per ton equivalent of CO2.
The PSA system, CO2 collection (in the case of C-SR-CCS), and three-way valves were significant factors to process cost (in the case of SE-CLSR). The high capital cost of hydrodesulfurization might raise the LCOH by approximately 11%.
However, if necessary, to increase catalyst lifespan, this investment can be justified, especially given the possible expenses associated with excessive process downtime.
Journal Reference:
Reeve, J., et al. (2022) Advanced Steam Reforming of Bio-Oil with Carbon Capture: A Techno-Economic and CO2 Emissions Analysis. Clean Technologies. doi:10.3390/cleantechnol4020018.
References and Further Reading
- Abdin, Z., et al. (2020) Hydrogen as an Energy Vector. Renewable and Sustainable Energy Reviews, 120, p. 109620. doi.org/10.1016/j.rser.2019.109620.
- Dawood, F., et al. (2020) Hydrogen Production for Energy: An Overview. International Journal of Hydrogen Energy, 45, pp. 3847–3869. doi.org/10.1016/j.ijhydene.2019.12.059.
- Noussan, M., et al. (2020) The Role of Green and Blue Hydrogen in the Energy Transition—A Technological and Geopolitical Perspective. Sustainability, 13, p. 298. doi.org/10.3390/su13010298.
- Intergovernmental Panel on Climate Change (IPCC) IPCC (2021) Climate Change 2021: The Physical Science Basis; Cambridge University Press: Cambridge, UK; New York, NY, USA.
- Wang, D., et al. (1997) Biomass to Hydrogen via Fast Pyrolysis and Catalytic Steam Reforming of the Pyrolysis Oil or Its Fractions. Industrial & Engineering Chemistry Research, 36, pp. 1507–1518. doi.org/10.1021/ie960396g.
- Sarkar, S & Kumar, A (2010) Large-Scale Biohydrogen Production from Bio-Oil. Bioresource Technology, 101, pp. 7350–7361. doi.org/10.1016/j.biortech.2010.04.038.
- Dou, B., et al. (2019) Hydrogen Production from the Thermochemical Conversion of Biomass: Issues and Challenges. Sustainable Energy Fuels, 3, pp. 314–342. doi.org/10.1039/C8SE00535D.
- Tang, M., et al. (2015) Progress in Oxygen Carrier Development of Methane-Based Chemical-Looping Reforming: A Review. Applied Energy, 151, pp. 143–156. doi.org/10.1016/j.apenergy.2015.04.017.
- Adanez, J., et al. (2012) Progress in Chemical-Looping Combustion and Reforming Technologies. Progress in Energy and Combustion Science, 38, pp. 215–282. doi.org/10.1016/j.pecs.2011.09.001.
- Ortiz, M., et al. (2012) Catalytic Activity of Ni-Based Oxygen-Carriers for Steam Methane Reforming in Chemical-Looping Processes. Energy Fuels, 26, pp. 791–800. doi.org/10.1021/ef2013612.
- Pröll, T., et al. (2010) Syngas and a Separate Nitrogen/Argon Stream via Chemical Looping Reforming—A 140 KW Pilot Plant Study. Fuel, 89, pp. 1249–1256. doi.org/10.1016/j.fuel.2009.09.033.
- Yu, Z., et al. (2019) Iron-Based Oxygen Carriers in Chemical Looping Conversions: A Review. Carbon Resources Conversation, 2, pp. 23–34. doi.org/10.1016/j.crcon.2018.11.004.
- Dou, B., et al. (2018) Hydrogen Production by Sorption-Enhanced Chemical Looping Steam Reforming of Ethanol in an Alternating Fixed-Bed Reactor: Sorbent to Catalyst Ratio Dependencies. Energy Conversion Management, 155, pp. 243–252. doi.org/10.1016/j.enconman.2017.10.075.
- Pimenidou, P., et al. (2010) Chemical Looping Reforming of Waste Cooking Oil in Packed Bed Reactor. Bioresource Technology, 101, pp. 6389–6397. doi.org/10.1016/j.biortech.2010.03.053.
- Spragg, J., et al. (2018) Hydrogen Production from Bio-Oil: A Thermodynamic Analysis of Sorption-Enhanced Chemical Looping Steam Reforming. International Journal of Hydrogen Energy, 43, pp. 22032–22045. doi.org/10.1016/j.ijhydene.2018.10.068.
- Brown, D., et al. (2014) Techno-Economic Comparisons of Hydrogen and Synthetic Fuel Production Using Forest Residue Feedstock. International Journal of Hydrogen Energy, 39, pp. 12551–12562. doi.org/10.1016/j.ijhydene.2014.06.100.
- Collodi, G., et al. (2017) Techno-Economic Evaluation of SMR Based Standalone (Merchant) Hydrogen Plant with CCS; IEAGHG Technical Report; IEAGHG: Cheltenham, UK.
- Riva, L., et al. (2018) Techno-Economic Analysis of the Ca-Cu Process Integrated in Hydrogen Plants with CO2 Capture. International Journal of Hydrogen Energy, 43, pp. 15720–15738. doi.org/10.1016/j.ijhydene.2018.07.002.
- Romano, M.C., et al. (2010) Pre-Combustion CO2 Capture from Natural Gas Power Plants, with ATR and MDEA Processes. International Journal of Greenhouse Gas Control, 4, pp. 785–797. doi.org/10.1016/j.ijggc.2010.04.015.
- Yang, F., et al. (2021) Carbon Capture and Biomass in Industry: A Techno-Economic Analysis and Comparison of Negative Emission Options. Renewable and Sustainable Energy Reviews, 144, p. 111028. doi.org/10.1016/j.rser.2021.111028.
- Northern Gas Networks (2018) H21 Leeds City Gate. Available online: https://h21.green/projects/h21-leeds-city-gate/.
- Sutherland, F., et al. (2020) Net Zero Teesside: Subsurface Evaluation of Endurance. In Proceedings of the 1st Geoscience & Engineering in Energy Transition Conference, Strasbourg, France, 16 November; 2020, pp. 1–5. doi.org/10.3997/2214-4609.202021040
- CO2 Europipe Consortium (2022) D3.1.2. Standards for CO2: CO2 Europipe Towards a Transport Infrastructure for Large-Scale CCS in Europe. 2009. Available at: http://www.co2europipe.eu/Publications/D2.2.1%20-%20CO2Europipe%20Report%20CCS%20infrastructure.pdf.
- Pimenidou, P & Dupont, V (2012) Characterisation of Palm Empty Fruit Bunch (PEFB) and Pinewood Bio-Oils and Kinetics of Their Thermal Degradation. Bioresource Technology, 109, pp. 198–205. doi.org/10.1016/j.biortech.2012.01.020.
- Abdul Halim Yun, H & Dupont, V (2015) Thermodynamic Analysis of Methanation of Palm Empty Fruit Bunch (PEFB) Pyrolysis Oil with and without in Situ CO2 Sorption. AIMS Energy, 3, pp. 774–797. doi.org/10.3934/energy.2015.4.774.
- Dupont, V., et al. (2017) High Methane Conversion Efficiency by Low Temperature Steam Reforming of Biofeedstock. In Proceedings of the REGATEC 2017 4th International Conference on Renewable Energy Gas Technology, Verona, Italy, 20 April; pp. 22–23.
- Garcia-Perez, M., et al. (2007) Characterization of Bio-Oils in Chemical Families. Biomass and Bioenergy, 31, pp. 222–242. doi.org/10.1016/j.biombioe.2006.02.006.
- Darmstadt, H., et al. (2004) Corrosion of Metals by Bio-Oil Obtained by Vacuum Pyrolysis of Softwood Bark Residues. An X-Ray Photoelectron Spectroscopy and Auger Electron Spectroscopy Study. Energy Fuels, 18, pp. 1291–13011. doi.org/10.1021/ef0340920.
- Heracleous, E (2011) Well-to-Wheels Analysis of Hydrogen Production from Bio-Oil Reforming for Use in Internal Combustion Engines. International Journal of Hydrogen Energy, 36, pp. 11501–11511. doi.org/10.1016/j.ijhydene.2011.06.052.
- Zhang, Y., et al. (2013) Comparative Techno-Economic Analysis of Biohydrogen Production via Bio-Oil Gasification and Bio-Oil Reforming. Biomass and Bioenergy, 51, pp. 99–108. doi.org/10.1016/j.biombioe.2013.01.013.
- Maples, R E (2000) Petroleum Refinery Process Economics; PennWell Corporation: Nashville, TN, USA.
- Srifa, A., et al. (2019) Advances in Bio-Oil Production and Upgrading Technologies. In Sustainable Bioenergy: Advances and Impacts; Elsevier: Amsterdam, The Netherlands; Oxford, UK; Cambridge, MA, USA. doi.org/10.1016/B978-0-12-817654-2.00006-X.
- Parkash, S (2003) Refining Processes Handbook; Elsevier: Amsterdam, The Netherlands; Oxford, UK; Cambridge, MA, USA.
- Davis, S. J., et al. (2018) Net-Zero Emissions Energy Systems. Science, 360, p. eaas9793. doi.org/10.1126/science.aas9793.
- Turton, R., et al. (2009) Analysis, Synthesis and Design of Chemical Processes, 3rd ed.; Prentice Hall: Upper Saddle River, NJ, USA, ISBN 978-0-13-512966-1.
- Turton, R., et al. (2008) Analysis, Synthesis, and Design of Chemical Processes, 4th ed.; Prentice Hall: Upper Saddle River, NJ, USA, 53.
- Sadhukhan, J., et al. (2015) Biorefineries and Chemical Processes: Design, Integration and Sustainability Analysis; John Wiley & Sons Ltd.: Chichester, UK.
- Peters, M.S., et al.(2004) Plant Design and Economics for Chemical Engineers, 5th ed.; McGraw-Hill: New York, NY, USA; London, UK.
- Hamers, H.P., et al. (2014) Comparison on Process Efficiency for CLC of Syngas Operated in Packed Bed and Fluidized Bed Reactors. International Journal of Greenhouse Gas Control, 28, pp. 65–78. doi.org/10.1016/j.ijggc.2014.06.007.
- Turner, J., et al. (2008) Renewable Hydrogen Production. International Journal of Energy Research, 32, pp. 379–407. doi.org/10.1002/er.1372.
- Czernik, S & French, R (2006) Distributed Production of Hydrogen by Autothermal Reforming of Biomass Pyrolysis Oil. In Proceedings of the ACS National Meeting Book of Abstracts, Atlanta, GA, USA, 26–30 March. doi.org/10.1016/j.ijhydene.2013.10.134.
- Campanario, F J & Gutiérrez Ortiz, F J (2017) Fischer-Tropsch Biofuels Production from Syngas Obtained by Supercritical Water Reforming of the Bio-Oil Aqueous Phase. Energy Conversion and Management, 150, PP. 599–613. doi.org/10.1016/j.enconman.2017.08.053.
- Do, T. X., et al. (2014) Techno-Economic Analysis of Biooil Production Process from Palm Empty Fruit Bunches. Energy Conversion and Management, 80, pp. 525–534. doi.org/10.1016/j.enconman.2014.01.024.
- Methanex (2019) Methanex Posts Regional Contract Methanol Prices for North America, Europe and Asia. Available at: https://www.methanex.com/our-business/pricing (accessed on 17 September).
- Song, H & Ozkan, U S (2010) Economic Analysis of Hydrogen Production through a Bio-Ethanol Steam Reforming Process: Sensitivity Analyses and Cost Estimations. International Journal of Hydrogen Energy, 35, pp. 127–134. doi.org/10.1016/j.ijhydene.2009.10.043.
- Swanson, R. M., et al. (2010) Techno-Economic Analysis of Biomass-to-Liquids Production Based on Gasification. Fuel, 89, pp. S11–S19. doi.org/10.1016/j.fuel.2010.07.027.
- Spallina, V., et al. (2019) Techno-Economic Assessment of an Integrated High Pressure Chemical-Looping Process with Packed-Bed Reactors in Large Scale Hydrogen and Methanol Production. International Journal of Greenhouse Gas Control, 88, pp. 71–84. doi.org/10.1016/j.ijggc.2019.05.026.
- Nazir, S. M., et al. (2018) Techno-Economic Assessment of the Novel Gas Switching Reforming (GSR) Concept for Gas-Fired Power Production with Integrated CO2 Capture. International Journal of Hydrogen Energy, 43, pp. 8754–8769. doi.org/10.1016/j.ijhydene.2018.02.076.
- Trane, R., et al. (2012) Catalytic Steam Reforming of Bio-Oil. International Journal of Hydrogen Energy, 37, pp. 6447–6472. doi.org/10.1016/j.ijhydene.2012.01.023.
- Kemper, J., et al. (2014) Evaluation and Analysis of the Performance of Dehydration Units for CO2 Capture. Energy Procedia, 63, pp. 7568–7584. doi.org/10.1016/j.egypro.2014.11.792.
- Gil, M. V., et al. (2016) Production of Fuel-Cell Grade H2 by Sorption Enhanced Steam Reforming of Acetic Acid as a Model Compound of Biomass-Derived Bio-Oil. Applied Catalysis B: Environmental, 184, pp. 64–76. doi.org/10.1016/j.apcatb.2015.11.028.
- Wright, M. M., et al. (2012) Investigating the Techno-Economic Trade-Offs of Hydrogen Source Using a Response Surface Model of Drop-in Biofuel Production via Bio-Oil Upgrading. Biofuels Bioproducts Biorefining, 6, pp. 503–520. doi.org/10.1002/bbb.1340.
- Arregi, A., et al. (2018) Evaluation of Thermochemical Routes for Hydrogen Production from Biomass: A Review. Energy Conversion and Management, 165, pp. 696–719. doi.org/10.1016/j.enconman.2018.03.089.
- Marda, J. R., et al. (2009) Non-Catalytic Partial Oxidation of Bio-Oil to Synthesis Gas for Distributed Hydrogen Production. International Journal of Hydrogen Energy, 34, pp. 8519–8534. doi.org/10.1016/j.ijhydene.2009.07.099.
- Spallina, V., et al. (2016) Techno-Economic Assessment of Membrane Assisted Fluidized Bed Reactors for Pure H2 Production with CO2 Capture. Energy Conversion Management, 120, pp. 257–273. doi.org/10.1016/j.enconman.2016.04.073.
- Dupont, V., et al. (2007) Unmixed Steam Reforming of Methane and Sunflower Oil: A Single-Reactor Process for H2-Rich Gas. International Journal of Hydrogen Energy, 32, pp. 67–69. doi.org/10.1016/j.ijhydene.2006.06.033.
- Marquevich, M., et al. (2001) Hydrogen Production by Steam Reforming of Vegetable Oils Using Nickel-Based Catalysts. Industrial & Engineering Chemistry Research, 40, pp. 4757–4766. doi.org/10.1021/ie010135t.
- Aspen Plus V.10 (2015) Aspen Technology: Houston, TX, USA.
- Chattanathan, S. A., et al. (2014) Hydrogen Production from Biogas Reforming and the Effect of H2S on CH4 Conversion. International Journal of Hydrogen Energy, 39, pp. 19905–19911. doi.org/10.1016/j.ijhydene.2014.09.162.
- Tian, X., et al. (2016) Simulation and Exergetic Evaluation of Hydrogen Production from Sorption Enhanced and Conventional Steam Reforming of Acetic Acid. International Journal of Hydrogen Energy, 41, pp. 21099–21108. doi.org/10.1016/j.ijhydene.2016.09.184.
- Baker, E H (1962) 87. The Calcium Oxide-Carbon Dioxide System in the Pressure Range 1-300 Atmospheres. Journal of the Chemical Society (Resumed), 87, pp. 464–470. doi.org/10.1039/JR9620000464.
- Meerman, J. C., et al. (2012) Techno-Economic Assessment of CO2 Capture at Steam Methane Reforming Facilities Using Commercially Available Technology. International Journal of Greenhouse Gas Control, 9, pp. 160–171. doi.org/10.1016/j.ijggc.2012.02.018.
- Seider, W. D., et al. (2009) Product and Process Design Principles: Synthesis, Analysis and Evaluation; John Wiley & Sons, Ltd.: Hoboken, NJ, USA.
- Schmidtsche Schack Flue Gas Convection Section in Steam Reformer Plants for Ammonia, Methanol, Hydrogen Production. Available at : https://www.schmidtsche-schack.com/
- Shahabuddin, M., et al. (2020) Advances in the Thermo-Chemical Production of Hydrogen from Biomass and Residual Wastes: Summary of Recent Techno-Economic Analyses. Bioresource Technology, 299, p. 122557. doi.org/10.1016/j.biortech.2019.122557.
- The Hydrogen Council (2020) Path to Hydrogen Competitiveness a Cost Perspective; The Hydrogen Council: Brussels, Belgium.
- Consoli, C (2019) Bioenergy and Carbon Capture and Storage-2019 Perspective; Global CCS Institute: Melbourne, Australia.
- Alptekin, G. O., et al. (2015) Novel Sorbent to Clean Up Biogas for CHPs; US Department of Energy: Washington, DC, USA.
- MATHESON Nanochem GuardBed for Sulfur Removal 2020. Available at : https://www.mathesongas.com/gas-equipment/ultrapurification/desulfurization/ (accessed on 9 February 2022).