The production of plastic has skyrocketed in recent decades, using 6% of world oil, emitting GHGs, and inflicting environmental harm to natural habitats and ecosystems. Plastic waste is a big concern as it accounts for 12% of worldwide waste and poses health risks to coastal areas. This article will look at research recently published in Sustainability.
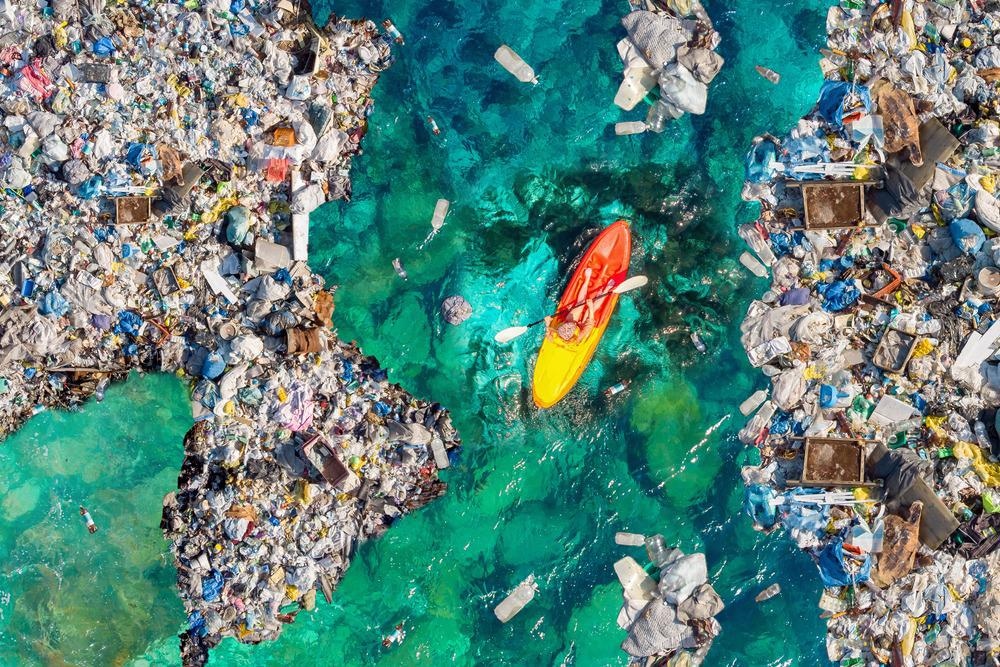
Image Credit: Parilov/Shutterstock.com
Plastic waste that is not properly managed pollutes the environment, harms natural ecosystems, clogs drainage systems, and causes infrastructural problems.
Plastics also break down into minuscule particles known as “microplastics”, which are difficult to collect and can harm food chains and ecosystems.
The GHG emissions related to plastics production for non-durable items are examined using a lifecycle-based methodology applying Project Drawdown Modeling Framework in this study. The impact of decreasing or replacing virgin plastic with other materials is weighed against the impact of avoiding the manufacturing of non-durable plastic.
Virgin, petroleum-based polymers dominate the “conventional” plastics industry, whose effects can be minimized by a variety of interventions that limit or replace conventional plastics.
The fundamental unit of study was a functional unit of 1 million metric tons of plastic manufacture, with the system boundary being a cradle-to-production gate. As shown in Figure 1 and Table 1, key measures to reduce the effect of the plastics market have been identified and prioritized.
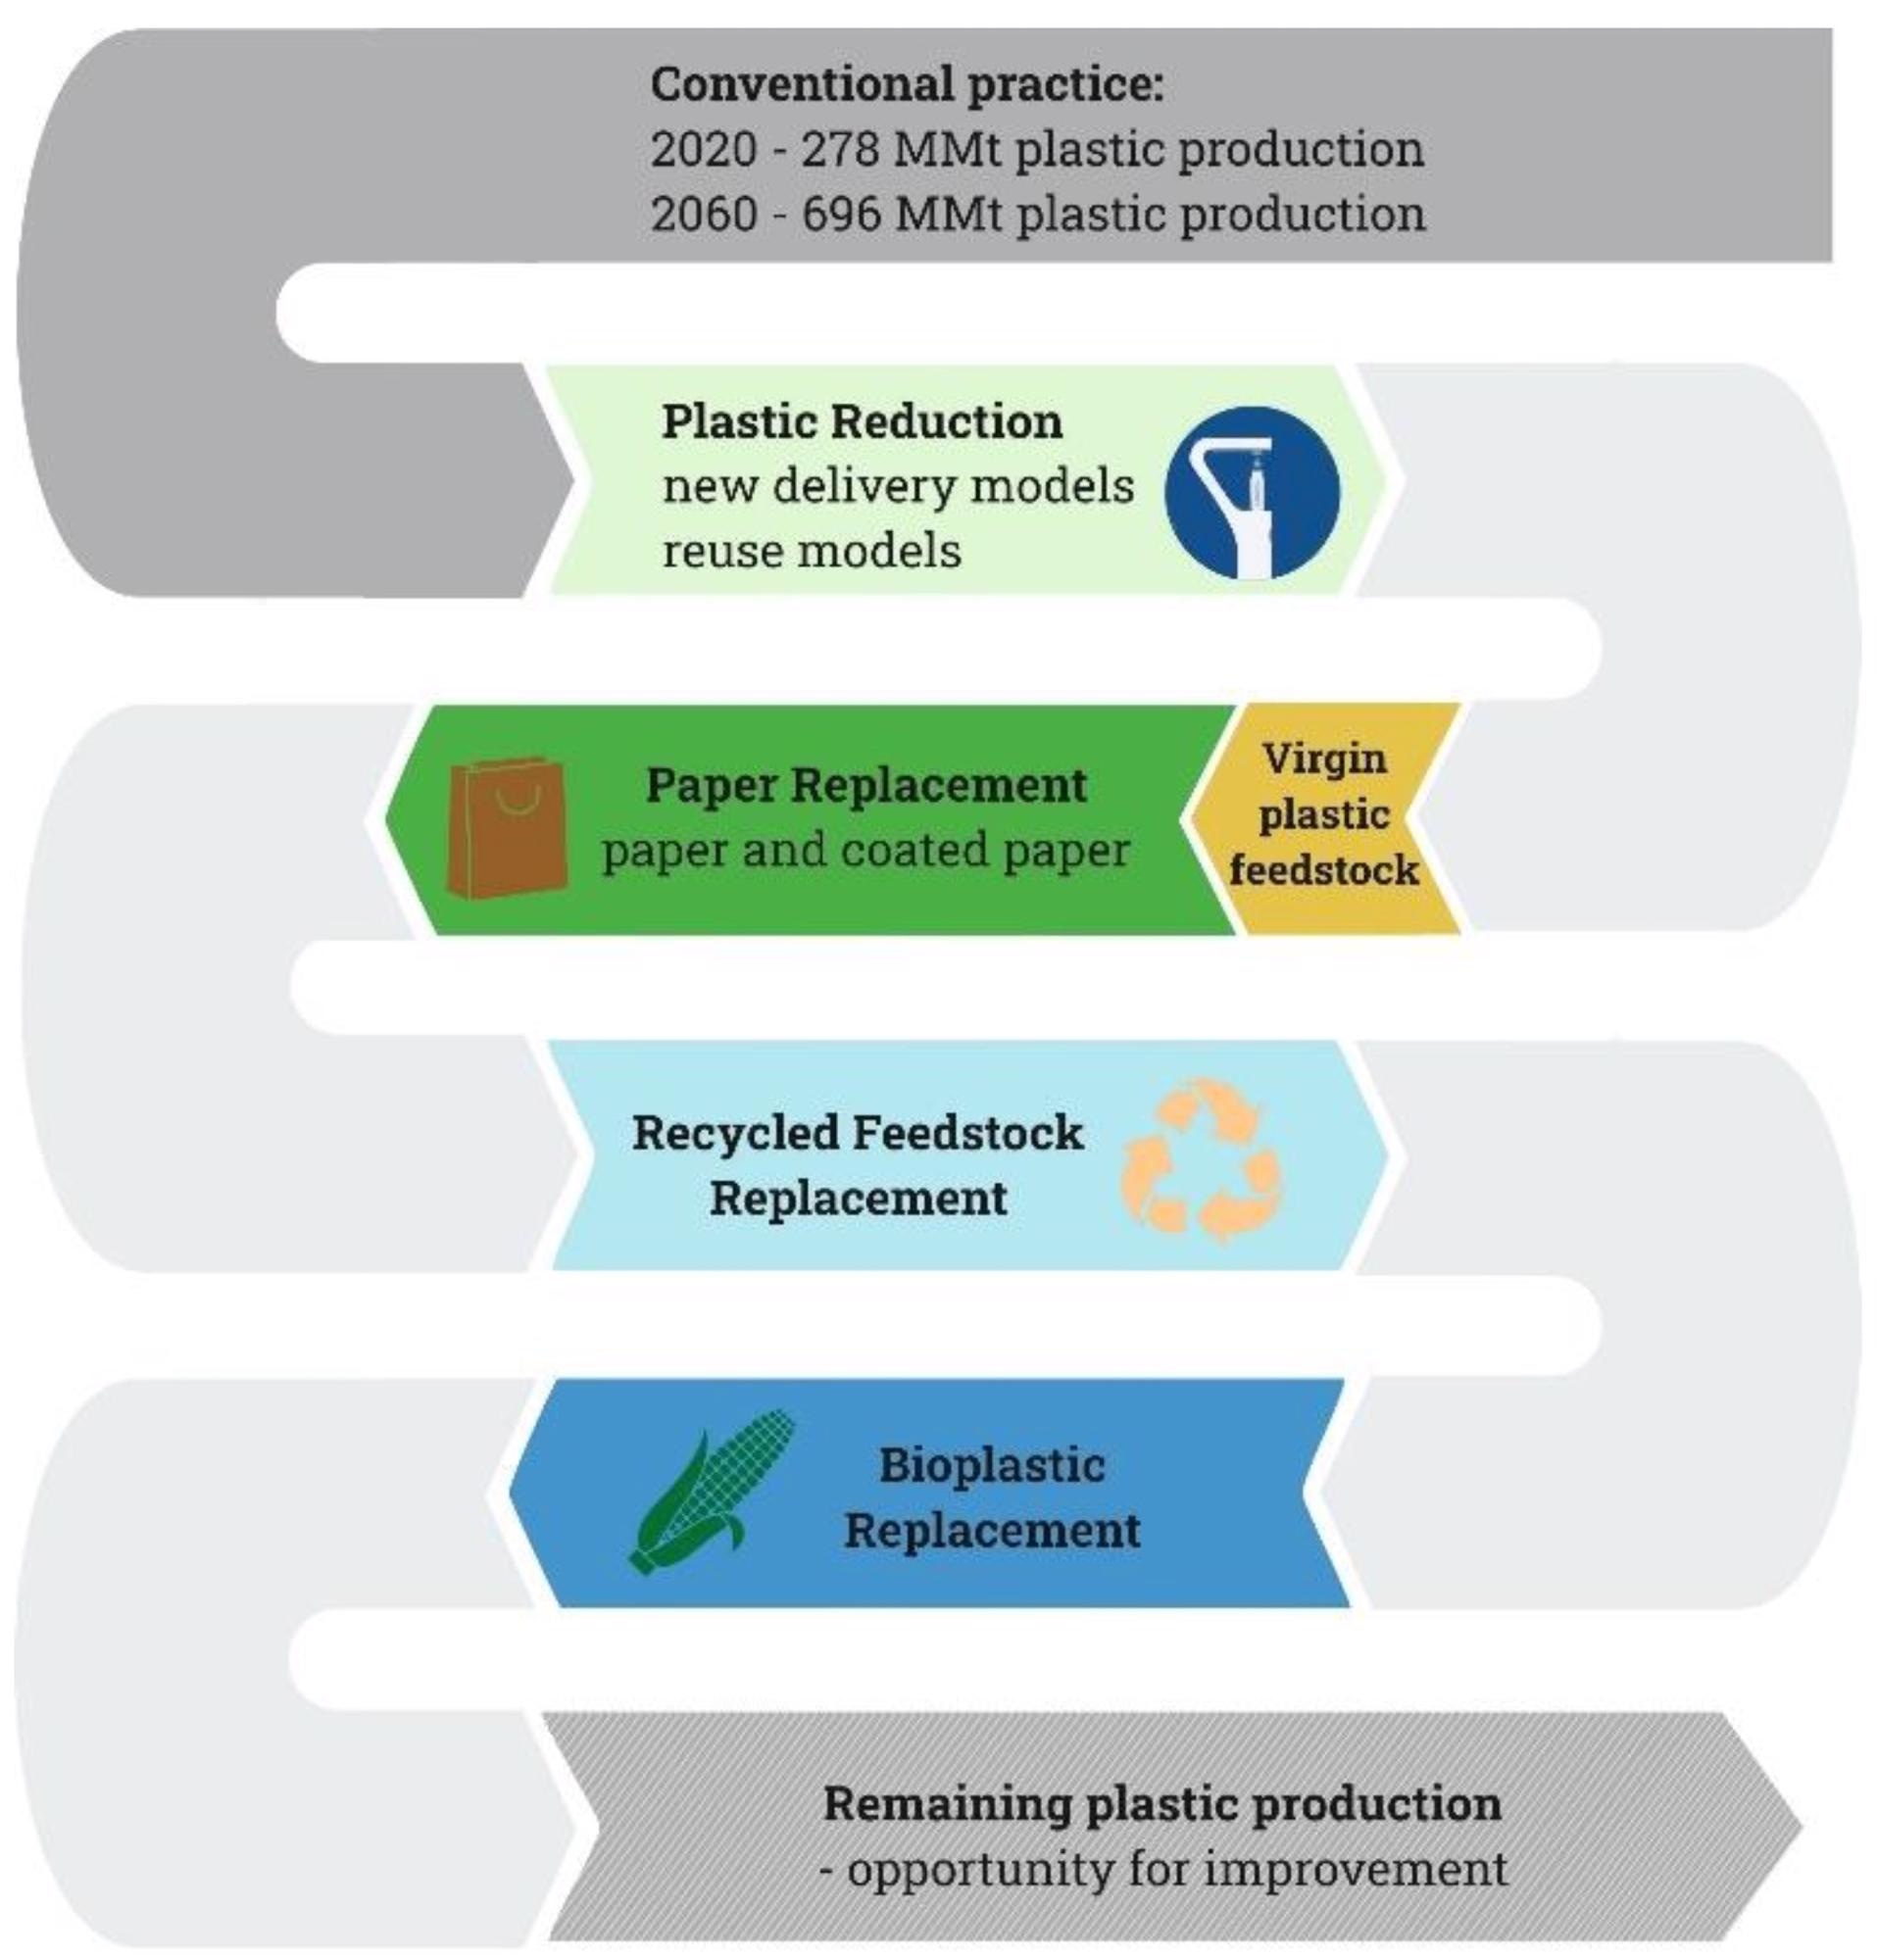
Figure 1. Roadmap for reducing the conventional practice of virgin plastics production through multiple interventions. Image Credit: Jankowska, et al., 2022
Table 1. Interventions to reduce the climate impact of the plastic market. Source: Jankowska, et al., 2022
| Intervention |
Definition |
| Plastic Reduction (via e.g., elimination and reuse). |
Reduction of plastic production by eliminating unnecessary items and over-packaging, expanding reuse options that can replace utility currently provided by plastic, including products intended for consumers to reuse, and new delivery models such as refill systems and deposit schemes. |
| Replace with paper-based materials (e.g., paper, coated paper). |
Substitution of plastic used in non-durable goods with recyclable paper or other fiber-based material ensuring the new material delivers the same quality as plastic. |
| Replace with recycled plastics (from post-consumer waste). |
Substitution of virgin plastic used in non-durable goods with plastic coming from recycling. |
| Replace with bioplastics (defined as bio-based or biodegradable plastics). |
Substitution of virgin plastic used in non-durable goods with bioplastic or other bio-based compostables ensuring the new material delivers the same quality as plastic. |
Plastic production will contribute considerably to global GHG emissions in 2050, according to this report, which combines fresh research findings from numerous studies.
Methodology
Based on published sources for historical, present, and future predicted adoption scenarios, the CO2-eq impacts of viable solutions relative to conventional plastics manufacturing are quantified. Three scenarios are created, each with varying amounts of increased adoption as compared to a baseline scenario.
Plausible, ambitious, and maximal are the three adoption scenarios. The total lowered emissions from the actions are represented by the delta of the resultant emissions footprints.
In a plausible scenario, interventions are implemented at a rapid pace that is both ambitious and feasible.
In the ambitious scenario, the adoption of interventions has grown to the high end of the estimates, indicating that the plausible scenario has progressed.
The maximal scenario denotes the highest estimated adoption rate.
Four sources are used to calculate the Total Adoption Market (TAM) for all plastic demanded between 2014 and 2050. Non-durable items with an average life duration of fewer than three years are included, as are durable goods with a life span of up to 50 years.
Durable plastics do not constitute a large amount of trash that ends up in the environment due to their extended lifespan; hence, there is less interest in reducing or substituting solutions.
Plastic minimization is a top goal for a variety of reasons, including the utmost CO2-eq reductions, avoiding upstream emissions related to distribution, and avoiding garbage collection and disposal. To reduce plastic manufacturing, a number of initiatives have been proposed.
The adoption of Plastic Reduction initiatives (in %) from every source is measured to the common functional unit of MMt plastic produced and aggregated to calculate the impact on the TAM, with varying degrees of ambition depending on the situation.
After giving a portion of the plastic market to Plastic Reduction, the remaining 90% can be used to research three alternative treatments. Paper substitutes, recycled feedstock substitutes, and bioplastic substitutes are all viable options.
All of these treatments are feasible to implement based on estimates taken from available research and do not exceed the entire TAM.
146 data points from 34 sources were utilized to compute the CO2 emissions footprint of plastics manufacturing, paper manufacture, recycled plastic production, and bioplastic production.
These numbers were double-checked and averaged. Table 2 includes these emissions parameters, as well as the standard deviation from the meta-analysis and the quantity of data obtained and examined.
Table 2. CO2-eq emission factors for all interventions used in the analysis; n/a, not applicable. Source: Jankowska, et al.,2022
| Units MMt CO2/MMT of Production |
| Interventions |
Emissions |
Stdev |
Number of Data Points |
References |
| Conventional Plastics |
2.51 |
0.71 |
27 |
[4,27,31,34,35,36,37,38,39] |
| Plastics Reduction |
n/a |
n/a |
n/a |
- |
| Paper Replacement |
1.53 |
0.84 |
49 |
[27,40,41,42,43,44,45,46,47,48,49,50,51,52] |
| Recycled Feedstock Replacement |
0.704 |
0.48 |
17 |
[39,43,44,53] |
| Bioplastics Replacement |
0.829 |
0.38 |
53 |
[35,37,38,39,54,55,56] |
The CO2-equivalent emissions reductions from each intervention are estimated using the intervention’s adoption in MMt of plastic generated throughout the time period in question (2020–2050) and the intervention’s emissions factor per functional unit.
The minimized plastics intervention determines what the baseline CO2-eq emissions would have been if that quantity of traditional plastics had been produced from 2020 to 2050, and assumes that a complete reduction would result in zero-production phase emissions:
R=EFCP × Ai
where R is the drop in CO2-equivalent emissions of the intervention I, EFCP is the Emissions Factor of Conventional Plastics, and Ai is the adoption of the intervention i (Plastic Reduction) over the 2020–2050 period.
Overpackaging will be eliminated, reuse will be promoted, and alternative delivery methods, such as refill stations, will be implemented as part of the Plastics Reduction initiative. While elimination does not need any CO2-eq emissions, the reuse and new distribution models do have some emissions related to the material manufacturing and usage phase, for example, the installation of refill stations.
Since the emissions do not fall inside our system boundary, they are not measured in the current analysis.
Other CO2-eq emissions reductions are determined based on the substitution of the alternative material for the traditional material, as follows:
R=(EFCP−EFi) × Ai
where EFi stands for the Emissions Factor of the replacement technology: paper, recycled feedstock, or bioplastics.
Electricity production, transportation, agriculture, and food systems are just a few of the interconnected sectors addressed by the Project Drawdown Modeling Framework. It eliminates duplicate counting in the plastics industry as well as across the system.
Results
Each of the four interventions is constructed with different levels of ambition in mind, and then grouped into three main scenarios: plausible, ambitious, and maximum. Depending on the scenario, plastics reduction adoption is expected to achieve between 1592 and 3786 MMt in 2020–2050.
Due to data availability constraints, the adoption of Paper Replacement, the second prioritized intervention, is considered to need the same degree of ambition across scenarios, resulting in a constant value of 1471 MMt 2020–2050 for all three scenarios, as depicted in Table 3.
Table 3. Total reduction and replacement of plastics production (MMt) and total climate impact (Gt CO2-eq) from all four interventions under three scenarios between 2020–2050. Source: Jankowska, et al., 2022
| Adoption |
Plausible Scenario |
Ambitious Scenario |
Maximum Scenario |
| 2020–2050 |
MMt plastic eliminated |
Gt CO2-eq reduced |
MMt plastic eliminated |
Gt CO2-eq reduced |
MMt plastic eliminated |
Gt CO2-eq reduced |
| Plastic Reduction |
1592 |
4.00 |
3103 |
7.79 |
3786 |
9.51 |
| Paper Replacement |
1471 |
1.44 |
1471 |
1.44 |
1471 |
1.44 |
| Recycled Feedstock Replacement |
5615 |
2.36 |
4731 |
3.61 |
4332 |
3.01 |
| Bioplastic Replacement |
3024 |
1.70 |
2548 |
2.97 |
2333 |
0.94 |
| Total |
11,702 |
9.50 |
11,853 |
15.81 |
11,922 |
14.90 |
Between 2020 and 2050, several actions result in considerable CO2-eq emissions reductions. Depending on the circumstances, plastic reductions have the biggest potential, ranging from 4.0 to 9.5 Gt CO2-eq.
Since there are insufficient studies with relevant data to generate more than one scenario, paper replacement resulted in a reduction of 1.4 Gt CO2-eq across all scenarios.
Recycled Feedstock Replacement provides a larger emission reduction potential, ranging from 2.4 to 3.6 Gt CO2-eq. Bioplastics Replacement has a similar impact, ranging from 1.7 to 3.0 Gt CO2-eq.
Plastic Reductions have the biggest potential decrease, and Figure 2 shows the difference in yearly adoption for each scenario.
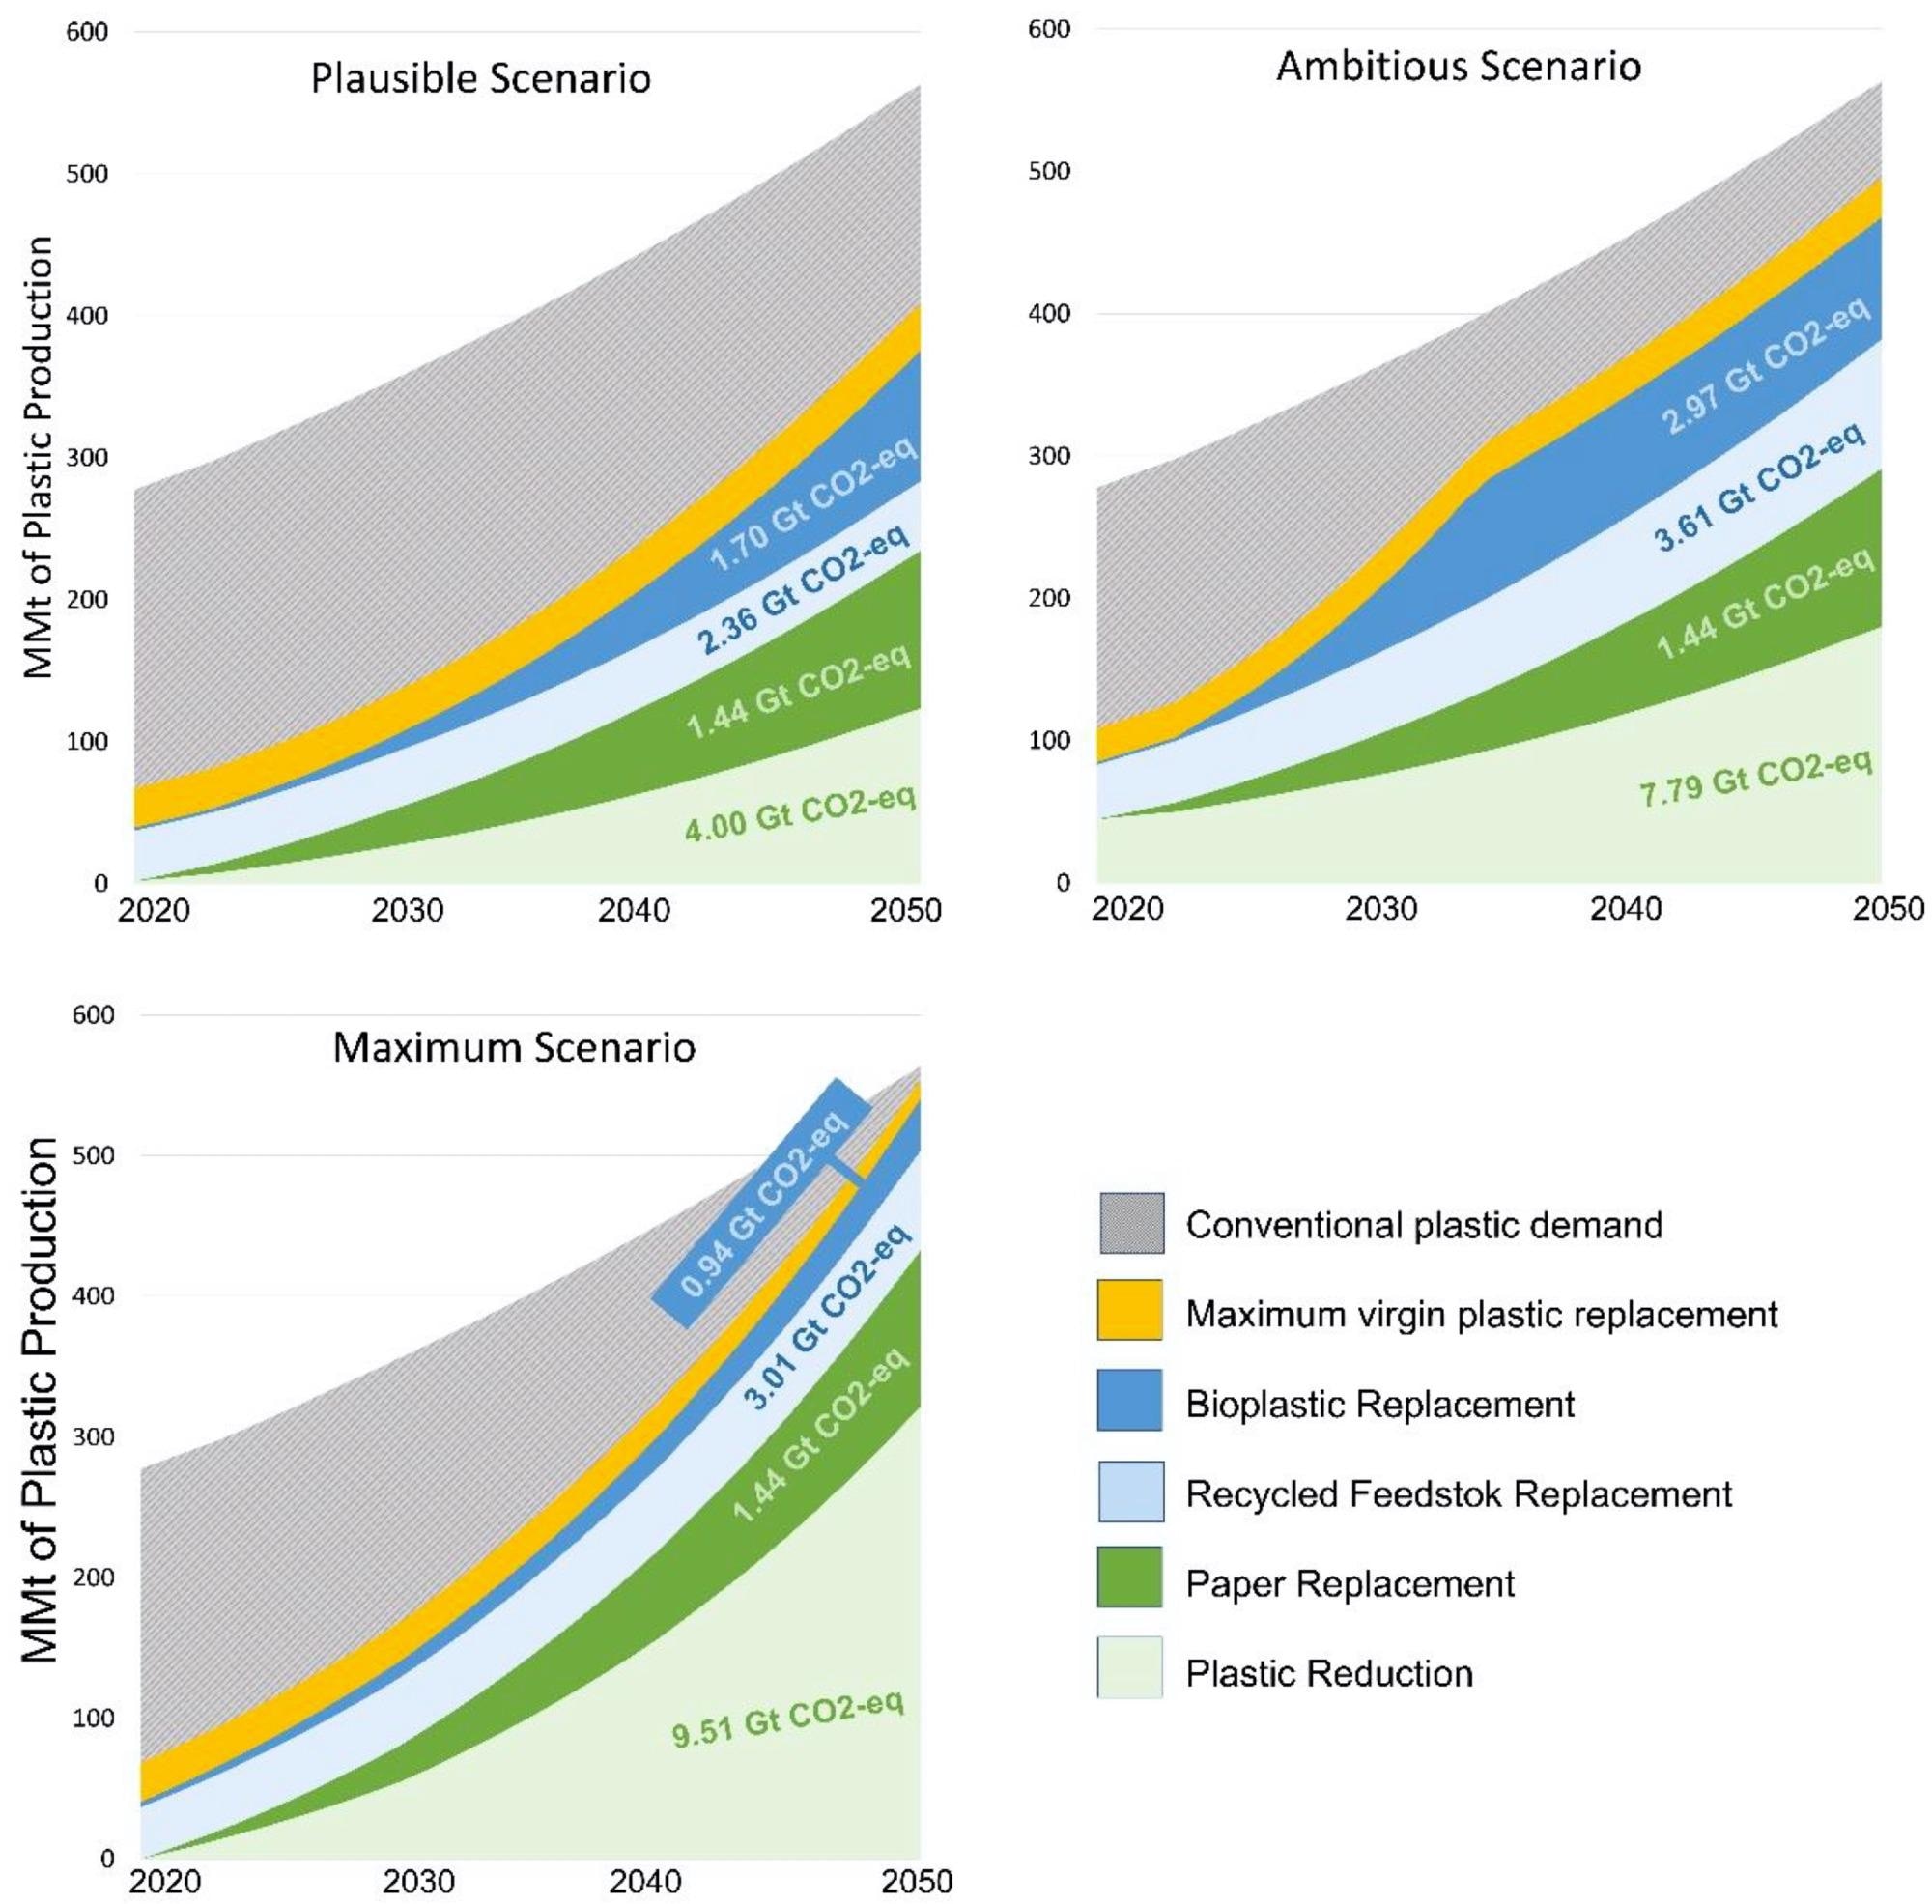
Figure 2. Annual emission reduction from applying Integrated Plastic System interventions. Total emission reduction coming from each intervention achieved between 2020–2050 in three scenarios is displayed within the graph in Gt CO2-eq over the time period. Image Credit: Jankowska, et al., 2022
Lower manufacturing of plastics through reduced demand and alternative distribution systems, recycled plastic, and substitution with other materials are all viable options for enhancing the sustainability of the plastics system (paper, bioplastic).
These actions might lower emissions by 1.5% of what is required to meet the Paris Agreement’s goals.
The study looks at the technological feasibility of modifying the plastics manufacturing system, but it does not look at the economic feasibility. The hazards of continuing to produce plastic in the same manner outweigh the benefits.
Plastics are employed in a variety of sectors, including aviation and medical, but 60% of plastic is used in single-use packaging or domestic items with a limited lifespan, which ends up as landfill debris. This has a number of detrimental consequences for human health and the environment.
Open burning is still frequent, releasing airborne particulates, carcinogens, and other contaminants into the air. Furthermore, plastic winds up in the seas, where it clogs up coastlines, forms floating islands, sinks to the deep sea, and degrades into impossible-to-collect microplastics.
It endangers numerous marine species and has a negative impact on the fishing sector.
As illustrated in Figure 3, eliminating virgin plastics from packaging is critical for limiting plastic pollution and improving the livelihoods of many nations.
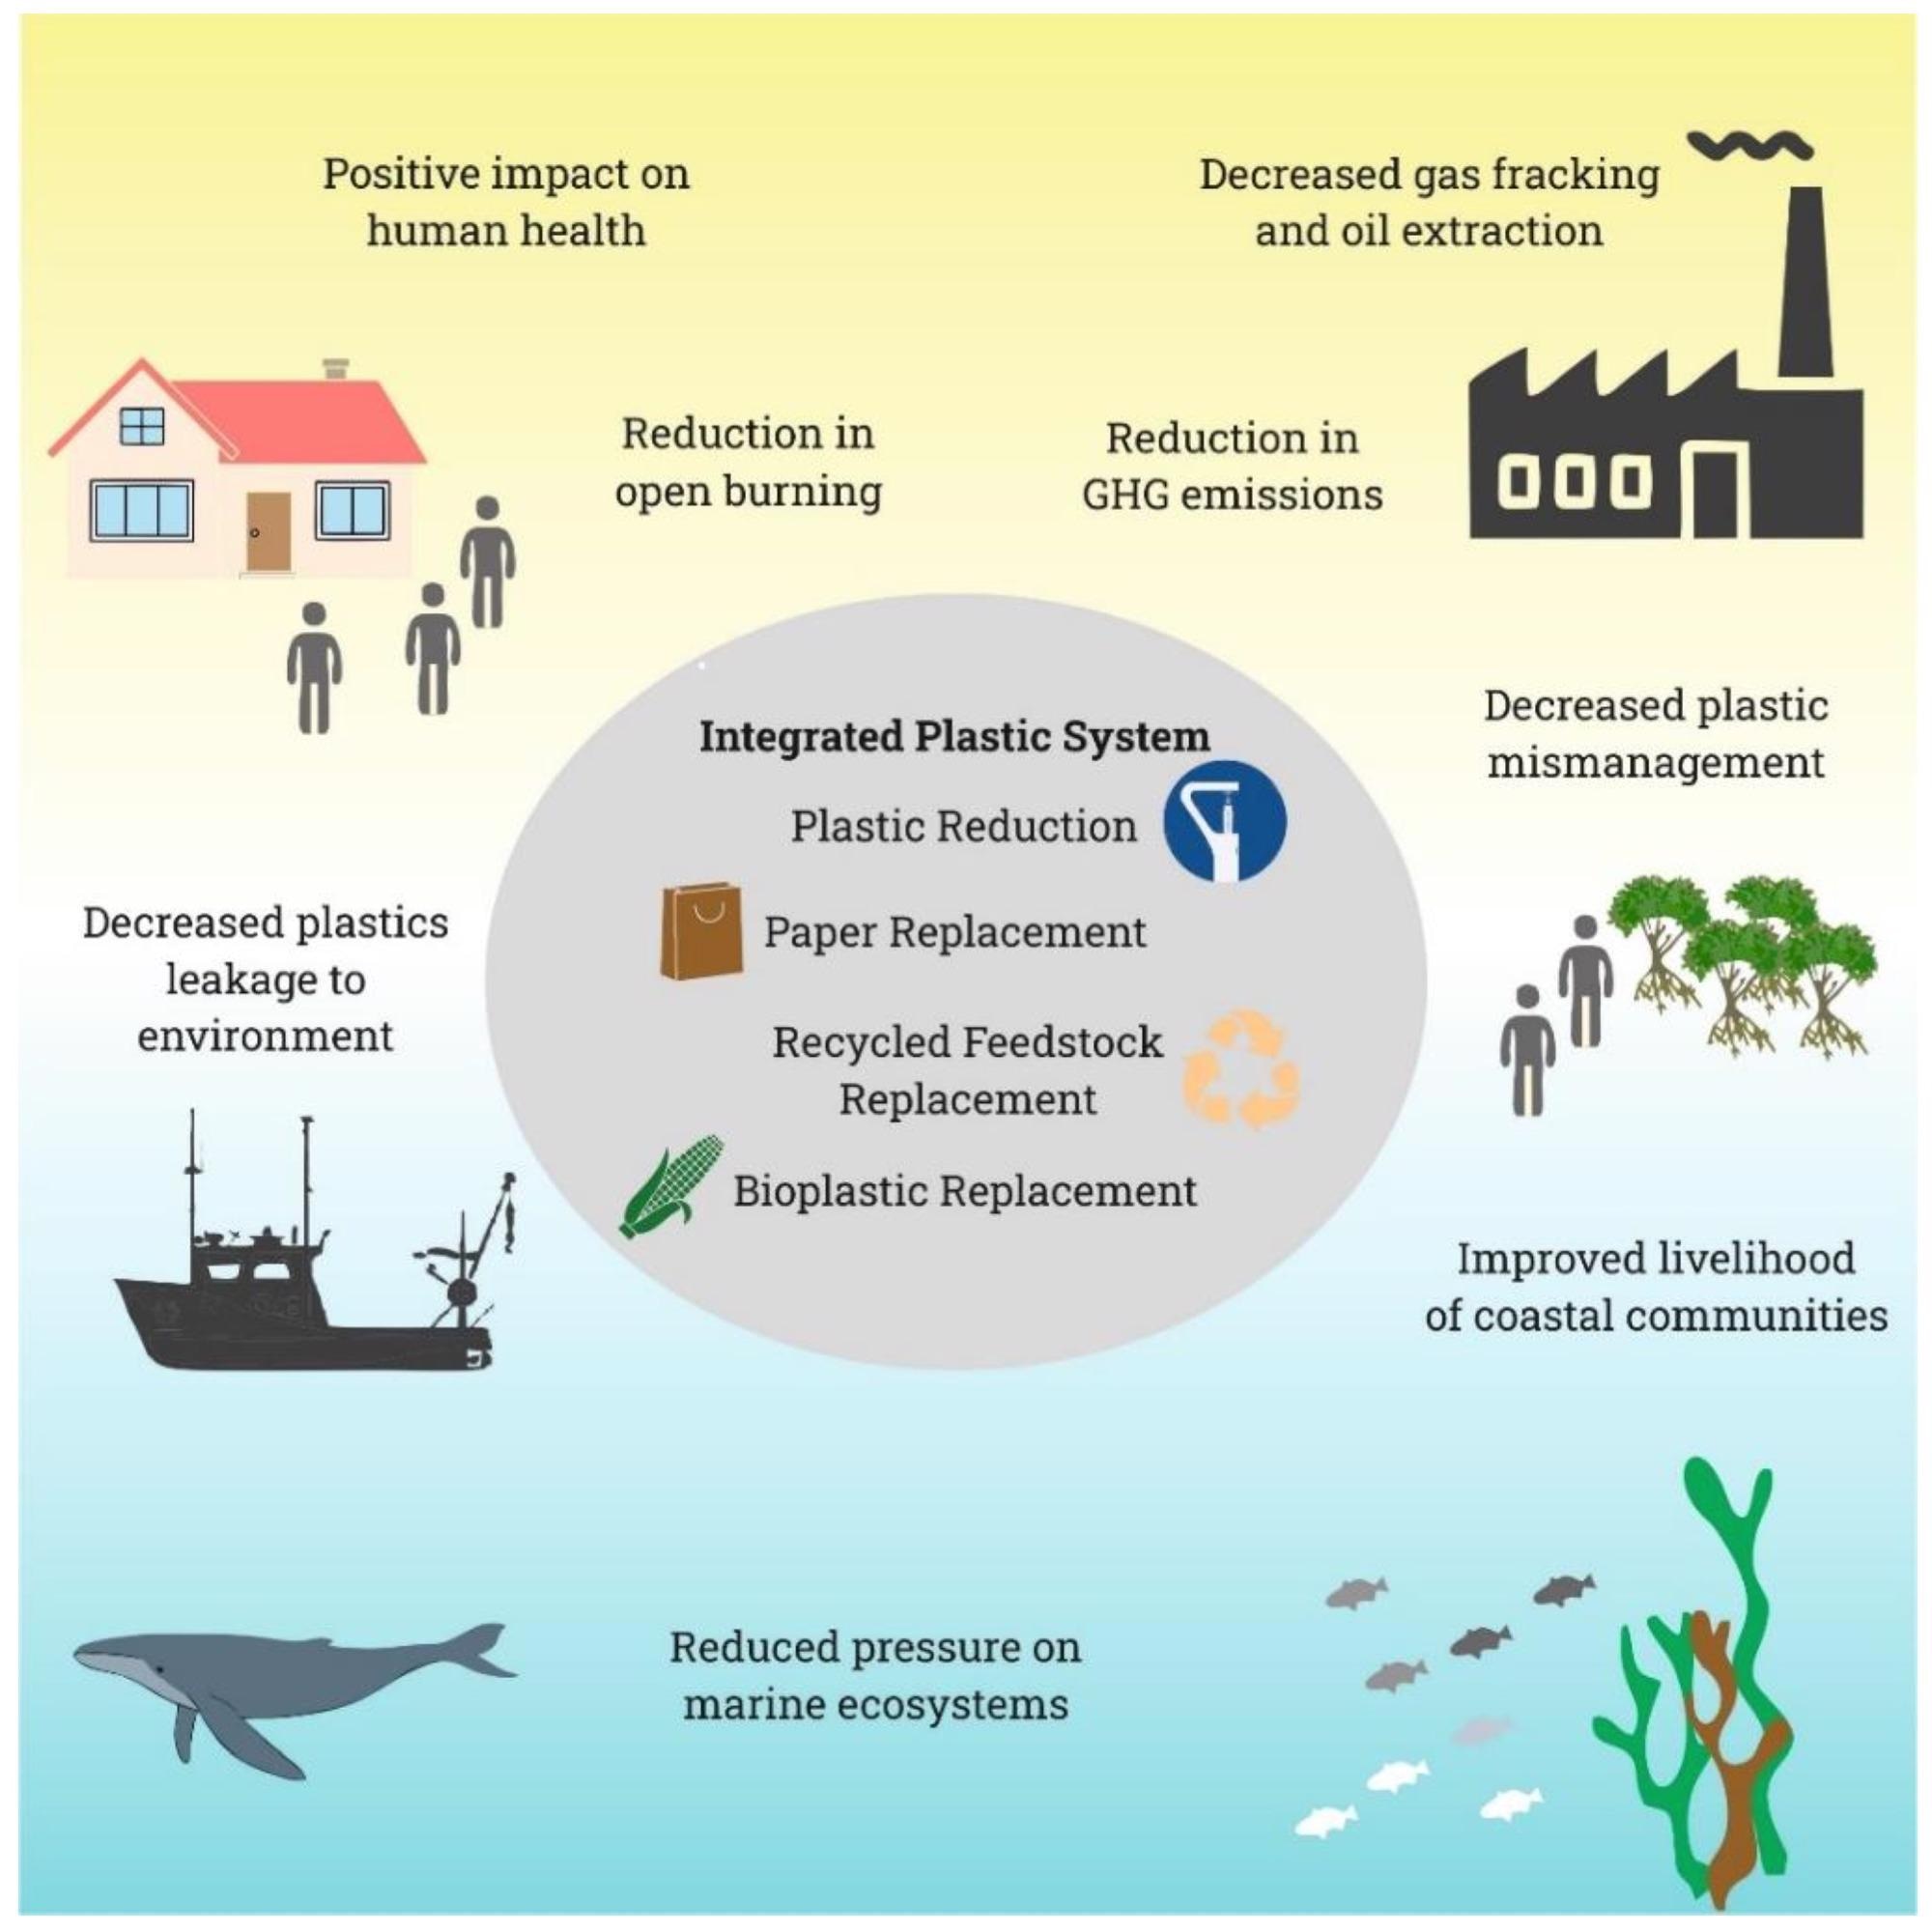
Figure 3. Socio-economic and environmental benefits from applying Integrated Plastic System solutions. Image Credit: Jankowska, et al., 2022
Plastic manufacturers must create an integrated approach integrating different actions to reach the climate objectives established in the Paris Agreement. This method eliminates duplicate counting in the plastics sector and across the system.
By creating new employment and reducing the quantity of unmanaged garbage and plastic waste seeping into the terrestrial and aquatic environment, Integrated Plastic System interventions can be linked to particular aims of the United Nations Sustainable Development Goals as explained in Figure 4.
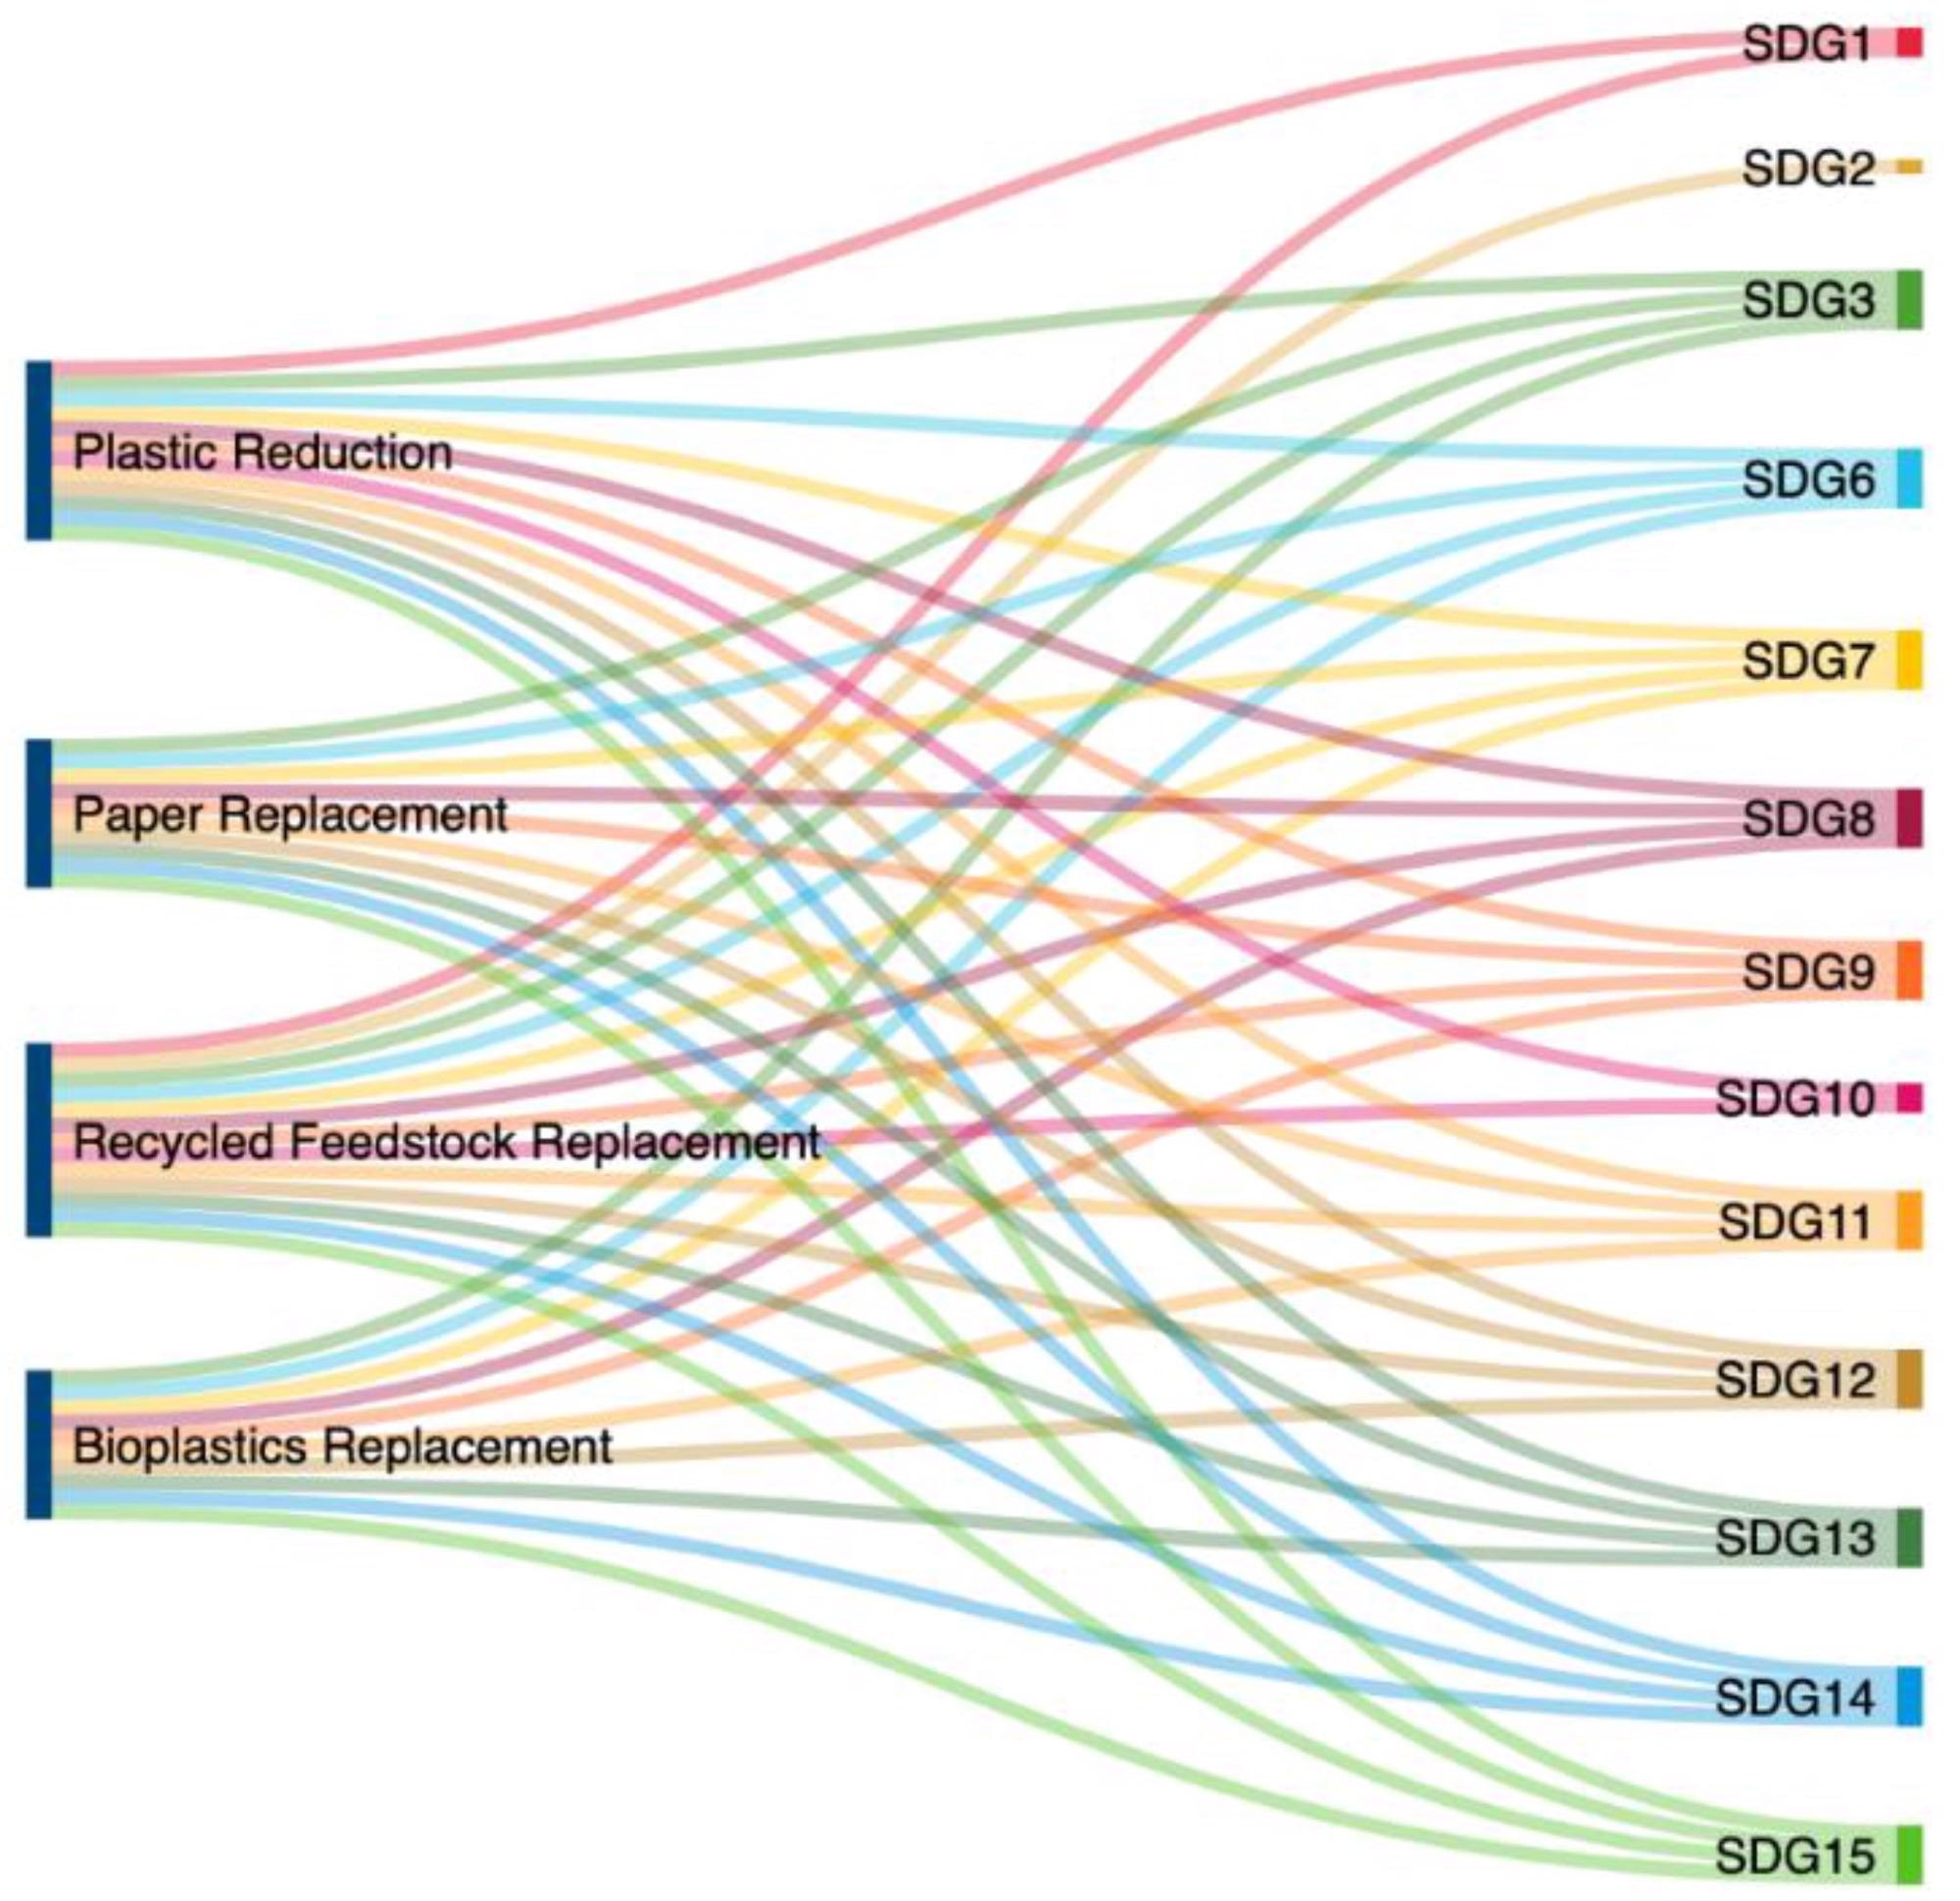
Figure 4. Integrated Plastic System solutions and its links to the United Nations Sustainable Development Goals. Image Credit: Jankowska, et al., 2022
Conclusion
Interventions aimed at reducing plastic pollution have major negative repercussions for the environment as well as human health. Limiting the manufacturing of non-durable plastic items can cut GHG emissions by 9.5–14.9 Gt CO2-eq over the next 30 years, helping to address the climate problem.
Lower production of plastics due to reduced demand and multiple distribution methods has the greatest climatic impact, followed by recycled plastic, and finally replacement with other materials (paper, bioplastic), which has the least potential for reducing emissions.
Many more advantages for humans and the environment will result from changing the plastic system, including aiding in the achievement of 13 Sustainable Development Goals.
Looking at the crisis of plastic pollution through the lens of the climate crisis opens up a slew of possibilities for politicians and other stakeholders to spur action toward a plastic-free future.
Journal Reference:
Jankowska, E, Gorman, M. R. and Frischmann, C. J. (2022) Transforming the Plastic Production System Presents Opportunities to Tackle the Climate Crisis. Sustainability. 14(11), 6539 Available Online: https://www.mdpi.com/2071-1050/14/11/6539/htm
References and Further Reading
- World Economic Forum. (2016) The New Plastics Economy Global Commitment 2019 Progress Report; Ellen MacArthur Foundation: Isle of Wight, UK.
- Plastic Europe. Plastics—The Facts 2020. (2022). Available at: https://plasticseurope.org/knowledge-hub/plastics-the-facts-2020/ .
- Shershneva, E.G (2021) Progressive Technologies of Waste Utilization as Drivers of Sustainable Development. IOP Conference Series: Materials Science and Engineering, 1079, p. 062044.
- Zheng, J & Suh, S (2019) Strategies to reduce the global carbon footprint of plastics. Nature Climate Change, 9, pp. 374–378. /doi.org/10.1038/s41558-019-0459-z.
- Kaza, S (2018) What a Waste 2.0: A Global Snapshot of Solid Waste Management to 2050; World Bank: Washington, DC, USA.
- Kaza, S., et al. (2016) Sustainable Financing and Policy Models for Municipal Composting; World Bank: Washington, DC, USA.
- Lau, W. W. Y., et al. (2020) Evaluating scenarios toward zero plastic pollution. Science, 369, 1455–1461. https://doi.org/10.1126/science.aba9475.
- Heller, M. C., et al. (2020) Plastics in the US: Toward a material flow characterization of production, markets and end of life. Environmental Research Letters, 15, p. 094034. doi.org/10.1088/1748-9326/ab9e1e.
- PEW Charitable Trust (2020) Breaking the Plastic Wave. A Comprehensive Assessment of Pathways Towards Stopping Ocean Platic Pollution; PEW Charitable Trust: Philadelphia, PA, USA.
- Azoulay, D., et al. (2019) Plastic and Health The Hidden Costs of A Plastic Planet; Center for International Environmental Law: Washington, DC, USA.
- Alabi, O. A., et al. (2019) Public and Environmental Health Effects of Plastic Wastes Disposal: A Review. Journal of Toxicology and Risk Assessment, 5, p. 021. doi.org/10.23937/2572-4061.1510021.
- Velis, C A & Cook, E (2021) Mismanagement of Plastic Waste through Open Burning with Emphasis on the Global South: A Systematic Review of Risks to Occupational and Public Health. Environmental Science & Technology, 55, pp. 7186–7207. doi.org/10.1021/acs.est.0c08536.
- Rochman, C M (2016) Strategies for reducing ocean plastic debris should be diverse and guided by science. Environmental Research Letters, 11, p. 041001.
- Lebreton, L., et al. (2019) A global mass budget for positively buoyant macroplastic debris in the ocean. Scientific Report, 9, p. 12922. doi.org/10.1038/s41598-019-49413-5.
- Hardesty, B. D., et al. (2021) Socioeconomics effects on global hotspots of common debris items on land and the seafloor. Global Environmental Change, 71, p. 102360. https://doi.org/10.1016/j.gloenvcha.2021.102360.
- Beaumont, N. J., et al. (2019) Global ecological, social and economic impacts of marine plastic. Marine Pollution Bulletin, 142, pp. 189–195. doi.org/10.1016/j.marpolbul.2019.03.022.
- Thushari, G G N & Senevirathna, J D M (2020) Plastic pollution in the marine environment. Heliyon, 6, p. e04709. doi.org/10.1016/j.heliyon.2020.e04709.
- Sigler, M (2014) The Effects of Plastic Pollution on Aquatic Wildlife: Current Situations and Future Solutions. Water Air & Soil Pollution, 225, p. 2184. doi.org/10.1007/s11270-014-2184-6.
- Verma, R., et al. (2016) Toxic Pollutants from Plastic Waste—A Review. Procedia Environmental Sciences, 35, pp. 701–708. doi.org/10.1016/j.proenv.2016.07.069.
- Thompson, R. C., et al. (2009) Plastics, the environment and human health: Current consensus and future trends. Philosophical Transactions of The Royal Society B Biological Sciences, 364, pp. 2153–2166. doi.org/10.1098/rstb.2009.0053.
- Wright, S L & Kelly, F J (2017) Plastic and Human Health: A Micro Issue? Environmental Sciences Technology, 51, pp. 6634–6647. doi.org/10.1021/acs.est.7b00423.
- Smith, M., et al. (2018) Microplastics in Seafood and the Implications for Human Health. Current Environmental Health Reports, 5, pp. 375–386. doi.org/10.1007/s40572-018-0206-z.
- Ali, S (2022) Bibliometric Analysis of Emerging Trends in Research on Microplastic Pollution in Post-Paris Agreement and Post-COVID-19 Pandemic World. In Microplastic Pollution. Emerging Contaminants and Associated Treatment Technologies; Hashmi, M.Z., Ed.; Springer: Berlin/Heidelberg, Germany, pp. 511–538. doi.org/10.1007/978-3-030-89220-3_23.
- Sharafat, A., et al. (2022) Strategic analysis of single-use plastic ban policy for environmental sustainability: The case of Pakistan. Clean Technologies and Environmental Policy, 24, pp. 843–849. doi.org/10.1007/s10098-020-02011-w.
- Borrelle, S. B., et al. (2020) Predicted growth in plastic waste exceeds efforts to mitigate plastic pollution. Science, 369, pp. 1515–1518. doi.org/10.1126/science.aba3656.
- Lebreton, L & Andrady, A (2019) Future scenarios of global plastic waste generation and disposal. Palgrave Communication, 5, pp. 1–11. doi.org/10.1057/s41599-018-0212-7.
- Material Economics (2022) Sustainable Packaging—The Role of Materials Substitution. 2018. Available online: https://materialeconomics.com/publications/sustainable-packaging .
- Mosko, S (2021) Bioplastics: Are They the Solution? 2021. Available online: https://www.resilience.org/stories/2012-10-19/bioplastics-are-they-the-solution/.
- Plastic Europe (2018) Plastics—The Facts 2018. Available online: https://plasticseurope.org/wp-content/uploads/2021/10/2018-Plastics-the-facts.pdf.
- Greenpeace (2020) Blog 1 Plastic Packaging and Leakage Still Double by 2050. Available online: https://www.greenpeace.org/usa/wp-content/uploads/2019/10/going-plastic-free-plastic-packaging-and-leakage-still-double-by-2050.pdf (accessed on 19 May 2022).
- Becqué, R & Sharp, S (2020) Phasing Out Plastics. The Packaging Sector. Available online: https://odi.org/en/publications/phasing-out-plastics/
- Shen, L., et al. (2009) Product Overview and Market Projection of Emerging Bio-Based Plastics; Scientific Research Publishing: Utrecht, The Netherlands.
- Patel, M. K., et al. (2006) Medium and Long-Term Opportunities and Risks of the Biotechnological Production of Bulk Chemicals from Renewable Resources; Technology and Society NWS, Copernicus Institute, Utrecht University: Utrecht, The Netherlands.
- Akiyama, M., et al. (2003) Environmental life cycle comparison of polyhydroxyalkanoates produced from renewable carbon resources by bacterial fermentation. Polymer Degradation and Stability, 80, pp. 183–194. doi.org/10.1016/S0141-3910(02)00400-7.
- Chen, G Q &Patel, M K (2012) Plastics Derived from Biological Sources: Present and Future: A Technical and Environmental Review. Chemical Review, 112, pp. 2082–2099. doi.org/10.1021/cr200162d.
- Groot, W J & Borén, T (2010) Life cycle assessment of the manufacture of lactide and PLA biopolymers from sugarcane in Thailand. The International Journal of Life Cycle Assessment, 15, pp. 970–984. doi.org/10.1007/s11367-010-0225-y.
- Yates, M R & Barlow, C Y (2013) Life cycle assessments of biodegradable, commercial biopolymers—A critical review. Resources, Conservation and Recycling, 78, pp. 54–66. doi.org/10.1016/j.resconrec.2013.06.010.
- Shen, L., et al. (2012) Comparing life cycle energy and GHG emissions of bio-based PET, recycled PET, PLA, and man-made cellulosics: Modeling and Analysis: Comparing life-cycle energy and GHG emissions of bioproducts. Biofuels, Bioproducts and Biorefining, 6, pp. 625–639. https://doi.org/10.1002/bbb.1368.
- Greene, J P (2014) Sustainable Plastics Environmental Assessments of Biobased, Biodegradable, and Recycled Plastics; Wiley: Hoboken, NJ, USA.
- Kinsell, A (2012) Paperwork—Comparing Recycled to Virgin Paper; Environmental Paper Network: Asheville, NC, USA.
- Grimes, S., et al. (2015) BIR—Report on the Environmental Benefits of Recycling—2016 Edition; Bureau of International Recycling: Brussels, Belgium.
- European Environmental Paper Network (2013) Paper Efficiency Scored; European Environmental Paper Network: Asheville, NC, USA.
- Diaz, R & Warith, M (2006) Life-cycle assessment of municipal solid wastes: Development of the WASTED model. Waste Management, 26, pp. 886–901. doi.org/10.1016/j.wasman.2005.05.007.
- Brogaard, L. K. S., et al. (2014) Evaluation of life cycle inventory data for recycling systems. Resources, Conservation and Recycling, 87, pp. 30–45. doi.org/10.1016/j.resconrec.2014.03.011.
- Ford, J (2009) Carbon Neutral Paper, Fact or Fiction? A Report on the GHG Emissions of Paper Products; European Environmental Paper Network: Asheville, NC, USA.
- Laurijssen, J., et al. (2010) Paper and biomass for energy? Resources, Conservation and Recycling, 54, 1208–1218. doi.org/10.1016/j.resconrec.2010.03.016.
- EPA (2015) Opportunities to Reduce Greenhouse Gas Emissions through Materials and Land Management Practices; U.S. Environmental Protection Agency: Washington, DC, USA.
- CEPI (Confederation of European Paper Industries) (2018) Key Statistics 2018; European Pulp & Paper Industry: Brussels, Belgium.
- Merrild, H., et al. (2009) Recycling of paper: Accounting of greenhouse gases and global warming contributions. Waste Management & Research: The Journal for a Sustainable Circular Economy, 27, pp. 746–753. doi.org/10.1177%2F0734242X09348530.
- Hillman, K., et al. (2015) Climate Benefits of Material Recycling: Inventory of Average Greenhouse Gas Emissions for Denmark, Norway and Sweden; Nordic Council of Ministers: Copenhagen, Denmark.
- Shultz, T.; Suresh, A. Life Cycle Assesment Ocomparing Ten Sources of Manmade Cellulose Fiber. SCS Global Services Final Report. Emeryville. 2015. Available at: https://cdn.scsglobalservices.com/files/resources/SCS-Stella-LCA-MainReport-101017.pdf.
- Gemechu, E. D., et al. (2013)A comparison of the GHG emissions caused by manufacturing tissue paper from virgin pulp or recycled waste paper. The International Journal of Life Cycle Assessment, 18, pp. 1618–1628. https://doi.org/10.1007/s11367-013-0597-x.
- More Recycling. NERC Webinar, Recycling Markets. 2021. Available at : https://www.youtube.com/watch?v=z4C01elgIWU.
- Hottle, T. A., et al. (2013) Sustainability assessments of bio-based polymers. Polymer Degradation and Stability, 98, pp. 1898–1907. doi.org/10.1016/j.polymdegradstab.2013.06.016.
- Vink, E. T. H., et al. (2003) Applications of life cycle assessment to NatureWorksTM polylactide (PLA) production. Polymer Degradation and Stability, 80, pp. 403–419. doi.org/10.1016/S0141-3910(02)00372-5.
- Dornburg, V., et al. (2003) Comparing the Land Requirements, Energy Savings, and Greenhouse Gas Emissions Reduction of Biobased Polymers and Bioenergy. Journal of Industrial Ecology, 7, pp. 93–116. doi.org/10.1162/108819803323059424.
- Project Drawdown (2022) Available at: https://drawdown.org/
- European Bioplastics. Bioplastics Facts and Figures. 2018. Availableat : https://docs.european-bioplastics.org/publications/EUBP_Facts_and_figures.pdf.
- IfBB (2018) Biopolymers Facts and Statistics: 2018 Production Capacities, Processing Routes, Feedstock, Land and Water Use; Institute for Bioplastics and Biocomposites, Hochschule Hannover: Hannover, Germany.
- Material Economics (2018) The Circular Economy. A Powerful Force for Climate Mitigation; Material Economics: Stockholm, Sweden.
- Khoironi, A., et al. (2019) Community behavior and single-use plastic bottle consumption. IOP Conference Series: Earth and Environmental Science. 293, p. 012002.
- OECD. Extended Producer Responsibility. 2021. Available online: https://www.oecd.org/env/tools-evaluation/extendedproducerresponsibility.htm
- Ellen Macarthur Foundation. (2012) Towards the Circular Economy; Ellen Macarthur Foundation: Isle of Wight, UK, 1.
- Vallette, J (2021) The New Coal. Plastic & Climate Change; Beyond Plastic: Bennington, VT, USA.
- Eurostat. Packaging Waste by Waste Management Operations and Waste Flow, 1997–2017. 2020. Available at: https://ec.europa.eu/eurostat/cache/metadata/en/env_waspac_esms.htm (accessed on 19 May 2022).
- D’Ambrières, W (2019) Plastics recycling worldwide: Current overview and desirable changes. Field Actions Science Reports, 19, pp. 12–21.
- Woodring, D &Hyde, T. (2022) Recycled Plastic: There’s Market Demand, but Where’s the Supply? Available online: https://www.greenbiz.com/article/recycled-plastic-theres-market-demand-wheres-supply.
- Posen, I.D., et al. (2017) Greenhouse gas mitigation for U.S. plastics production: Energy first, feedstocks later. Environment Research Letters. 12, 034024.
- Escobar, N., et al. (2018) Land use mediated GHG emissions and spillovers from increased consumption of bioplastics. Environment Research Letters, 13, p. 125005.
- Brizga, J., et al. (2020) The Unintended Side Effects of Bioplastics: Carbon, Land, and Water Footprints. One Earth, 3, pp. 45–53. doi.org/10.1016/j.oneear.2020.06.016.
- Haque, A N M A & Naebe, M (2021) Flexible water-resistant semi-transparent cotton gin trash/poly (vinyl alcohol) bio-plastic for packaging application: Effect of plasticisers on physicochemical properties. Journal of Cleaner Production, 303, p. 126983. https://doi.org/10.1016/j.jclepro.2021.126983.
- EIA. Petroleum & Other Liquids (2021). Available at: https://www.eia.gov/petroleum/
- CIEL (2018) The Long-Term Prospects for the Plastics Boom: Untested Assumptions and Unanswered Questions in the Plastics Boom; Center for International Environmental Law: Washington, DC, USA.
- James, G (2019) The Plastics Landscape: Risks and Opportunities Along the Value Chain; The Principles for Responsible Investment: London, UK.
- Filho, W. L., et al. (2019) An overview of the problems posed by plastic products and the role of extended producer responsibility in Europe. Journal of Cleaner Production, 214, pp. 550–558. doi.org/10.1016/j.jclepro.2018.12.256.
- Jambeck, J., et al. (2015) Plastic waste inputs from land into the ocean. Science, 347, pp. 768–771. doi.org/10.1126/science.1260352.
- Ocean Conservancy; McKinsey&Co (2015) Stemming the Tide: Land-Based Strategies for a Plastic-Free Ocean; Ocean Conservancy: Washington, DC, USA.
- Lebreton, L., et al. (2018) Evidence that the Great Pacific Garbage Patch is rapidly accumulating plastic. Scientific Reports, 8, p. 4666. https://doi.org/10.1038/s41598-018-22939-w.
- Hale, R. C., et al. (2020) A Global Perspective on Microplastics. Journal of Geophysical Research: Oceans, 125, p. e2018JC014719. doi.org/10.1029/2018JC014719.
- Lusher, A., et al. (2017) Microplastics in Fisheries and Aquaculture. Status of Knowledge on Their Occurrence and Implications for Aquatic Organisms and Food Safety; Food and Agriculture Organization of the United Nations: Rome, Italy.
- Frischmann, C. J., et al. (2020) Drawdown’s ‘System of Solutions’ Helps to Achieve the SDGs. In Partnerships for the Goals; Filho, W.L., Azul, A.M., Brandli, L., Lange Salvia, A., Wall, T., Eds.; Springer: Berlin/Heidelberg, Germany, pp. 1–25.
- United Nations, Departament of Economic and Social Affairs (2022) The 17 Goals.
- EPA United States Environmental Protection Agency (2021) Plastics: Material-Specific Data. Available at : https://www.epa.gov/facts-and-figures-about-materials-waste-and-recycling/plastics-material-specific-data
- World Economic Forum (2016) The New Plastics Economy: Rethinking the Future of Plastics.. Available at : https://www.weforum.org/reports/the-new-plastics-economy-rethinking-the-future-of-plastics/
- Lewis, K. A New Industrial Revolution for Plastics. (2019). Available at : https://www.usda.gov/media/blog/2018/09/19/new-industrial-revolution-plastics