Every year, tons of food waste (FW) are dumped throughout the world, with China producing roughly 110 million tons of FW. FW has a lot of moisture, salt, oil, and fat, and it is rapidly rancidified, resulting in unpleasant aromas and harmful microorganisms. This article looks at a recent study published in Sustainability detailing the production of hydrogen using food waste.
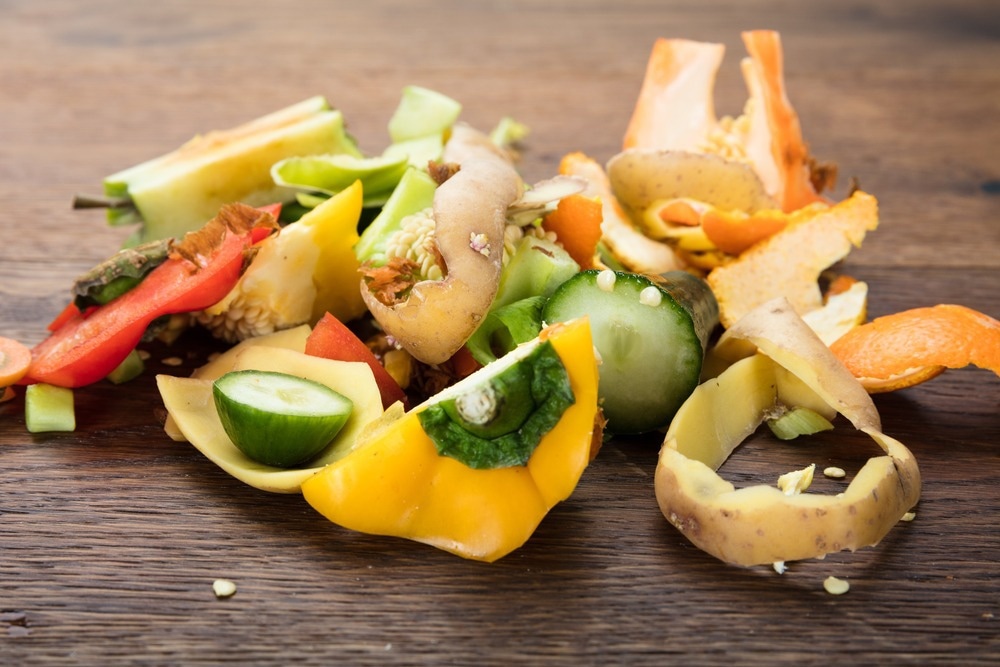
Image Credit: Andrey_Popov/Shutterstock.com
Incineration, sanitary landfills, aerobic composting, and anaerobic fermentation are some of the traditional FW disposal options. Biogases, such as hydrogen and methane, are renewable, and ecologically beneficial, and clean biofuels and anaerobic fermentation reduce the possibility of secondary contamination.
The waste created by natural littering or manual trimming of garden plants, such as dead branches, fallen leaves, weeds, as well as other plant detritus, is referred to as garden waste (GW).
GW has lower moisture content and a higher pH (~7) than FW (4~6), and it is a carbon-rich raw material with an excellent C/N ratio and a high proportion of difficult-to-biodegrade carbohydrates such as cellulose and hemicellulose.
Long fermentation periods and poor organic matter conversion rates occur when GW is utilized as the sole input material for anaerobic fermentation. Uncooked pre-dinner leftovers from kitchens, such as vegetable stalks, eggshells, and raw meat, are commonly referred to as kitchen waste (KW).
Since FW is a nitrogen-rich raw material, co-fermenting it with carbon-rich raw materials like GW or KW to create hydrogen may efficiently modify the C/N ratio and the ratio of easily degradable to difficult-to-degrade components in a single raw material.
The temperature and solid content of the substrate can impact the hydrogen generation efficiency of anaerobic fermentation, which can be separated into wet and dry fermentation. Dry anaerobic fermentation provides many advantages to wet anaerobic fermentation, including lower water use and increased gas generation per unit volume.
The authors of this study employed multicomponent material combinations and thermophilic dry anaerobic fermentation to boost anaerobic fermentation’s organic matter bioconversion rates and hydrogen generation efficiency.
Methodology
The FW, KW, and GW were gathered from the cafeteria of the Chinese Academy of Sciences’ Shanghai Advanced Research Institute and submitted to physicochemical examination. To limit the biogas produced by the inoculum during the experiment, it was starved at 55 °C before usage.
Table 1 lists the physicochemical properties of each experimental material and inoculum.
Table 1. Characteristics of FW, GW, KW and inoculum. Source: Wang, et al., 2022
| Characteristics |
FW |
GW |
KW |
Inoculum |
| TS (%, wet basis) |
28.83 ± 0.49 |
59.03 ± 0.81 |
26.19 ± 0.27 |
3.45 ± 0.08 |
| VS (%, wet basis) |
24.33 ± 0.44 |
46.77 ± 1.10 |
24.32 ± 0.67 |
2.15 ± 0.04 |
| VS/TS (%) |
84.41 |
79.23 |
92.90 |
62.32 |
| TOC (%, dry basis) |
39.67 ± 1.66 |
58.10 ± 1.23 |
33.48 ± 0.75 |
29.29 ± 0.58 |
| TN (%, dry basis) |
2.03 ± 0.04 |
1.04 ± 0.01 |
1.35 ± 0.07 |
4.36 ± 0.11 |
| C/N |
19.54 |
55.89 |
24.80 |
6.72 |
| pH |
5.51 ± 0.05 |
6.98 ± 0.09 |
4.80 ± 0.03 |
8.47 ± 0.06 |
| Soluble salt (%, dry basis) |
7.68 ± 0.74 |
1.25 ± 0.32 |
2.86 ± 0.88 |
1.18 ± 0.57 |
| Starch (%, dry basis) |
37.61 ± 1.91 |
0 |
27.33 ± 0.78 |
N.D. |
| Cellulose (%, dry basis) |
7.52 ± 0.55 |
31.91 ± 1.23 |
10.45 ± 0.85 |
N.D. |
| Hemicellulose (%, dry basis) |
4.52 ± 0.06 |
8.52 ± 0.15 |
6.40 ± 0.23 |
N.D. |
| Lignin (%, dry basis) |
3.34 ± 0.12 |
28.67 ± 1.33 |
3.77 ± 0.06 |
N.D. |
| Crude fat (%, dry basis) |
30.66 ± 2.11 |
1.40 ± 0.96 |
23.77 ± 2.07 |
N.D. |
| Crude protein (%, dry basis) |
12.69 ± 0.93 |
6.50 ± 0.07 |
8.44 ± 0.16 |
N.D. |
Note: TS: total solid; VS: volatile solid; TOC: total organic carbon; TN: total nitrogen; N.D.: not detected. Values indicate the means ± standard deviation based on triplicate determination.
Batch experiments for thermophilic dry anaerobic fermentation were conducted according to the AMPTS Operation Manual utilizing an automatic methane potential test system (AMPTS) (AMPTS II, Bioprocess, Sweden).
The AMPTS is divided into four sections: (A) fermentation unit, which includes a water bath and fifteen 500-mL glass fermentation bottles; (B) CO2 absorption unit, which includes fifteen 100-mL absorption bottles with NaOH solution as a CO2 and H2S absorbent; (C) gas volume measurement unit, which measures the volume of gas not absorbed by alkaline solution, such as hydrogen or methane; and (D) digital online monitoring unit, which obtains daily biogas production and cumulative biogas production online digital surveillance system.
Table 2 shows the mixing ratios of FW to GW (or KW) based on VS content: 100:0, 80:20, 60:40, 50:50, 40:60, 20:80, and 0:100.
Table 2. Different mixing ratios of FW to GW as well as FW and KW for thermophilic dry anaerobic fermentations. Source: Wang, et al., 2022
| Item |
Exp. I |
Item |
Exp. II |
| FW + GW |
Inoculum/g |
FW + KW |
Inoculum/g |
| FG100:0 |
100% FW + 0% GW |
120 |
FK100:0 |
100% FW + 0% KW |
120 |
| FG80:20 |
80% FW + 20% GW |
120 |
FK80:20 |
80% FW + 20% KW |
120 |
| FG60:40 |
60% FW + 40% GW |
120 |
FK60:40 |
60% FW + 40% KW |
120 |
| FG50:50 |
50% FW + 50% GW |
120 |
FK50:50 |
50% FW + 50% KW |
120 |
| FG40:60 |
40% FW + 60% GW |
120 |
FK40:60 |
40% FW + 60% KW |
120 |
| FG20:80 |
20% FW + 80% GW |
120 |
FK20:80 |
20% FW + 80% KW |
120 |
| FG0:100 |
0% FW + 100% GW |
120 |
FK0:100 |
0% FW + 100% KW |
120 |
The amount of hydrogen generated in this study are calculated using conventional temperature and pressure conditions (273 K and 1 atm). The standard volume per gram initial VS added was used to standardize daily and cumulative hydrogen generation. All of the tests were done in duplicate, and the samples were collected to be analyzed further.
A gas chromatography (GC) system with a Rtx-Wax quartz capillary column and a hydrogen flame ionization detector was used to test volatile fatty acids. A thermal conductivity detector was used to test the presence of hydrogen.
Results
FW and GW are waste products generated in everyday living. Through synergistic dry anaerobic fermentation, FW and GW can be coupled to create hydrogen.
Figure 1a shows the cumulative hydrogen generation values for the synergistic dry anaerobic fermentation of FW and GW.
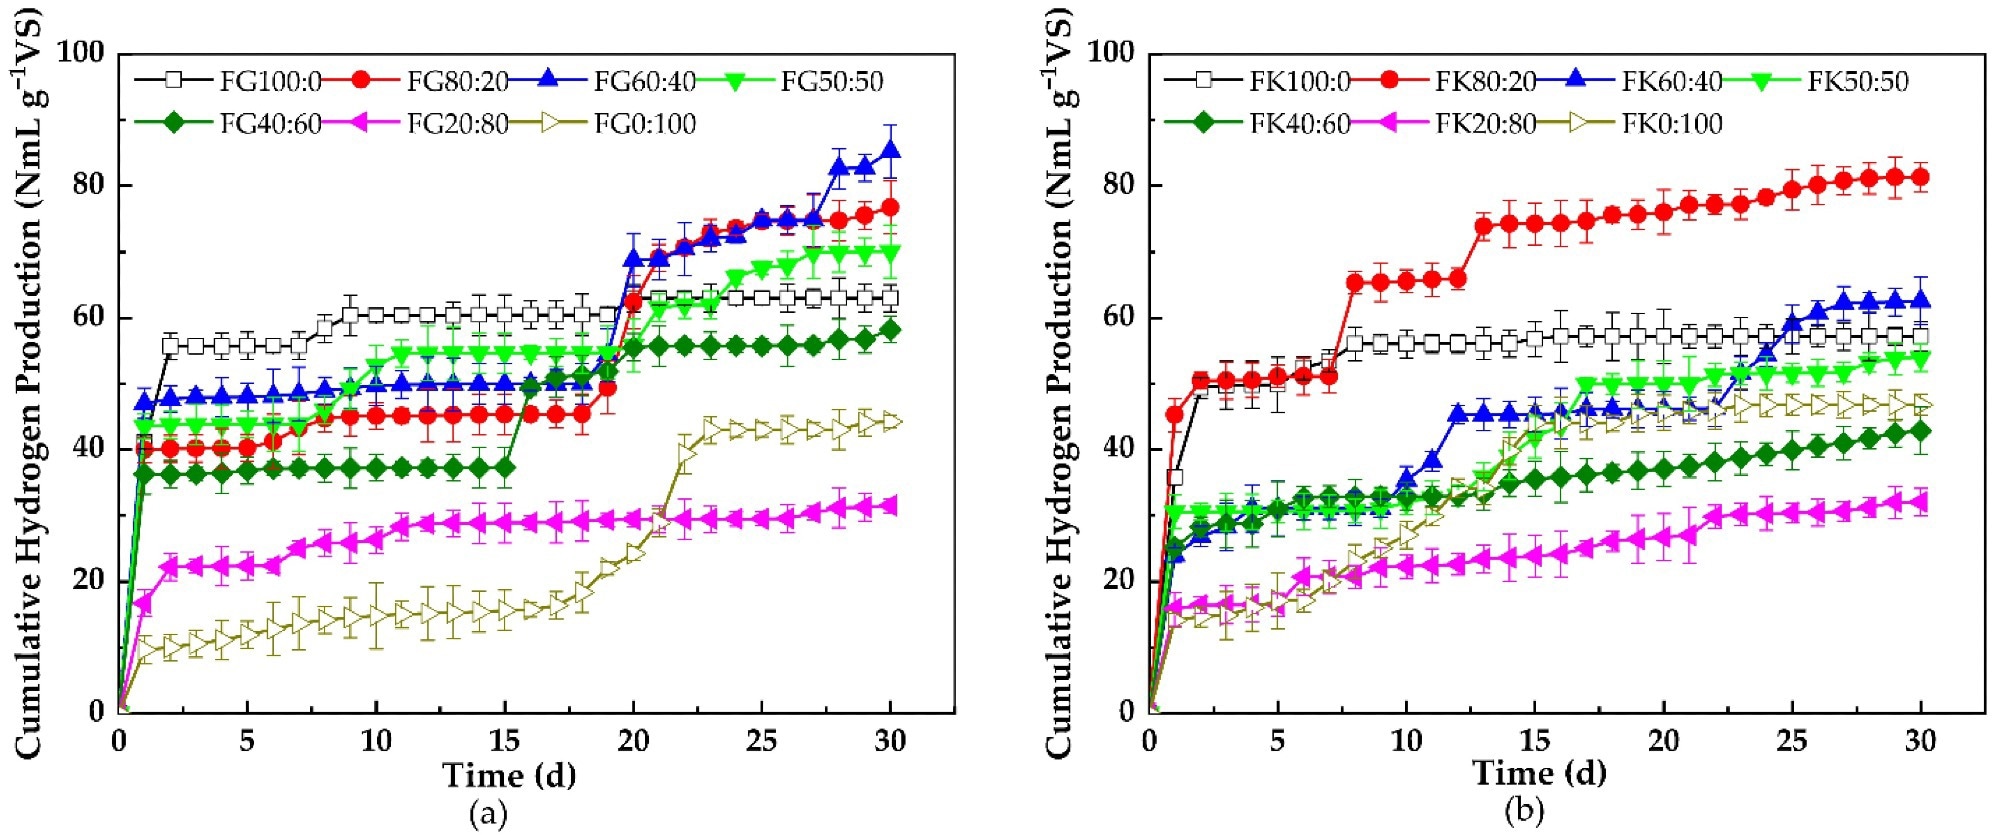
Figure 1. Cumulative hydrogen production for the thermophilic dry anaerobic co-fermentation of (a) FW + GW and (b) FW + KW. Image Credit: Wang, et al., 2022
When FW was employed as a sole substrate for dry anaerobic fermentation, it became rancid and eventually failed. The cumulative hydrogen generation was maximum when GW was utilized as a single substrate for dry anaerobic fermentation and FW and GW were blended in 60:40, as shown in Figure 2a. Synergistic dry fermentation using FW and GW improved hydrogen generation efficiency, according to the findings.
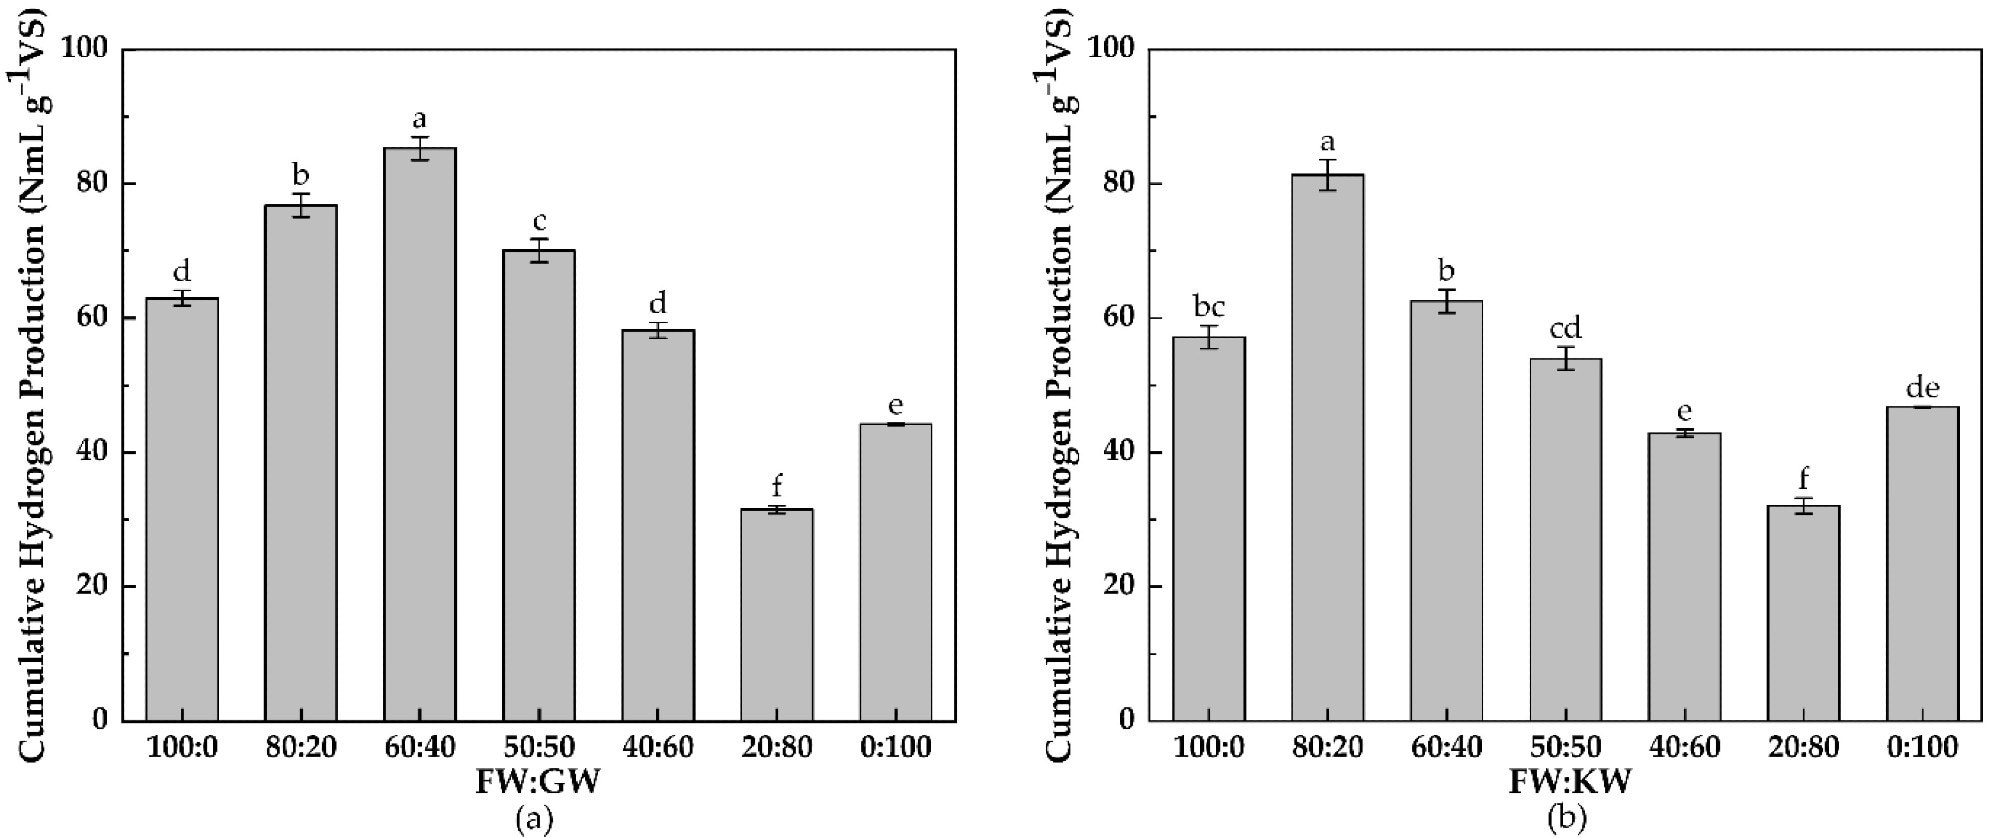
Figure 2. Cumulative hydrogen production on the 30th day for the thermophilic dry anaerobic co-fermentation of (a) FW + GW and (b) FW + KW. Letters indicate significant differences between the different mixing ratios (p < 0.05). Image Credit: Wang, et al., 2022
Uncooked, pre-dinner leftovers from kitchens are referred as KW. Hydrogen can be produced via anaerobic co-fermentation of FW and KW.
Only minor quantities of hydrogen were created during the first eight days when FW was employed as a sole substrate for dry anaerobic fermentation. During 30 days of dry anaerobic fermentation, FW’s total hydrogen production was only 57.17 NmL g–1 VS.
When KW was employed as a sole substrate for dry anaerobic fermentation, hydrogen was generated progressively for the first 15 days, but only a little amount of hydrogen was produced after that.
Synergistic dry fermentation with FW and KW enhanced hydrogen generation efficiency, as per the findings.
Figure 3a shows the daily hydrogen generation quantities from the synergistic dry anaerobic fermentation of FW and GW. Each fermentation group’s hydrogen output rose quickly after being inoculated with anaerobic digestion effluent, reaching its maximum daily hydrogen production on the first day.
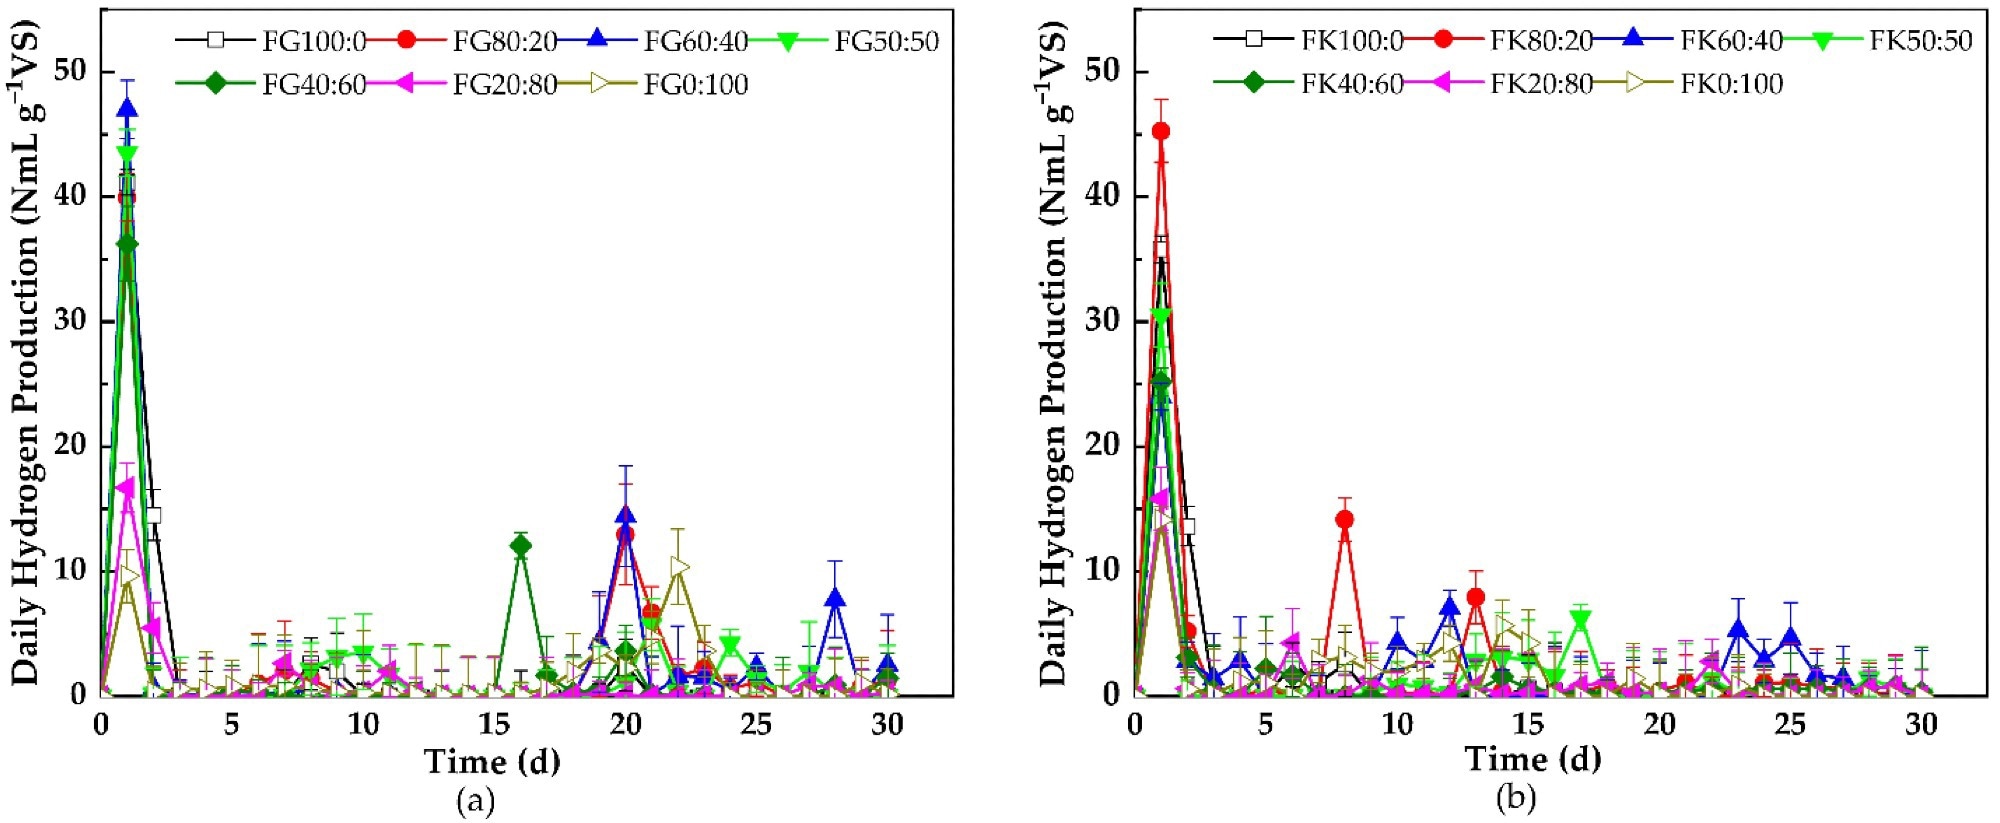
Figure 3. Daily hydrogen production for the thermophilic dry anaerobic co-fermentation of (a) FW + GW and (b) FW + KW. Image Credit: Wang, et al., 2022
On the 20th day, the daily hydrogen production for the group with FW:GW of 60:40 achieved a second high of 14.44 NmL g–1 VS, and on the 28th day, it reached a third peak of 7.78 NmL g–1 VS.
However, just one gas production peak developed during the whole course of fermentation of FW or GW as a single substrate. Within the first 10 days, around 60% of total hydrogen production was created, following which daily hydrogen production continued to decline until the fermentation was completed.
The daily hydrogen generation values for the combined dry anaerobic fermentation of FW and KW are shown in Figure 3b. The fermentation produced the most hydrogen on a daily basis, with an FW/KW ratio of 80:20.
It is to be noted that only one hydrogen generation peak developed during the whole fermentation process with a single substrate.
Biodegradable substrates undergo a sequence of reactions during dry anaerobic fermentation to create VFAs and other compounds that hydrogenogens can easily utilize.
The effectiveness of substrate hydrolysis and VFA usage is reflected in the VS and TS elimination rates. Figure 4a shows the variations in VS content during the dry anaerobic co-fermentation of FW and GW, with the VS content of each ratio trending lower.
The VS content of co-fermented FW or GW fermentations was much lower than that of solo FW or GW fermentations. Figure 4b depicts the variations in VS content during the dry anaerobic co-fermentation of FW and KW. The 80:20 group had the greatest reduction in VS content.
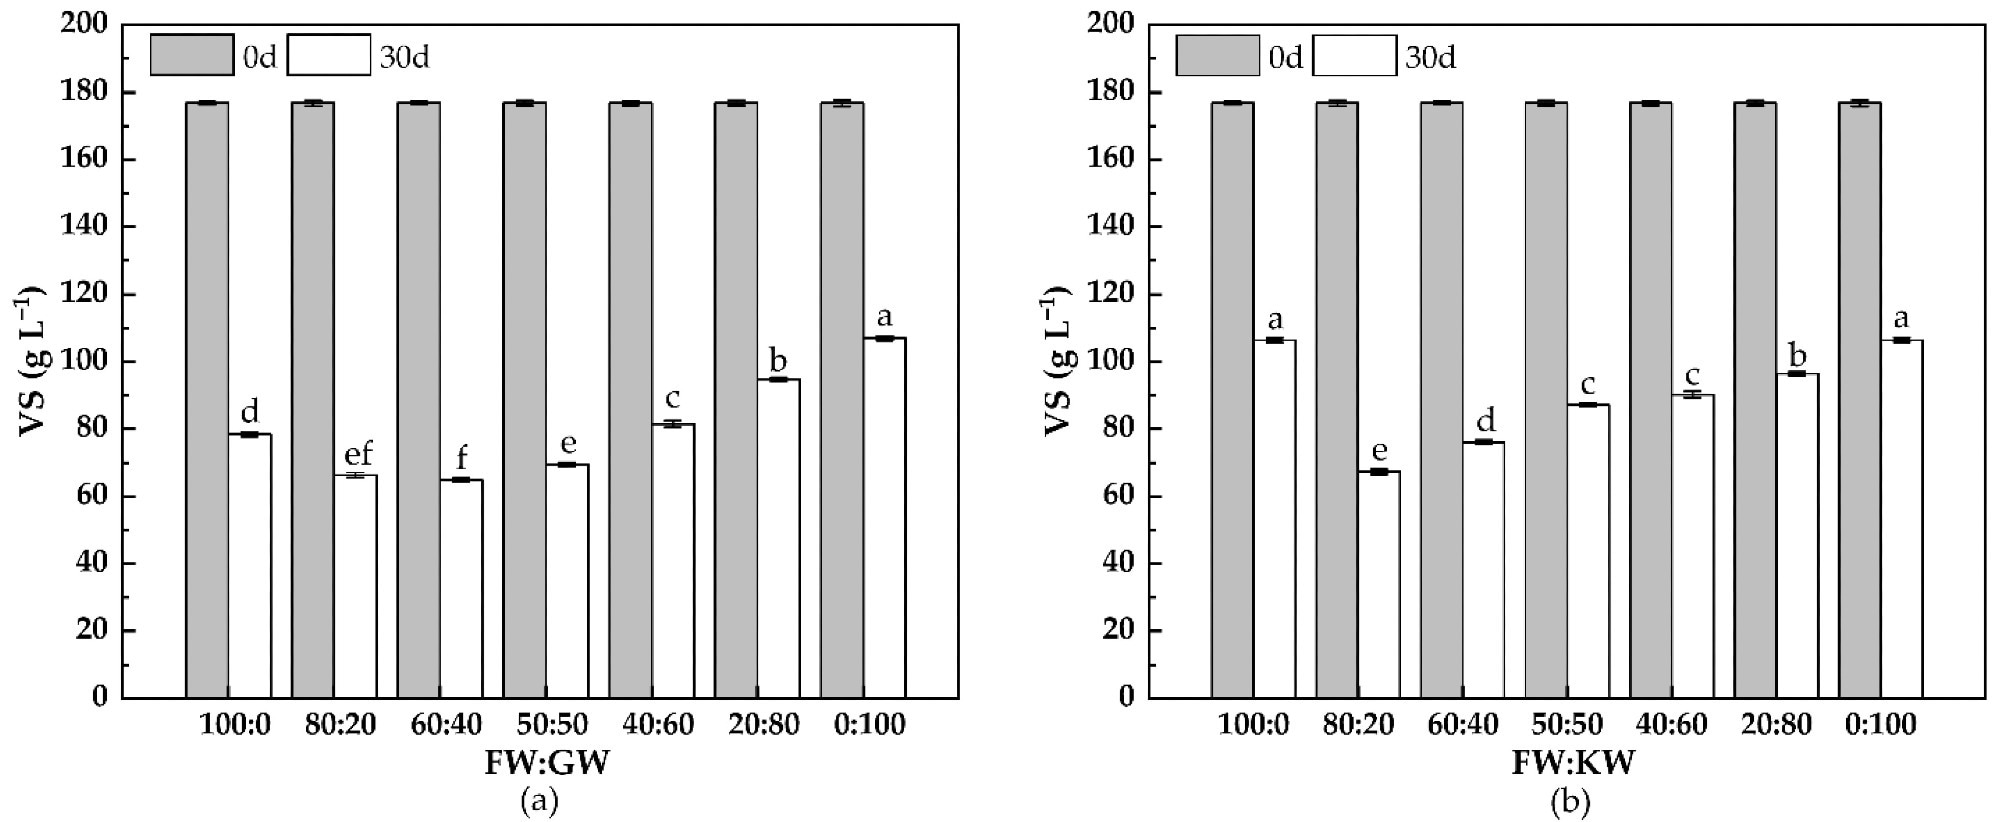
Figure 4. Changes in the VS contents for the thermophilic dry anaerobic co-fermentation of (a) FW + GW and (b) FW + KW. Letters indicate significant differences between the different mixing ratios (p < 0.05). Image Credit: Wang, et al., 2022
Figure 5a depicts the variations in TS content during the dry anaerobic co-fermentation of FW and GW. The TS concentrations for each ratio likewise showed decreased trends after 30 days of fermentation. Figure 5b depicts the variations in TS content during the dry anaerobic co-fermentation of FW and KW.
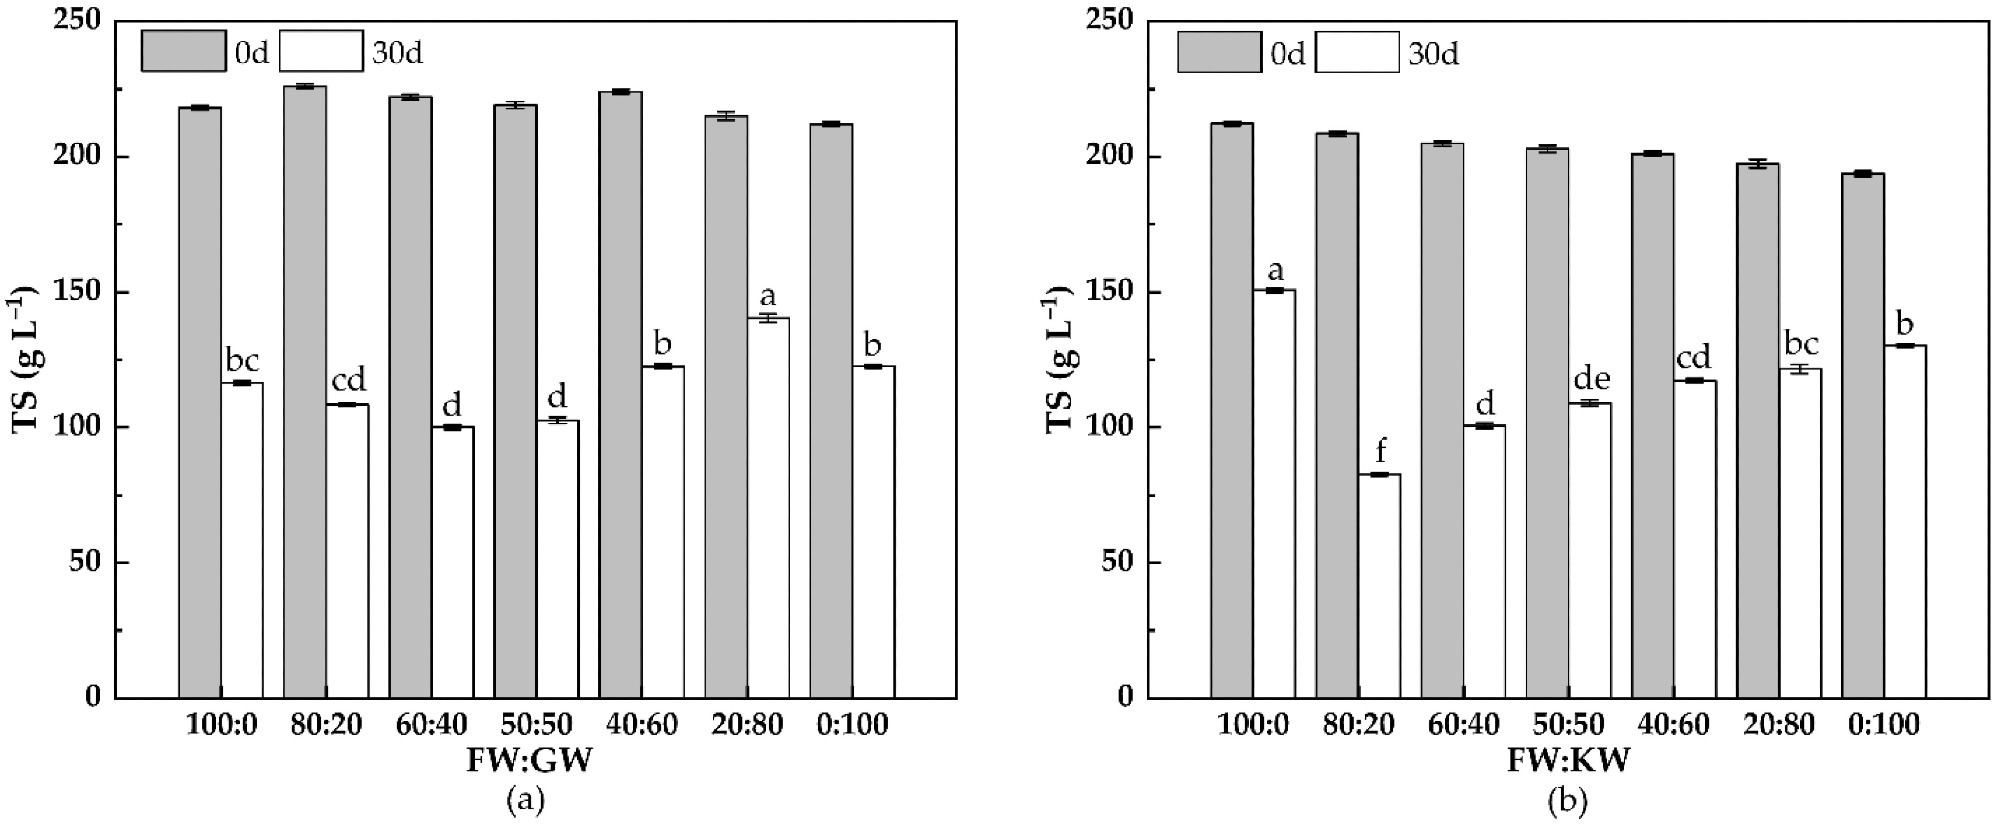
Figure 5. Changes in the TS contents for the thermophilic dry anaerobic co-fermentation of (a) FW + GW and (b) FW + KW. Letters indicate significant differences between the different mixing ratios (p < 0.05). Image Credit: Wang, et al., 2022
The organic matter removal rates for FW and GW’s combined thermophilic dry anaerobic fermentation are shown in Figure 6a. The organic matter clearance rate of the collaborative thermophilic dry anaerobic fermentation of FW and GW was greater than the single dry anaerobic fermentation of GW and the single dry anaerobic fermentation of FW.
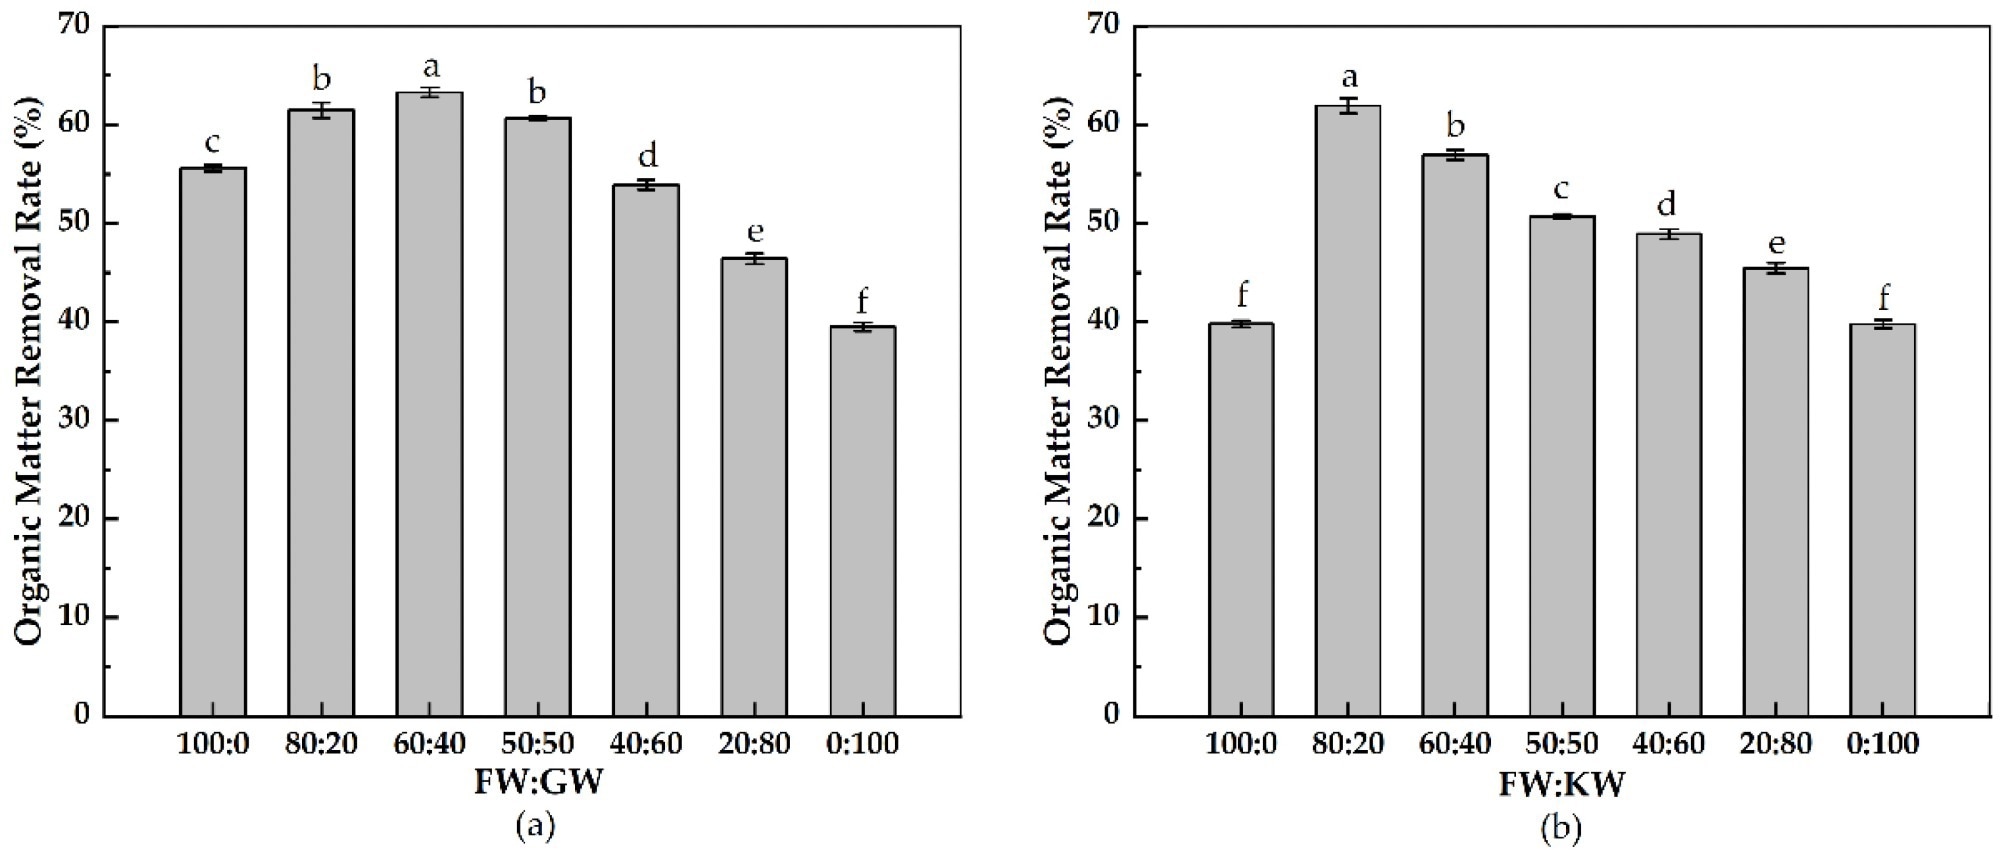
Figure 6. Organic matter removal rates for the thermophilic dry anaerobic co-fermentation of (a) FW + GW and (b) FW + KW. Letters indicate significant differences between the different mixing ratios (p < 0.05). Image Credit: Wang, et al., 2022
Carbon and nitrogen are required for the development and metabolism of bacteria in anaerobic fermentation. Microbial population expansion needs a proper C/N ratio, but too high or too low C/N ratios in the substrate inhibit microbial growth and metabolism, resulting in lower anaerobic fermentation efficiency.
The C/N ratios for dry anaerobic co-fermentation of FW and GW are shown in Figure 7a. The largest degradation potential was seen when the mixing ratio of FW to GW was 60:40, indicating that the best C/N ratio of FW to GW for co-fermentation was 37.20, with the C/N ratio terminating at 22.62 after 30 days of fermentation.
Figure 7b presents the data that explain the influence of C/N ratios on the anaerobic co-fermentation of FW and KW.
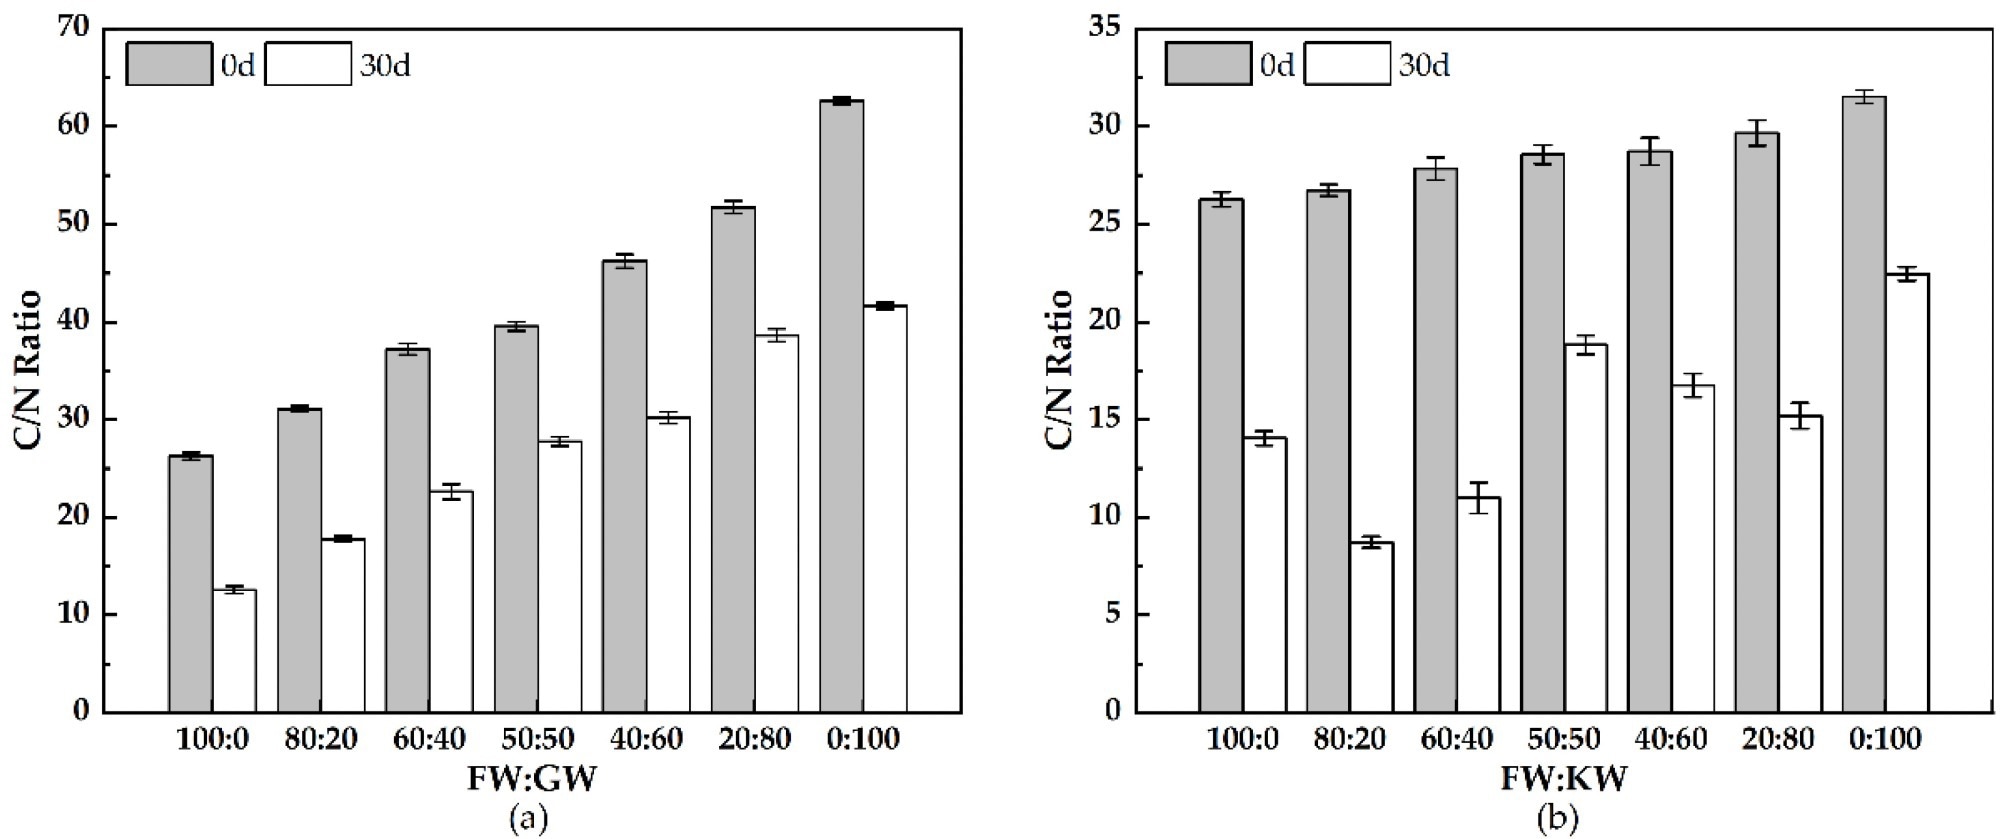
Figure 7. C/N ratios for the thermophilic dry anaerobic co-fermentation of (a) FW + GW and (b) FW + KW. Image Credit: Wang, et al., 2022
The best C/N ratio for co-fermentation of FW and KW was 26.73, because the 80:20 group demonstrated the highest degradation potential. The C/N ratio of the 80:20 group was the lowest after 30 days of fermentation, at just 8.73.
Conclusion
In comparison to single FW fermentation, thermophilic dry anaerobic co-fermentation of FW with GW or KW as co-substrate increased cumulative hydrogen generation by 35.42% and 42.22% respectively.
Co-fermentation, on the other hand, removed 1.14 and 1.55 times more organic matter than single FW fermentation. Hence, GW and KW would be ideal co-substrates for anaerobic fermentation of FW, due to their high hydrogen production and excellent biodegradability, which can be achieved by adjusting the C/N ratio, salt content, and the ratio of difficult-to-biodegrade components to easily degradable components in the substrate.
Journal Reference:
Wang, N., Chui, C., Zhang, S., Liu, Q., Li, B., Shi, J. and Liu, L. (2022) Hydrogen Production by the Thermophilic Dry Anaerobic Co-Fermentation of Food Waste Utilizing Garden Waste or Kitchen Waste as Co-Substrate. Sustainability. 14(12), 7367 Available Online: https://www.mdpi.com/2071-1050/14/12/7367/htm
References and Further Reading
- Lv, Y., et al. (2021) Anaerobic co-digestion of food waste with municipal solid waste leachate: A review and prospective application with more benefits. Resources, Conservation and Recycling, 174, p. 105832. doi.org/10.1016/j.resconrec.2021.105832.
- He, X.Z., et al. (2019) Characteristics of acidogenic fermentation for volatile fatty acid production from food waste at high concentrations of NaCl. Bioresource Technology, 271, pp. 244–250. doi.org/10.1016/j.biortech.2018.09.116.
- Wang, P., et al. (2022) Metatranscriptomic insight into the effects of antibiotic exposure on performance during anaerobic co-digestion of food waste and sludge. Journal of Hazardous Materials, 423, p, 127163. doi.org/10.1016/j.jhazmat.2021.127163.
- Yin, C.H., et al. (2013) Economic production of probiotics from kitchen waste. Food Science and Biotechnology, 22, pp. 59–63. doi.org/10.1007/s10068-013-0049-1.
- Sun, C., et al. (2020) Enhancement on methane production and anaerobic digestion stability via co-digestion of microwave-Ca(OH)(2) pretreated sugarcane rind slurry and kitchen waste. Journal of Cleaner Production, 264, p. 121731. doi.org/10.1016/j.jclepro.2020.121731.
- Zhang, L., et al. (2019) Enhanced biogas production from anaerobic digestion of solid organic wastes: Current status and prospects. Bioresource Technology Reports, 5, pp. 280–296. doi.org/10.1016/j.biteb.2018.07.005
- Zhai, N.N., et al. (2015) of initial pH on anaerobic co-digestion of kitchen waste and cow manure. Waste Management, 38, 126–131. doi.org/10.1016/j.wasman.2014.12.027
- Izumi, K., et al. (2010) Effects of particle size on anaerobic digestion of food waste. International Biodeterioration & Biodegradation, 64, pp. 601–608. doi.org/10.1016/j.ibiod.2010.06.013
- Xing, B.S., et al. (2020) Stable and high-rate anaerobic co-digestion of food waste and cow manure: Optimisation of start-up conditions. Bioresource Technology, 307, 122887. doi.org/10.1016/j.biortech.2020.123195
- Li, Y.Y., et al. (2016) Current situation and development of kitchen waste treatment in China. In Proceedings of the 10th International Conference on Waste Management and Technology (ICWMT), Mianyang, China, 28–30 October; pp. 40–49
- Zhang, X., et al. (2019) Influence of the void fraction and vertical gas vents on the waste decomposition in semi-aerobic landfill: Lab-scale tests. Waste Management, 100, pp. 28–35. doi.org/10.1016/j.wasman.2019.08.039
- Eriksson, M., et al. (2017) Quantification of food waste in public catering services—A case study from a Swedish municipality. Waste Management, 61, pp. 415–422. doi.org/10.1016/j.wasman.2017.01.035
- Sun, S.K., et al. (2018) Impacts of food wastage on water resources and environment in China. Journal of Cleaner Production, 185, pp. 732–739. doi.org/10.1016/j.jclepro.2018.03.029
- Anjum, M., et al. (2018) Visible light photocatalytic disintegration of waste activated sludge for enhancing biogas production. Journal of Environmental Management, 216, pp. 120–127. doi.org/10.1016/j.jenvman.2017.07.064
- Anjum, M., et al. (2016) Wastewater sludge stabilization using pre-treatment methods. Process Safety and Environmental Protection, 102, pp. 615–632. doi.org/10.1016/j.psep.2016.05.022
- Abubackar, H.N., et al. (2019). Effects of size and autoclavation of fruit and vegetable wastes on biohydrogen production by dark dry anaerobic fermentation under mesophilic condition. International Journal of Hydrogen Energy, 44, pp. 17767–17780. doi.org/10.1016/j.ijhydene.2019.05.106
- Abreu, A.A., et al. (2019) Garden and food waste co-fermentation for biohydrogen and biomethane production in a two-step hyperthermophilic-mesophilic process. Bioresource Technology, 278, pp. 180–186. doi.org/10.1016/j.biortech.2019.01.085
- Giwa, A.S., et al. (2022) Characterization and Environmental Impacts of Kitchen Wastes from Food-Waste Disposer Device. Environmental Engineering and Management Journal, 21, pp. 137–144.
- Yang, G., et al. (2019) Biohydrogen production from co-fermentation of fallen leaves and sewage sludge. Bioresource Technology, 285, p. 121342. doi.org/10.1016/j.biortech.2019.121342
- Gupta, P., et al. (2012) Study on biogas production by anaerobic digestion of garden-waste. Fuel, 95, 495–498. doi.org/10.1016/j.fuel.2011.11.006
- Shen, F., et al. (2013) Performances of anaerobic co-digestion of fruit & vegetable waste (FVW) and food waste (FW): Single-phase vs. two-phase. Bioresource Technology, 144, pp. 80–85. doi.org/10.1016/j.biortech.2013.06.099
- Gao, S.M., et al. (2015) Evaluation the anaerobic digestion performance of solid residual kitchen waste by NaHCO3 buffering. Energy Conversion and Management, 93, pp. 166–174. doi.org/10.1016/j.enconman.2015.01.010
- Elsamadony, M & Tawfik, A (2015) Potential of biohydrogen production from organic fraction of municipal solid waste (OFMSW) using pilot-scale dry anaerobic reactor. Bioresource Technology, 196, pp. 9–16. doi.org/10.1016/j.biortech.2015.07.048
- Zhao, G., et al. (2012) Using rice straw fermentation liquor to produce bioflocculants during an anaerobic dry fermentation process. Bioresource Technology, 113, pp. 83–88. doi.org/10.1016/j.biortech.2011.11.040
- Chen, X., et al. (2014) Comparison of high-solids to liquid anaerobic co-digestion of food waste and green waste. Bioresource Technology, 154, pp. 215–221. doi.org/10.1016/j.biortech.2013.12.054
- Xu, F.Q., et al. (2018) Anaerobic digestion of food waste—Challenges and opportunities. Bioresource Technology, 247, pp. 1047–1058. doi.org/10.1016/j.biortech.2017.09.020
- Wang, Y., et al. (20200 Hydrogen production performance from food waste using piggery anaerobic digested residues inoculum in long-term systems. International Journal of Hydrogen Energy, 45, pp. 33208–33217. doi.org/10.1016/j.ijhydene.2020.09.057
- Baird, R.B., et al. (2017) Standard Methods for the Examination of Water and Wastewater, 23rd ed.; American Public Health Association: Washington, DC, USA.
- Mizuta, K., et al. (2015) Soil aggregate formation and stability induced by starch and cellulose. Soil Biology and Biochemistry, 87, pp. 90–96. doi.org/10.1016/j.soilbio.2015.04.011
- Holm, J., et al. (1986) A rapid method for the analysis of starch. Starch-Starke 1986, 38, pp. 224–226. doi.org/10.1002/star.19860380704
- He, Y.F., et al. (2008) Physicochemical characterization of rice straw pretreated with sodium hydroxide in the solid state for enhancing biogas production. Energy Fuels, 22, pp. 2775–2781. doi.org/10.1021/ef8000967
- Sluiter, A., et al. (2008) Determination of structural carbohydrates and lignin in biomass. Laboratory Analytical Proceedings, 1617, pp. 1–16.
- Thiex, N.J., et al. (2003) Crude fat, diethyl ether extraction, in feed, cereal grain, and forage (Randall/Soxtec/submersion method): Collaborative study. Journal of Aoac International, 86, pp. 888–898. doi.org/10.1093/jaoac/86.5.888
- Hall, N G & Schonfeldt, H C (2013) Total nitrogen vs. amino-acid profile as indicator of protein content of beef. Food Chemistry, 140, pp. 608–612. doi.org/10.1016/j.foodchem.2012.08.046
- Yang, L., et al. (2022) Lactic acid production from mesophilic and thermophilic fermentation of food waste at different pH. Journal of Environmental Management, 304, p. 114312. doi.org/10.1016/j.jenvman.2021.114312
- Chui, C., et al. (2021) Hydrogen production by thermophilic dry anaerobic fermentation of food waste and fruit and vegetable waste. Food Ferment. Ind, 47, pp. 240–245.