Sponsored by TOFWERKReviewed by Emily MageeMar 22 2023
VOCs can be reliably examined in different environments using chemical ionization mass spectrometers. But when a compound has been masked by either an isobaric or isomeric interference, this exhibits ambiguity in the analysis.
Interferences initiate uncertainty in mass spectrum peak identification since there is no definitive measurement of the structures adding up to a mass spectrum peak. For example, this is a common problem in flavor and fragrance chemistry, where a single molecular formula (ion) might exist in various isomeric forms.
Every ion is significant as they exclusively contribute to the flavor or fragrance. Figure 1 shows two vanillin isomers—methyl paraben and methyl salicylate. To isolate and distinguish between such isomers, mass spectrometry should be supplemented with one more dimension of separation
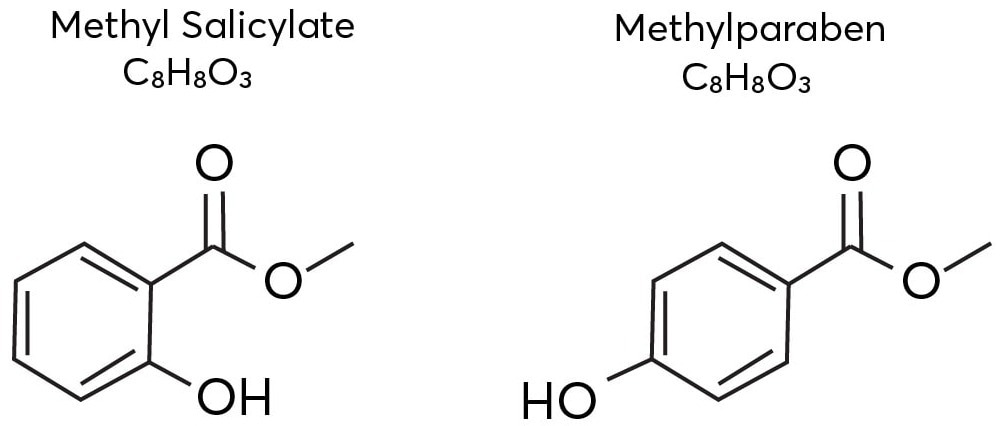
Figure 1. The isomeric structures of methyl salicylate and methylparaben. Image Credit: TOFWERK.
While distinct isomers have to be resolved, ion mobility spectrometry (IMS) is a method that could be utilized jointly with mass spectrometry. IMS distinguishes between ions that take structures that vary in their rotationally averaged collision cross sections (average molecular size).
With the help of Vocus IMS-MS, analytes have been ionized by chemical ionization, and the consequent ions are isolated by their collision cross sections before mass analysis. This offers two-dimensional data—the mass-to-charge ratio and cross section-related IMS. This deconvolutes several isobaric or isomeric components in a single mass spectrum peak.
Operation of the Vocus CI-IMS-TOF
Figure 2 shows a schematic of TOFWERK’s Vocus CI-IMS-TOF. In this instrument, ions are produced by the Vocus ion source before they are directed into the IMS separation chamber. The chamber has been purged with an inert buffer gas (helium, nitrogen, etc.) and retained at a pressure of 3 mbar.
The ions are shifted along a 9-m serpentine path with the help of technology developed at the Pacific Northwest National Laboratory for lossless ion manipulations (SLIM).1 The movement of ions has been regulated by using weak electric fields.
Ions with small collision cross sections travel via the buffer gas with reduced friction and come to the drift region's end sooner than ions with bigger collision cross sections.
The time an ion spends traveling via the IMS drift region is called the IMS drift time, which is connected to a molecule’s collision cross-section.
Two modes of operation is offered by TOFWERK’s Vocus CI-IMS-TOF. The first mode bypasses the IMS, efficiently enabling the user to execute MS-only measurements (blue path in Figure 2).
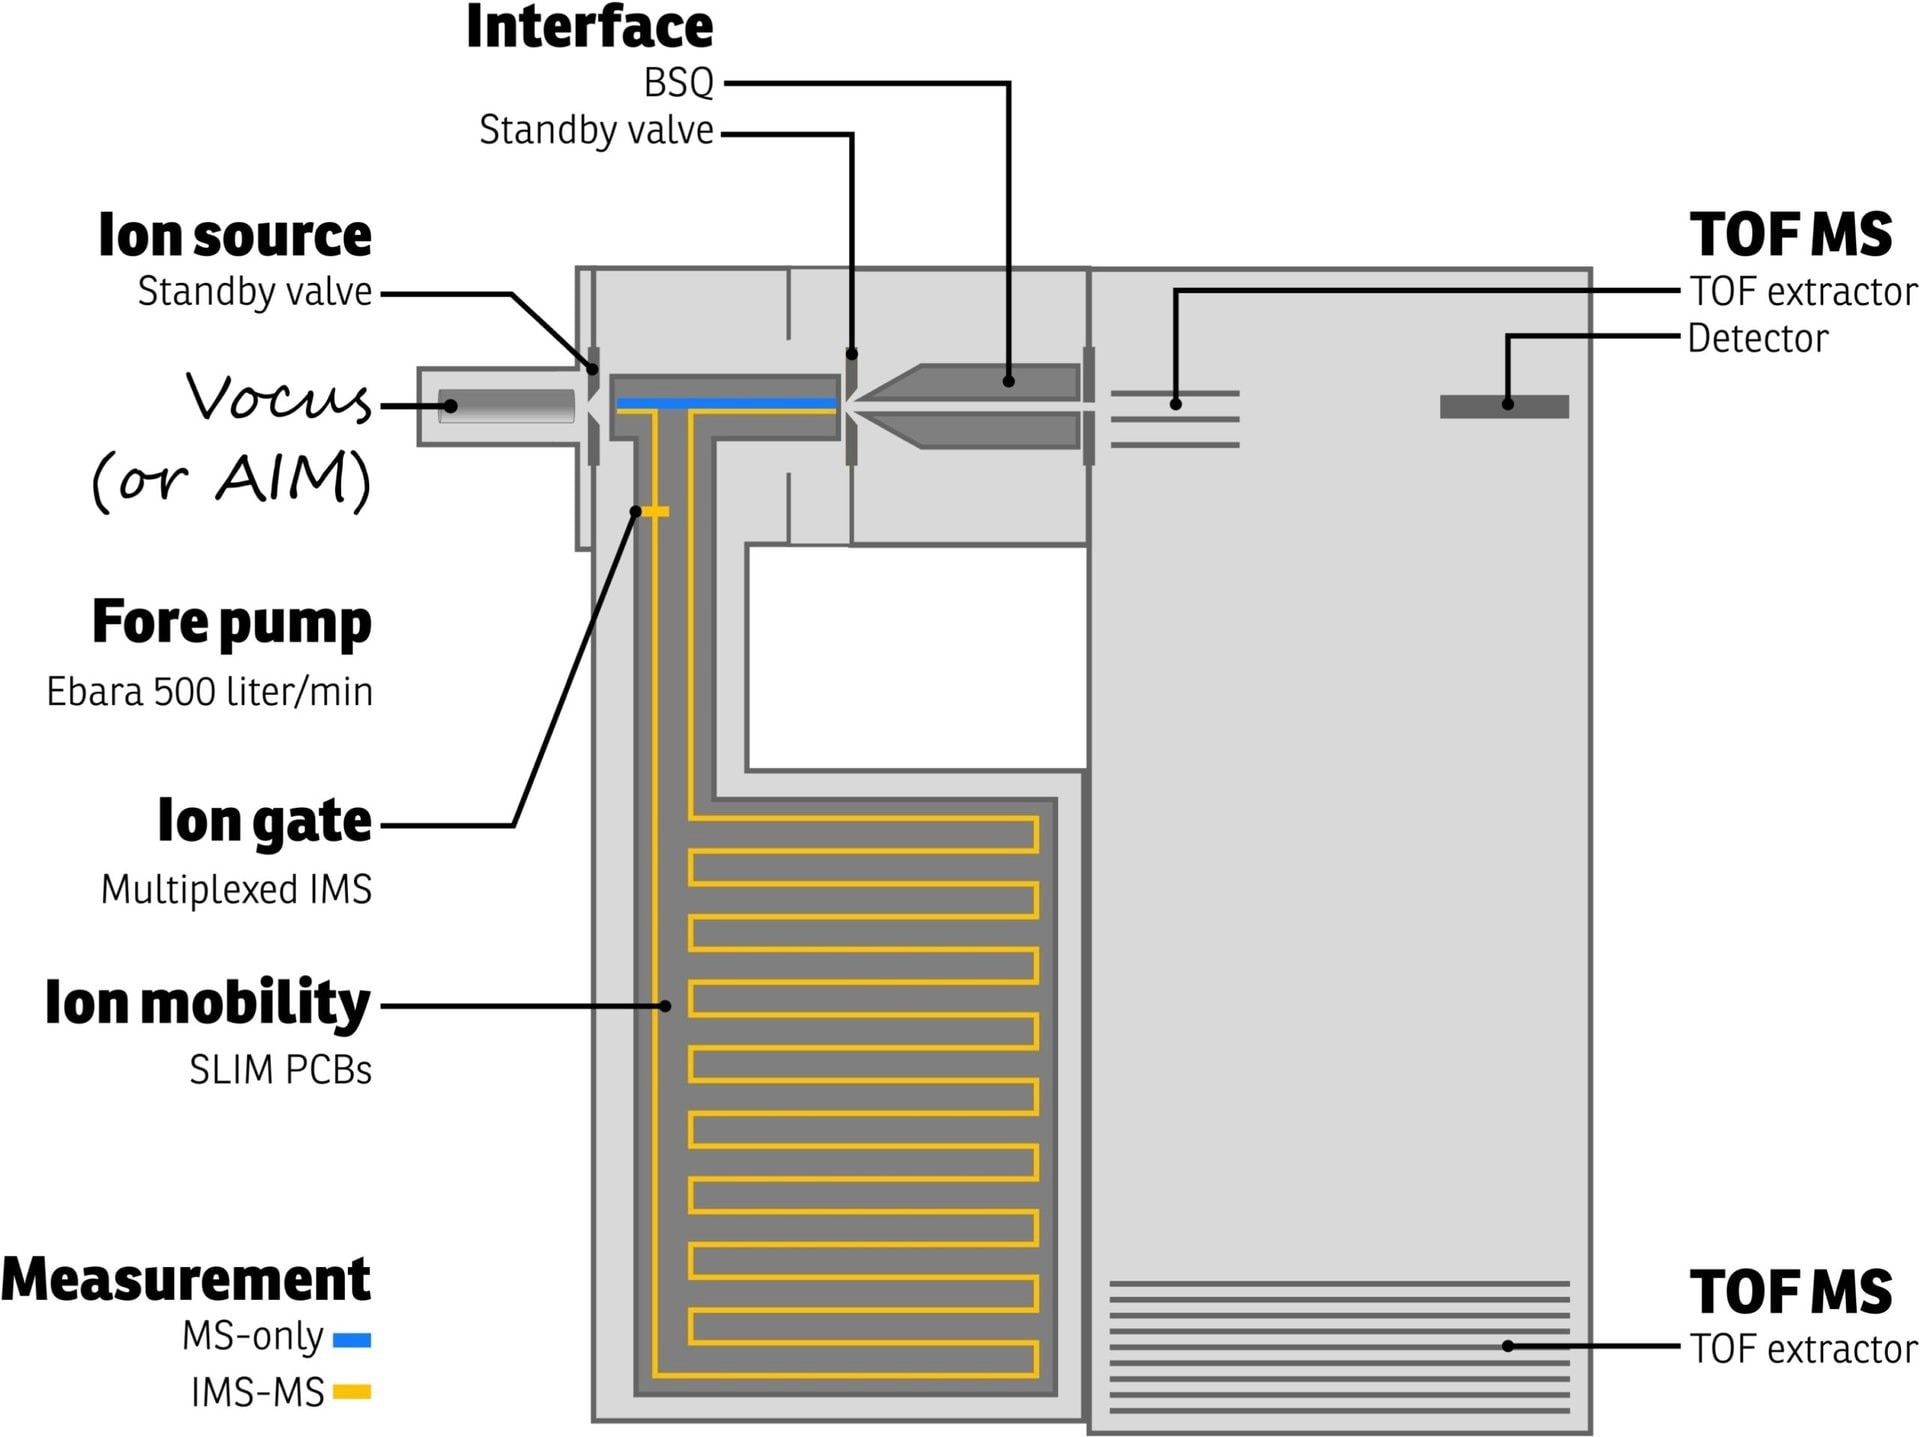
Figure 2. Schematic representation of the TOFWERK Vocus-IMS-TOF instrument. Both MS-only and IMS-MS measurements are possible as indicated by the blue and orange ion paths, respectively. Image Credit: TOFWERK.
The operation’s second mode guides ions via the IMS (orange path in Figure 2) through an ion switch, generating 2D data to deconvolute contributions from several isomers or isobars. IMS abilities are activated easily on the Vocus CI-IMS-TOF upon necessity.
Isomer Separation With Ion Mobility
Vocus IMS separation can be illustrated by examining the isomers methyl salicylate and methylparaben. As these compounds exhibit a similar monoisotopic mass and only vary in the position of the hydroxyl group on the aromatic ring, they both came up with the same mass spectrum peak in proton transfer reaction (PTR) chemistry at the same corresponding protonated mass (153.05 Th).
The blue trace in Figure 3 illustrates this by experiment. This data was achieved by sampling an air mixture of methylparaben and methyl salicylate in MS-only mode at 500 ppt concentrations (blue path in Figure 2, blue in Figure 3).
This data verifies the existence of at least one C8H8O3 compound. However, it does not denote the number of isomers that are contributed to the peak. This could only be accomplished by triggering IMS analysis.
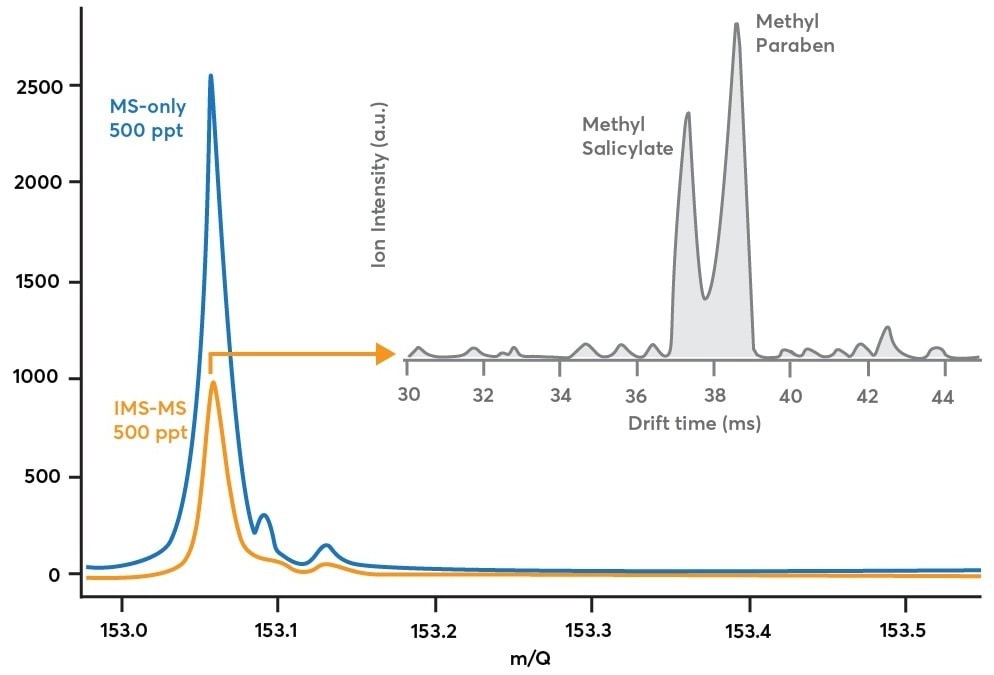
Figure 3. Blue trace: mass spectrum obtained while sampling 500 ppt methyl salicylate and 500 ppt methylparaben in MS-only mode (blue path in Figure 2). Orange trace: mass spectrum obtained while sampling the same methyl salicylate / methylparaben mixture in IMS-mode (orange path in Figure 2). Gray trace: shows how the mass spectrum in orange is decomposed along the ion mobility dimension to reveal multiple components after a 90 second acquisition. Image Credit: TOFWERK.
IMS mode activation enables the individual components of a single mass peak to be isolated. As soon as the ions are triggered, ions are directed into the mobility region (orange path in Figure 2) and a pseudorandom sequence (multiplexing) is employed to the ion gate, modulating the ion signal, and offering crucial timing information to quantify drift times.
As a result of the ion modulation, ion losses are obvious when comparing the IMS-MS mass spectrum (orange trace) to the MS-only mass spectrum (blue trace) in Figure 3. Based on the 50% duty cycle of the gate sequence, the theoretical expectation is to quantify 50% of the ion signal in IMS-MS mode compared to MS-only mode.
On an experimental basis, 40% of the ion signal has been quantified in IMS-MS mode than the MS-only mode—a 10% difference between theory and experiment—denoting that a small percentage of ions are lost either at the ion gate or in the drift region.
However, this tradeoff in ion intensity makes it feasible to produce drift time distributions for an extensive range of mass-to-charge ratios.
By adopting multiplexing, the duty cycle is 50% than that of <1% in non-multiplexing methods. The gray trace in Figure 3 shows the drift time distribution for 153.05 Th. Averaged over 90 seconds, this trace represents the efficient separation of methyl salicylate from methylparaben. This allows the existence of either species to be easily verified and for their comparative concentrations to be tracked with respect to time.
To better comprehend how the S: N ratio of IMS data degrades at concentrations less than 500 ppt, the same dataset presented in Figure 3 has been used and exhibits the IMS drift distribution for the first carbon isotope (13C1C7H9O3+, m/Q = 154.05 Th) of the methylparaben mixture and methyl salicylate in Figure 4.
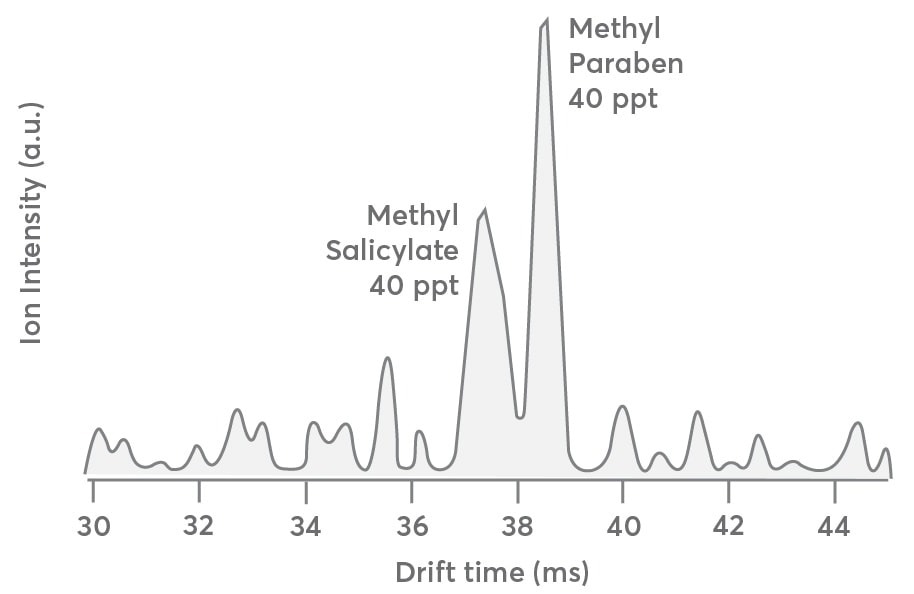
Figure 4. Drift time distribution of the first carbon isotope (13C1C7H9O3+m/Q 154.05) of methyl salicylate and methyl paraben sampled at 40 ppt each. The spectrum is qualitatively like that presented in Figure 3 except for the lower S:N ratio. Image Credit: TOFWERK.
This is beneficial since the first carbon isotope concentration has been anticipated to be only 8% of the 12C parents or 40 ppt for every compound. Apart from the lower concentration, the drift time distribution must be almost identical to that presented for the 12C parent compounds in Figure 3 (gray trace).
The drift distribution illustrated in Figure 4 is qualitatively like that in Figure 3; but, the S: N ratio is substantially less favorable as the instrument’s LOD approached. This implies that analytes with concentrations in the range of 40 ppt could be isolated and detected with the Vocus CI-IMS-MS instrument but need prolonged averaging times.
Real-Time Monitoring of Isomer Populations
Even though the data in Figures 3 and 4 averaged more than 90 seconds, normal drift times take place within a 20 to 150 milliseconds timescale. As mobility separations take place on such short timescales, it is feasible to track isomer populations in real-time.
This is beneficial while tracking processes where isomer ratios fluctuate within timescales <60 seconds, which is a difficulty for quick gas chromatography (GC) instruments.
Figure 5 shows outcomes from an experiment illustrating real-time measurement of isomer populations. In this context, a small amount of a methyl salicylate solution has been injected into a liquid calibration system (LCS) and the instrument response has been recorded.
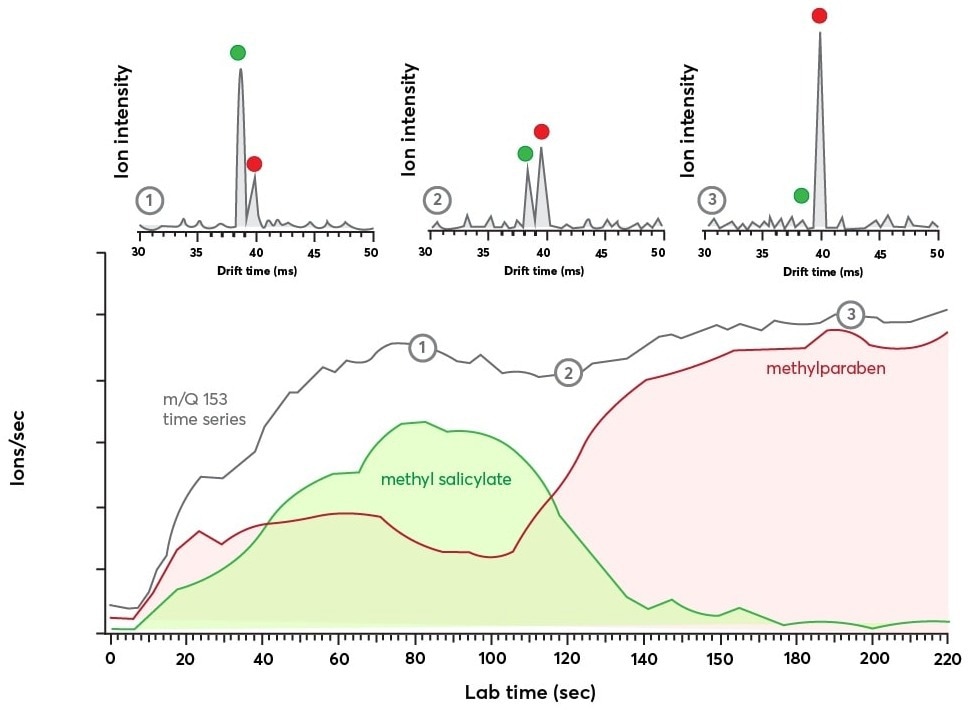
Figure 5. Bottom panel: time series data for m/Q = 153 Th showing the evolution of the ion current with time (in gray). The IMS dimension reveals the transient response of the isomers methyl salicylate (in green) and methylparaben (in red). Top panel: Shows the IMS spectra recorded at three different time points during the m/Q = 153 Th time series as indicated by the numbers 1, 2, and 3. The IMS spectra were each averaged for 2.9 seconds and show a clear exchange of ion population from methyl salicylate to methylparaben. Image Credit: TOFWERK.
In this experiment, an initial spike of methyl salicylate signal has been anticipated and further decays as the methylparaben solution is replaced in the system. The utmost concentration of methylparaben is 2.5 ppb toward the end of the run when the methyl salicylate injection has no longer diluted it.
The top panel in Figure 5 exhibits three IMS spectra “snapshots” taken at various times throughout the experiment, each averaging more than 2.9 seconds. The red and green dots determine the mass spectra peaks linked to methylparaben and methyl salicylate.
The relative intensities of such features change with respect to time, suggesting an equivalent change in the comparative population of the two species. Variations in isomer populations could be tracked by combining the separate IMS signals and splitting the quantified ion current by the ratio of the combined areas.
This analysis technique was executed for the methylparaben and methyl salicylate IMS signals—the outcomes are presented in the bottom panel of Figure 5. In this context, the methyl salicylate signal (green) increases rapidly until it reaches the utmost signal at 80 seconds, following which it reduces. The methylparaben signal (red) tends to remain low until later in the run.
Contributions from both methylparaben and methyl salicylate time series data are included in the m/Q Th channel illustrated in gray. In this context, the signal rapidly increases and stabilizes after ~70 seconds. After this point, there is no clear sign that the isomer populations change.
The labels “1,” “2,” and “3” along the time series trace correspond to the time points where the IMS spectra in the top panel were acquired, as denoted by the matching labels.
While it might be possible to gather gas chromatography data like that presented in Figures 3 and 4, it would be difficult to reproduce the real-time data illustrated in Figure 5. The TOFWERK Vocus CI-IMS-TOF performs isomer separations on a much quicker timescale than GC. This offers robust utility for those requiring rapid analysis with isomer separation.
Reference
- https://www.pnnl.gov/available-technologies/structures-lossless-ion-manipulation-slim

This information has been sourced, reviewed and adapted from materials provided by TOFWERK.
For more information on this source, please visit TOFWERK.