Spectrophotometry is a widely recognized and popular analytical method with decades of use in quantitative analysis applications throughout the physics, chemistry, biochemistry, and chemical engineering sectors.
A light source—typically ultraviolet and visible (UV-VIS)—and sensor are utilized to measure the intensity of light passing through a water sample in a cell with a known path length.
Substances in the water sample transmit or absorb light over a specific wavelength range. Beer’s Law states that the measured absorbance of substances in the water sample is directly proportional to their concentration, providing the underlying principle of spectrophotometry.
Major advances in spectrophotometry have been made over the past decade, meaning that it can now be performed accurately and reliably in real time.
A key benefit of continuously performing spectrophotometric measurements is the capacity to relate real-time absorbance measurements to the concentration of absorbing substances.
Different types of natural and synthetic organic substances absorb light in the UV-VIS wavelength spectrum as well as nitrate and nitrite. Suspended matter in water also scatters and reflects light, but it is possible to compensate for this in-measurement.
Many industries have adopted online spectrophotometry technology to continuously measure water and wastewater quality parameters, including:
- Biochemical oxygen demand (BOD)
- Chemical oxygen demand (COD)
- Total organic carbon (TOC)
- Dissolved organic carbon (DOC)
- Nitrates (NO3-) and nitrites (NO2-)
- Many other chemicals
This real-time ability is exceptionally beneficial for applications reliant on traditionally lab-tested parameters, for example, BOD and COD, or parameters such as TOC that are expensive to measure online.
Spectrophotometric sensors enable continuous process monitoring by analyzing a fairly large sample volume. Data collected becomes more representative of any spatial and temporal changes occurring in the process, meaning that sampling and accuracy information value is maximized.
Figure 1 highlights the value of increasing data collection frequency. Obtaining more information on the process reveals events that would typically go unnoticed with grab sampling.
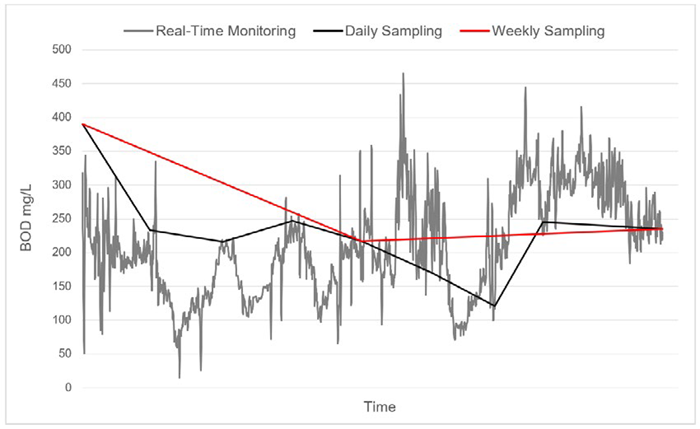
Figure 1. Effect of sampling frequency on the resolution of BOD variations in the water with real-time data in grey, daily sampling in black and weekly sampling in red. Image Credit: ABB
Another key advantage of using real-time spectrophotometers in water and wastewater applications is their straightforward operation. Measurements can be taken without any sample preparation, no reagents are required, and the sample’s composition remains unchanged throughout the process.
Operation is extremely straightforward, with instrument maintenance both easy and inexpensive. Spectrophotometric sensors continue to offer new opportunities for process control applications.
Rapid Acquisition of BOD and Other Parameters
Many people wonder how a parameter like BOD, which requires five days to test, can be measured in real time.
Absorbance is directly proportional to concentration, with spectrophotometric sensors measuring the UV-VIS absorbance of the sample that continuously flows through the instrument.
Acquiring absorbance data from a specific time and matching this with BOD laboratory data for the same time allows the establishment of a relationship between these two pieces of information.
Further acquisition of these matching data sets provides the information required to build a ‘calibration,’ and it is this calibration that is leveraged by the spectrophotometric sensor software to continuously convert the measured absorbance data into a milligrams per liter (mg/L) value for BOD.
This allows the operator to rapidly interpret the current displayed BOD mg/L value for regulatory assurance purposes or to transmit real-time BOD mg/L data to a SCADA or PLC to enable process control and ongoing improvements.
The sensor manufacturer will develop a custom calibration using site-specific data to produce the most accurate results. This custom calibration will be uploaded to the sensor’s controller via a remote connection, allowing the controller to display a real-time BOD value of the currently measured sample.
Custom calibrations developed in this manner are highly robust (Figures 2 and Figure 3), because they are able to account for plant-specific wastewater characteristics that may influence BOD, COD, or TOC composition, for instance, multiple product lines, cleaning agents, dyes, or process chemicals.
The calibration is regularly audited to validate the real-time data, and audit samples can be added to the custom calibration data set to continuously improve the calibration’s robustness and accuracy over time.
Involvement at the plant level is also straightforward, with operators only required to perform routine maintenance in line with any other online continuous wastewater instrument. Calibration work is typically provided by the sensor manufacturer, allowing operators to acquire much-needed data without the complexity of other systems.
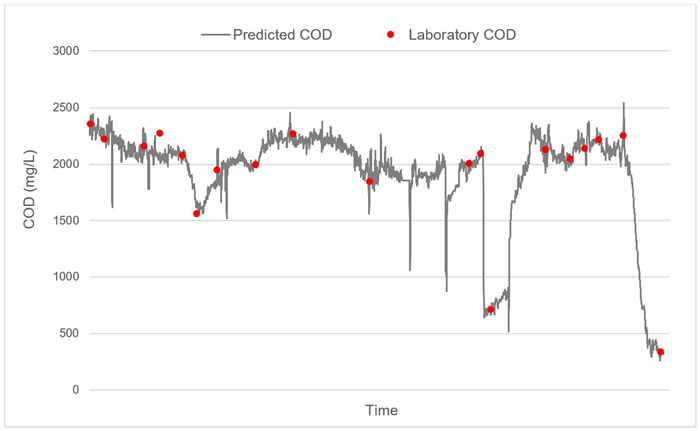
Figure 2. Real-time COD data from UV-VIS sensor with custom calibration and laboratory COD results. Image Credit: ABB
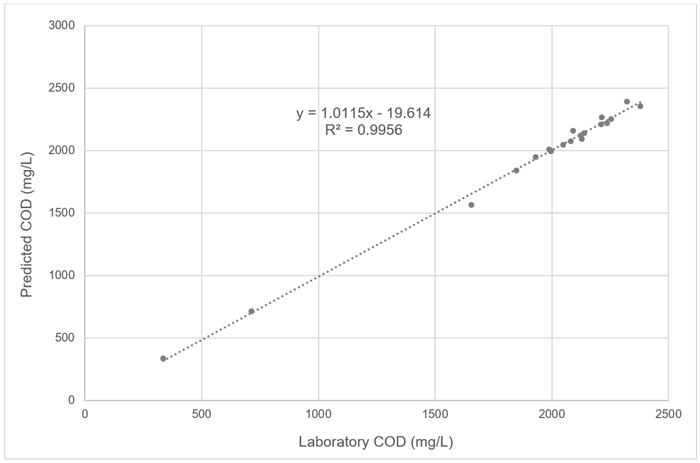
Figure 3. Comparison between laboratory COD data and COD data from UV-VIS sensor with custom calibration. Image Credit: ABB
Summary
Spectrophotometry is a commonly employed method available for real-time analysis. Matching a series of time-stamped grab sample laboratory test results to corresponding data from a UV-VIS sensor allows a highly accurate, site-specific custom calibration.
Implementing real-time spectrophotometric monitoring for parameters, such as BOD, COD, TOC, and various compounds, affords its users a range of beneficial outcomes.
These include optimizing system performance, informed decision-making, greater process control, reducing effluent surcharge fees, optimizing nutrient and chemical dosing, and reducing product lost to wastewater.
The wide-ranging detection capabilities of UV-VIS analysis monitoring also provide significant value to additional processes such as clean-in-place (CIP) or dye (color) concentration monitoring.
Real-time analysis is a straightforward, cost-effective means of affording operators a more comprehensive understanding of their wastewater and processes.
Acknowledgments
Produced from materials originally authored by ABB Measurement & Analytics.

This information has been sourced, reviewed and adapted from materials provided by ABB.
For more information on this source, please visit ABB.