Sponsored by TOFWERKReviewed by Olivia FrostAug 20 2026
Lead (Pb) is a toxic metal with an extensive history of human-related airborne emissions and related negative health effects. There is no safe level of human exposure to lead.1

Image Credit: gnepphoto/Shutterstock.com
The smelting of lead-rich ores to isolate silver metal was the primary source of lead-aerosol emissions from ancient Greek and Roman times to the Industrial Revolution.2
Lead emissions steadily increased during the Industrial Revolution due to coal combustion, dramatically increasing again with the widespread adoption of internal combustion automobiles and the pervasive use of tetra-ethyl lead (TEL) as a fuel additive, for example, as part of leaded gasoline.3
The 20th and 21st centuries saw global environmental regulatory agencies successfully push to entirely phase out the use of leaded gasoline as automobile fuel.
The United Nations Environment Program (UNEP) states that "Estimates have found that every year, leaded fuel bans save more than 1.2 million lives while helping the global economy avoid $2.4 trillion in healthcare expenses and other costs."4
The use of TEL as a fuel additive in general aviation fuel (AVGAS) persists, however, despite the ban on its use in leaded gasoline in automobiles. Emissions from AVGAS represent a major lead exposure route for people living or working within 1 to 3 km of a regional airport.5
Low-lead general aviation fuel (AVGAS 100LL) is the most widely used fuel type in fixed-wing piston-engine light aircraft. These aircraft require fuel with a high octane rating to provide enough thrust for take-off. Even AVGAS100LL can potentially contain up to 0.56 g Pb per liter of fuel, however.6
Regulatory agencies in the USA and Europe are still working to mandate a transition to unleaded AVGAS.
Temporally and spatially resolved measurements of lead emissions around general aviation airports are currently lacking, with most lead emissions studies conducted near general aviation airports using a combination of high-volume particle samplers or bulk samplers and post-collection quantification of lead concentrations.7,8,9
These approaches offer a degree of insight into lead emissions’ spatial distribution, but they are unable to capture the real-time dynamics of lead emission plumes and, therefore, cannot evaluate the potential for acute human lead exposure.
This article outlines the use of the microwave inductively coupled plasma time-of-flight mass spectrometer (mipTOF) for the real-time measurement and quantification of trace lead concentrations in ambient air in the vicinity of a regional airport.
The mipTOF was installed in a mobile laboratory (Aerodyne Mobile Lab, AML) and located approximately 200 m downwind of the end of a regional airport’s runway in Nashua, New Hampshire, USA.
Clear lead emission plumes were observed in line with takeoffs and landings of piston-engine airplanes, with lead concentrations up to 100x background levels. These emission plumes were between 30 and 90 seconds in duration.
Experimental Setup and Instrument Description
The mipTOF is a fieldable trace-element mass spectrometer capable of analyzing element concentrations in air in real time. The instrument boasts a high-power MICAP plasma source (Radom Instruments, USA) used to sustain a nitrogen (N2) gas plasma.
Leveraging N2 as the plasma gas enables the use of on-site nitrogen generation, which is key to mobile and/or fieldable instrument operation.
The plasma has sufficient power to entirely vaporize and atomize particles up to several microns in diameter, producing singly-charged cations proportional to the number of analyte element atoms present in the plasma at any specific moment in time.
Ambient air is introduced into the N2 plasma’s central channel at a flow rate of ∼100 cm3 per minute to facilitate real-time air measurements. A concentric nebulizer employed as a Venturi pump controls airflow into the plasma.10
Aerosol particles with (trace) elements enter the plasma before being vaporized, and the resulting atomic ions are then sampled into the mass spectrometer.
A series of ion optics is used to guide and shape the ion beam until it reaches the time-of-flight mass analyzer (TOF). The TOF separates and detects the ions according to the mass-to-charge ratio (m/Q).
TOF detection enables the recording of complete mass spectra every 30 µs, while averaged mass-spectrum data is transferred to computer storage at a rate of up to 1000 Hz.
This high-speed, full-spectrum detection separates transient events from the vaporization of individual particles in the plasma, for example, single-particle analysis.11
A calibration is required to transform measured signals into element mass amounts and concentrations. The ‘particle-size method’ was used to determine absolute sensitivities for a range of analyte elements, including Pb.12,13 Table 1 provides details of instrument operation parameters.
Table 1. Instrument parameters, sensitivity and LODs. Source: TOFWERK
| |
|
| Gas Sampling Rate |
100 cm3/minute |
| Inline PM Cutoff Cyclone |
PM2.5 |
| MICAP Power |
1.5 kW |
| Plasma Sampling Depth |
2.5 mm |
| Spectral Generation Rate |
200 Hz |
| Sensitivity: Pb |
48.4 cts/fg |
| LOD: Pb (Single Particle) |
0.15 fg |
| LOD: Pb (Five Second Average) |
0.08 ng/m3 |
The mipTOF’s main unit and supply unit were mounted on vibration-dampening wire-loop isolator shocks (Figure 1). Once installed, the base frames were directly mounted to the AML’s floor.
The mipTOF needs 5.5 kW of power during active operation. Power was supplied by a 12.5 kW diesel generator located in an underbody storage unit.
The air-sampling inlet was located in front of and above the vehicle's front window, allowing air to be sampled through 3/8" (9.525 mm) o.d. copper tubing at a flow rate of 10 liters per minute before being passed through a PM2.5 cutpoint cyclone (URG-2000-30EN, URG Corp, USA) and ultimately delivered to the mipTOF.
Air was subsampled into the mipTOF plasma at a flow rate of 0.1 liters per minute.
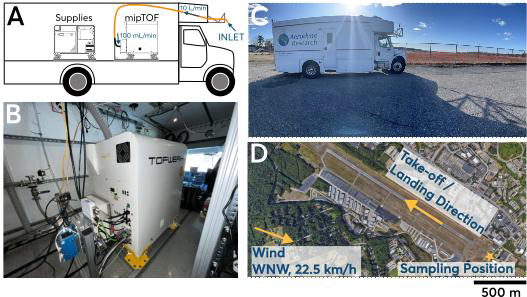
Figure 1. (A) Schematic of the mipTOF instrument in the AML. B) Image of the mipTOF main unit in the AML. C) Image of the AML parked at the Nashua regional airport. D) Map of the sampling position downwind of the runway. Wind direction and speed are the hourly average at Boire Field Station. Image Credit: Weather Spark (2025)14
Results
Figure 1 features schematic drawings and images of the setup detailing the mipTOF installation and its sampling position downwind of the Nashua Airport.
The prevailing wind was WNW at 22.5 km/h on the day of sampling, and the AML was parked approximately 200 m downwind of the end of the runway. Planes took off and landed from the southeast, so aircraft emissions typically passed over the sampling position.
Figure 2 shows the quantified time trace of Pb emissions recorded while the AML was parked downwind of the Nashua Airport runway, with average Pb concentrations per five seconds provided.
The takeoff and landing times of all aircraft were also recorded (Figure 2). A number of fixed-wing piston-engine aircraft performed touch-and-go landings and takeoffs during the measurement period, likely as a part of piloting lessons. These touch-and-go events typically exhibit less concentrated Pb emission plumes than cold takeoffs or complete landings.
There was a clear correlation of airborne Pb events with each takeoff and landing event. There was a highly variable scale in recorded emission plumes, likely due to varying takeoff and landing positions, engine performance, and changing wind velocities.
The correlation between Pb emission events and airplane takeoffs and landings was unmistakable despite these variations.
Only lead had a measurably elevated airborne concentration at the airfield, with most element concentrations found to be far lower than concentrations measured via mipTOF in urban settings or during highway driving.
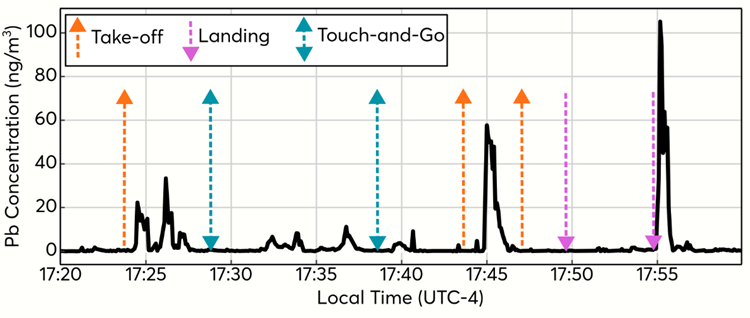
Figure 2. Measured lead concentrations by the mipTOF at the airport; data is averaged to five-second time resolution. Pb aerosol plumes were clearly correlated with take-off and landing events of piston-engine aircraft. Concentrations of Pb in the plumes were up to 100× greater than background levels. Image Credit: TOFWERK
It was determined that mipTOF measurements enable the isolation of signals from individual particles, as well as highly time-resolved bulk Pb concentration determination.
Figure 3 plots the measured mass distribution of Pb per particle alongside the correlation of Pb isotopes per particle. Over 900 individual Pb-containing particles were measured, featuring a median mass amount of 0.5 fg of Pb.
The measured isotope ratios of Pb were found to match those anticipated for ‘natural’ Pb. Individual Pb-rich particles were noted, but these particles accounted for <5% of the measured airborne Pb mass concentration found in the Pb aerosol plumes.
The majority of Pb particles from aircraft emissions were found to contain less than 0.15 fg of Pb, the mipTOF’s LOD for Pb detection in single particles.
Previous work reported that piston-engine aircraft emit lead dibromide (PbBr2) particles with a median diameter of 4 nm. These nanoparticles were found to be clustered into hydrocarbon-rich agglomerates, approximately 12 nm in diameter.
A 0.15 fg LOD corresponds to a PbBr2 particle with an equivalent spherical diameter of 48 nm. This confirms that mipTOF data is consistent with a prevalence of small Pb-rich particles emitted from piston-engine aircraft. This data also highlights the formation of larger Pb-rich particles or agglomerates downstream of the aircraft.
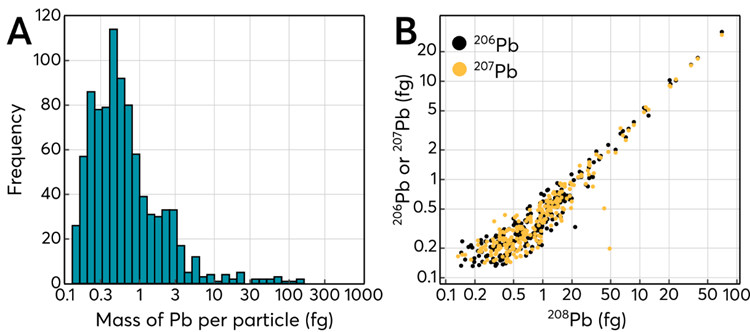
Figure 3. A) Mass distribution of Pb in individual particles recorded via the mipTOF. Particles with less than 0.15 fg of Pb could not be identified as single-particle events; however, the contribution to the bulk Pb signal from these smaller particles is still recorded. B) Isotope correlation of lead isotopes from individual particles shows that most lead-rich particles have “natural” Pb isotope ratios, consistent with the expectations of lead emissions from combustion of AVGAS100LL. Image Credit: TOFWERK
Conclusion
The mipTOF is a fieldable trace-element mass spectrometer suitable for the direct analysis of elements in air. Leveraging the mipTOF in this context delivers highly sensitive and highly time-resolved analysis of airborne (trace) metals.
The capabilities of the mipTOF are demonstrated via the real-time measurement of lead-rich emissions from fixed-wing piston-engine aircraft that are expected to employ lead-containing general aviation fuel.
Measuring metals in air in real time enables the unequivocal assignment of particle emission sources, with the example presented pinpointing emissions from each plane taking off or landing.
This study shows that it is possible to better understand acute emissions exposure and explore the dynamics of metal emissions via real-time metal aerosol measurements.
References and Further Reading
- Landrigan, P.J., et al. (2018). The Lancet Commission on Pollution and Health. The Lancet, 391(10119), pp.462–512. DOI:10.1016/s0140-6736(17)32345-0. https://www.thelancet.com/journals/lancet/article/PIIS0140-6736(17)32345-0/abstract.
- Hong, S., et al. (1994). Greenland Ice Evidence of Hemispheric Lead Pollution Two Millennia Ago by Greek and Roman Civilizations. Science, 265(5180), pp.1841–1843. DOI:10.1126/science.265.5180.1841. https://www.science.org/doi/10.1126/science.265.5180.1841.
- Nriagu, J.O. (1990). The rise and fall of leaded gasoline. Science of The Total Environment, 92, pp.13–28. DOI:10.1016/0048-9697(90)90318-o. https://www.sciencedirect.com/science/article/abs/pii/004896979090318O?via%3Dihub.
- UNEP. Inside the 20-year campaign to rid the world of leaded fuel. (2021). UNEP. Available at: https://www.unep.org/news-and-stories/story/inside-20-year-campaign-rid-world-leaded-fuel.
- Mills, A. and Peckham, S. (2022). Lead exposure from general aviation emissions in the UK: A review and call for action. Public Health Challenges, 1(4). DOI:10.1002/puh2.27. https://onlinelibrary.wiley.com/doi/10.1002/puh2.27.
- ASTM International. D910 Standard Specification for Leaded Aviation Gasolines. West Conshohocken, PA: ASTM International. Available at: https://store.astm.org/d0910-21.html.
- Shull, D.H., et al. (2025). Monitoring lead deposition around airports using bulk deposition samplers. Chemosphere, 377, p.144377. DOI:10.1016/j.chemosphere.2025.144377. https://www.sciencedirect.com/science/article/abs/pii/S0045653525003200?via%3Dihub.
- Carr, E., et al. (2011). Development and evaluation of an air quality modeling approach to assess near-field impacts of lead emissions from piston-engine aircraft operating on leaded aviation gasoline. Atmospheric Environment, 45(32), pp.5795–5804. DOI:10.1016/j.atmosenv.2011.07.017. https://www.sciencedirect.com/science/article/abs/pii/S1352231011007333?via%3Dihub.
- V. Groma, et al. (2008). Trace element analysis of airport related aerosols using SR-TXRF." ldojaras, 112, 83-97, 2008. Available at: https://www.researchgate.net/profile/Janos-Osan/publication/215659855_Trace_element_analysis_of_airport_related_aerosols_using_SR-TXRF/links/568e510108aead3f42ef5841/Trace-element-analysis-of-airport-related-aerosols-using-SR-TXRF.pdf.
- Nishiguchi, K., Keisuke Utani and Fujimori, E. (2008). Real-time multielement monitoring of airborne particulate matter using ICP-MS instrument equipped with gas converter apparatus. Journal of Analytical Atomic Spectrometry, 23(8), pp.1125–1125. DOI:10.1039/b802302f. https://pubs.rsc.org/ja/article-abstract/23/8/1125/260123/Real-time-multielement-monitoring-of-airborne?redirectedFrom=fulltext.
- Gundlach-Graham, A. (2021). Multiplexed and multi-metal single-particle characterization with ICP-TOFMS. Elsevier, pp.69–101. DOI:10.1016/bs.coac.2021.01.008. https://www.sciencedirect.com/science/chapter/handbook/abs/pii/S0166526X21000088?via%3Dihub.
- Pace, H.E., et al. (2011). Determining Transport Efficiency for the Purpose of Counting and Sizing Nanoparticles via Single Particle Inductively Coupled Plasma Mass Spectrometry. Analytical Chemistry, 83(24), pp.9361–9369. DOI:10.1021/ac201952t. https://pubs.acs.org/ancham/article-abstract/83/24/9361/937673/Determining-Transport-Efficiency-for-the-Purpose?redirectedFrom=fulltext.
- Montaño, M.D., et al. (2016). Single Particle ICP-MS: Advances toward routine analysis of nanomaterials. Analytical and Bioanalytical Chemistry, 408(19), pp.5053–5074. DOI:10.1007/s00216-016-9676-8. https://link.springer.com/article/10.1007/s00216-016-9676-8.
- Weather Spark (2025). Historical Weather on Thursday, March 27, 2025 at Boire Field, New Hampshire, United States. Available at: https://weatherspark.com/h/d/147269/2025/3/27/Historical-Weather-on-Thursday-March-27-2025-at-Boire-Field-New-Hampshire-United-States#Figures-ObservedWeather.
Acknowledgments
Produced from materials originally authored by Alexander Gndlach-Graham, Lorenz Gfeller, and Martin Tanner from TOFWERK, and Ed Fortner, John Jayne, and Conner Daube from Aerodyne Research.

This information has been sourced, reviewed, and adapted from materials provided by TOFWERK.
For more information on this source, please visit TOFWERK.