The analysis of microplastics (MPs) in marine surface water is complex because particle concentrations can differ considerably between locations, and collected material may contain biological matter, minerals, and other non-plastic substances.
Reliable characterization, therefore, depends on chemical identification rather than on visual assessment alone. This is particularly important for small particles whose appearance may not clearly distinguish them from naturally occurring materials.
FTIR imaging addresses this need by creating spatially resolved chemical maps across the full filter area.
Using this approach, particles are detected and classified according to their spectral signatures. Polymer-specific identification is therefore possible while the same measurement also provides particle-level data on size and morphology.
This article presents FTIR imaging for the characterization of microplastics in Southern Ocean seawater samples collected during the International Antarctic Coastal Circumnavigation Expedition (2024–2025), as described by Dr. J. Paulo Felizardo and Dr. C. Rodrigues from UFF Brazil.
Experimental
Surface seawater was obtained from several sampling stations distributed across the Southern Ocean. Approximately three liters of water were collected at each station with a Niskin bottle and vacuum-filtered immediately at the sampling location. Pre-muffled stainless steel meshes with a pore size of 25 μm were used for this initial filtration.
Following collection, the loaded filters were refrigerated and transported to the laboratory. The filters then proceeded directly to the extraction and preparation procedure outlined below.
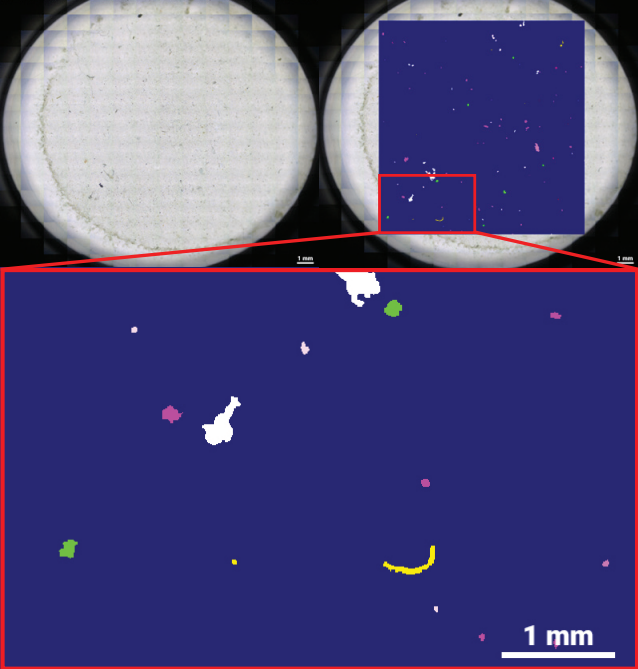
Figure 1. Exemplary data obtained from a Southern Ocean surface seawater sample. Left: transmitted-light mosaic of the anodisc filter. Right: corresponding hyperspectral µ-FTIR image acquired with the Bruker LUMOS II and evaluated with the Bruker MPID software. Image Credit: Dr. J. Paulo Felizardo and Dr. C. Rodrigues
Sample preparation was carried out in several stages. First, organic matter was digested with a 10% KOH solution added at a 10:1 ratio relative to the sample volume. The mixture was incubated at 40 °C for 72 hours before being filtered again through a stainless steel mesh.
Density separation was performed by adding 10–15 mL of NaI solution to each filter. The solution had a concentration of 4.4 mol/L and a density of 1.8 g/cm3. The samples were sonicated for five minutes at 50 Hz, magnetically stirred for five minutes, and then centrifuged at 7000 rpm for two minutes. The recovered supernatant was vacuum-filtered onto 0.2 μm aluminum oxide (anodisc) filters.
To assess contamination introduced during the preparation procedure, a procedural blank was processed through every step, with environmental water omitted.
Results
Analysis of three Southern Ocean samples produced microplastic concentrations ranging from 9000 to 32,000 MPs per m3. Previously published concentrations for Southern Ocean surface waters range from approximately 0.01 to 15,400 MPs per m3, illustrating the considerable methodological variability among studies.
The comparatively high values measured in this investigation may be attributable to the smaller effective-size threshold of the analytical workflow. FTIR imaging detects small particles that may be missed, excluded, or unreported in conventional non-imaging studies and workflows that rely on subsampling.
The distribution of polymer types differed between sampling stations. Polypropylene was the predominant material at most sites and represented 68–81% of the identified particles. At one station, poly(ethylene terephthalate) accounted for approximately 52% of the particles identified.
Mean particle dimensions depended on polymer type and ranged from 40 to 160 μm. The procedural blank contained very little particulate material, indicating that contamination resulting from laboratory handling was negligible.
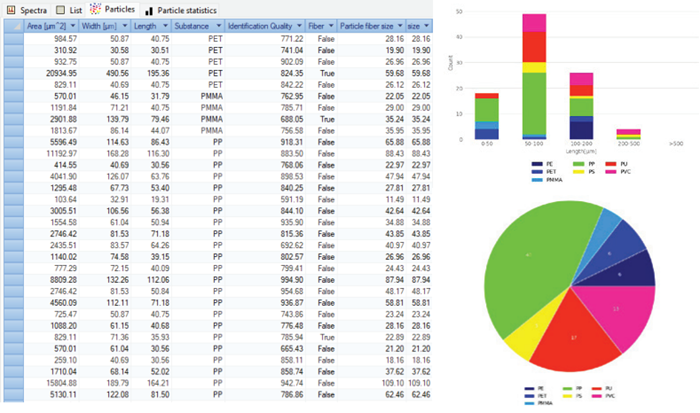
Figure 2. Exemplary MPID result obtained from a Southern Ocean subsurface seawater sample. Extensive particle information is given together with an interactive classification map. When a particle or particle class is selected, all respective information is directly displayed. Image Credit: Bruker Optics
Conclusion
The LUMOS II FTIR imaging microscope, used with automated MPID processing, enables particles on anodisc filters to be detected and identified according to their polymer composition. The workflow also preserves information about the size and morphology of individual particles.
Particles from approximately 10 μm upward can be detected and chemically characterized, allowing concentration estimates to include more of the small-particle fraction accessible through μ-FTIR imaging.
The analysis further demonstrated the usefulness of MPID software, which automatically processes complete FTIR images of microplastic samples within a few minutes. It generated comprehensive filter statistics and classified detected particles according to their number, identity, and dimensions.
The Southern Ocean samples contained between 9000 and 32,000 MPs per m3. These results are not directly comparable with concentrations obtained using less sensitive collection approaches, such as 300 μm mesh nets.
Because those methods do not retain much of the smaller-particle fraction measured by FTIR imaging, the higher concentrations observed here primarily result from differences in detectable particle size. They should not be interpreted as direct proof of higher environmental contamination.
The reported concentrations were calculated from three-liter samples and extrapolated to 1 m3. Therefore, relatively minor changes in the number of particles counted can lead to substantial changes in the extrapolated concentration. In addition, the limited sample volume may not adequately represent spatial variations in particle abundance.
These considerations are important when assessing the results and comparing them with data from other investigations. Greater consistency between studies will require harmonized sampling and analytical procedures, including standardized particle-size ranges and IR imaging-based chemical identification.
Acknowledgments
Produced using materials originally authored by João Paulo Felizardo, PhD; Camila Rodrigues e Silva, PhD; and Alexander Staub, PhD, Product Manager, IR Microscopy, Bruker Optics.

This information has been sourced, reviewed, and adapted from materials provided by Bruker Optics.
For more information on this source, please visit Bruker Optics.