Mar 28 2013
A new report titled ‘Australian Cleantech Review, 2013’ from Australian CleanTech profiles the Australian cleantech sector by analyzing more than 1300 Australian companies in terms of their activities, revenues, profit, location, capital transactions and employees. The report features detailed charts and data covering international activity and investment levels. It forecasts the technology, regulatory and investment trends that will affect the Australian cleantech sector in 2013, and lists out the top cleantech trends for 2013.
Global Investments in Clean Energy
This report covers companies that provide economically viable products, processes and services that use renewable energy sources and materials for achieving significant reduction in natural resource consumption and reducing or eliminating emissions and wastes. The sub-sectors covered in the report include water, renewable energy, waste and recycling, energy efficiency, construction materials, carbon trading and environmental services. The global market trends were based on the data provided by the Cleantech Group as well as by Bloomberg New Energy Finance.
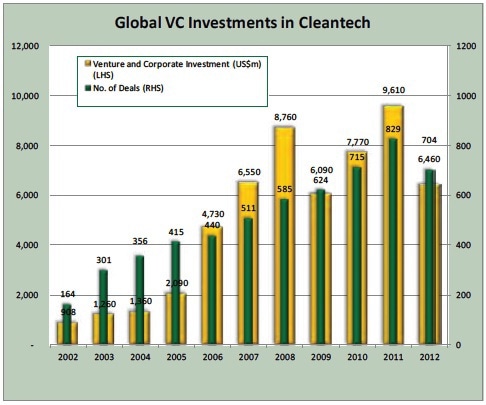
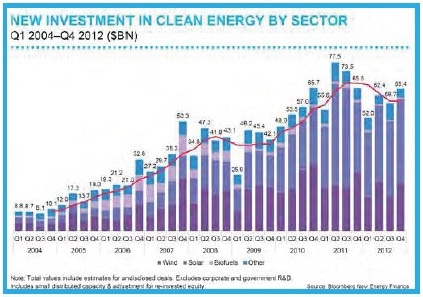
From the data illustrated in the above graphs, it was evident that both total global investments and venture capital (VC) investments in clean energy declined from the record levels registered in fiscal 2011. Biofuels and biochemicals, transport technologies, and energy efficiency were the key recipients of the VC and corporate investment in 2012. For global VC investment in clean energy, North America was the top region in terms of number of deals and amount of investment in dollars thanks to its well funded venture capital industry. China made an investment of $67.7 billion in clean energy in 2012, a 20% increase from 2011, making it the top investor followed by the US with an investment of $44.2 billion. South Africa, Japan, Australia and Mexico were the other strong performers.
Industry Profile
Although the report does not cover every cleantech firm in Australia, it has captured most of operating and development companies. The overview data of the 1340 Australian cleantech companies covered in the report is shown in the following table. The new report profiles roughly 200 more companies than last year’s report, representing a more detailed coverage across all states and sectors.
| |
Listed |
Unlisted |
TOTAL |
| Number of Companies |
84 |
1256 |
1340 |
| Market Capitalisation ($m) |
$9,222m |
N/a |
N/a |
| Revenue ($m) |
$15,507m |
$13,178m* |
$28,684m |
| NPAT ($m) |
-$760m |
N/a |
N/a |
| Employees |
21,055* |
32,352* |
53,407 |
| Capital Transactions ($m) |
$640m |
$676m |
$1,316m |
| No. of Capital Transactions |
71 |
55 |
126 |
| Average Capital Transaction |
$9.0m $9.0m |
$12.3m $12.3m |
$10.4m |
*: Australian CleanTech estimates based on company analysis.
From Table 1, the total revenue of the 1340 companies was roughly $29 billion with a total number of employees of 53,000. The total value of capital transactions in 126 separate deals signed by these companies was $1.3 billion in 2012, and the average capital transaction was valued at $10.4 million. The results have been compared with the results from 2009 to 2011. Since the number of companies has been significantly increased during the period, average per company values were estimated for capital transactions, number of employees and revenues, as shown in Figure 3.
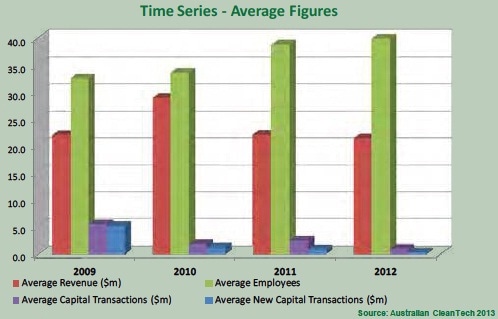
From the above graph, it was evident that the average number of employees per company value has been steadily increasing during the period, while the average revenue per company figure has a stable value of $20 million. On the other hand, the average capital transactions per company value has declined during the period. Each of the categories in the above 2012 summary table has been thoroughly studied in term s of geography and sub-sectors in order to present an extensive national profile of the Australian cleantech industry, thus enabling policy makers and investors to better understand the industry in order to evaluate future options.
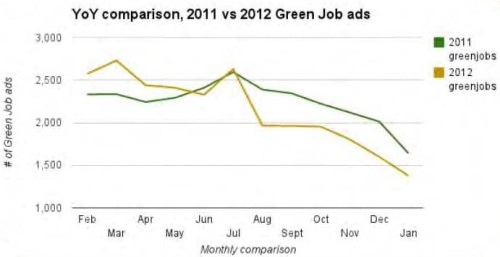
The solar, waste and water sectors currently dominate the distribution of cleantech firms with more than 10% of the total 1340 companies. The water sector has the most number of companies with 247 firms, followed by solar (244) and waste (148). The waste sector took the top spot in terms of revenues, followed by water, solar, environmental services and wind. All sub-sectors crossed the $1 billion mark in 2012. This report also features an evaluation of the GreenJobs Index issued by GreenCollar Talent Solutions. Green job advertising was better in 2012 when compared to 2011, as show in Figure 4.
Comparison of State Strengths
New South Wales and Victoria with 430 and 319 cleantech companies respectively represent over 54% of the 1340 Australian companies covered in this report. New South Wales generated the largest amounts of revenue with 57.4%, followed by Victoria (19.2%), and Queensland (13.8%). The distribution of employees was more even between New South Wales, Victoria, and Queensland. New South Wales currently dominate the distribution of capital transactions with 48.2%, followed by Western Australia (25.0%), and Tasmania (13.6%). The relative strengths of New South Wales and Victoria have been demonstrated in Table 2.
| Region |
Relative Strengths |
| NSW |
Solar |
Storage & Fuel Cells Carbon |
| Wind |
Carbon |
| Water |
Environment |
| Efficiency |
Green Building |
| VIC |
Wind
Efficiency
Transport Technologies |
Carbon
Green Building |
The comparison of the listed companies in the cleantech sector to the overall market is illustrated in Table 3.
| |
Cleantech Sector (CY11) |
Total ASX (CY11) |
% |
| Number of Companies |
84 |
2188 |
3.8% |
| Market Capitalisation |
$9,222m |
$1,335,837m |
0.7% |
| New Equity |
$257m |
$42,309m |
0.6% |
Conclusion
This comprehensive report provides the necessary data to readers to better understand the latest activities and trends occurring in the Australian cleantech sector.
About Australian CleanTech
Australian CleanTech facilitates and delivers Australian Clean Technology projects on behalf of both investors and project proponents.
In addition, Australian CleanTech provides services to Government agencies to help stimulate investment in the Cleantech industry. To deliver these services Australian CleanTech uses its extensive Cleantech research database.
Australian CleanTech also provides access to the ACT Australian Cleantech Index and to direct investment through ACT Capital. The emerging Cleantech sector covers a range of growth industries that will move the concept of sustainable living from theory and aspiration to a practical reality.
Cleantech covers technologies and services that come under the categories of:
- Renewable energy
- Low emissions technologies
- Water and wastewater reuse and treatment technologies
- Low emissions transport technologies
- Recycling and packaging technologies and systems
- Demand side management for energy, water and other resources

This information has been sourced, reviewed and adapted from materials provided by Australian CleanTech.
For more information on this source, please visit Australian CleanTech.