The Earth experienced one of the most basic global climate changes ever experienced in geological history during the Early Cenozoic period. The change was a transition from hot Greenhouse conditions (approximately 52 to 34 million years ago, Ma) to cold Icehouse conditions (less than 34 Ma).
Image Credit: VicPhotoria/Shutterstock.com
Due to a long, gradual cooling from about 52 Ma, there was a drastic drop in the global mean surface and deep ocean temperatures, the enlargement of continent-wide glaciers in Antarctica, and the beginning of a circum-Antarctic sea ice ecosystem, nearly 34–33 Ma.
It has been challenging to gain insights into the key mechanisms inducing this transition because various potential triggering events transpired around this period, for which there are only limited geological records, specifically for the Eocene–Oligocene transition (EOT, approximately 34 Ma).
Researchers have proposed two key processes as major climate drivers: long-term decrease in atmospheric carbon dioxide (CO2) levels that passed a critical threshold, and the start of a thermally isolating Antarctic Circumpolar Current (ACC), triggered by the tectonic opening of the Tasmanian Gateway (TG) and the Drake Passage (DP)—both Southern Ocean gateways.
However, all hypotheses pose uncertainties. During the early Eocene (52–48 Ma), there was a decline in atmospheric CO2 concentrations from >1125 ppm to approximately 780 ppm around the EOT. However, obtaining a clear link to the global cooling δ18O trend has been challenging owing to major gaps in the paleo CO2 record before the EOT.
The simulations presented in this study, published in Nature Communications, accommodate not only high model resolution but also seafloor roughness to explore the role of gateway opening on the Southern Ocean. The study shows that only minor variations in the depths of the Tasmanian and Drake gateways are enough to cause a drastic reorganization in Antarctic surface water temperatures and ocean circulation patterns.
If at least one of the gateways is shallow (300 m), ocean gyres tend to transport warm waters towards Antarctica. But when the second gateway deepens lower than 300 m, the gyres weaken and cause a drastic cooling of Antarctic surface waters (of up to 5 °C) while the ACC stays considerably weaker than present day.
Results and Discussion
This study used increased available computational capabilities to perform high-resolution ocean model simulations (at a horizontal grid spacing of 0.25°). Although an ocean-only simulation does not permit feedbacks between the ocean and atmosphere, it allows increased model resolution to resolve bathymetry and eddies.
A newly reconstructed paleobathymetry with elaborate seafloor geometry and roughness was used to complement this increase in model resolution (see Figure 1a) at a higher resolution. Stepwise subsidence of both gateways was modeled by adjusting the depths to 300, 600, and 1000 m in the case of DP/1500 m in the case of TG (see Figure 1b, c).
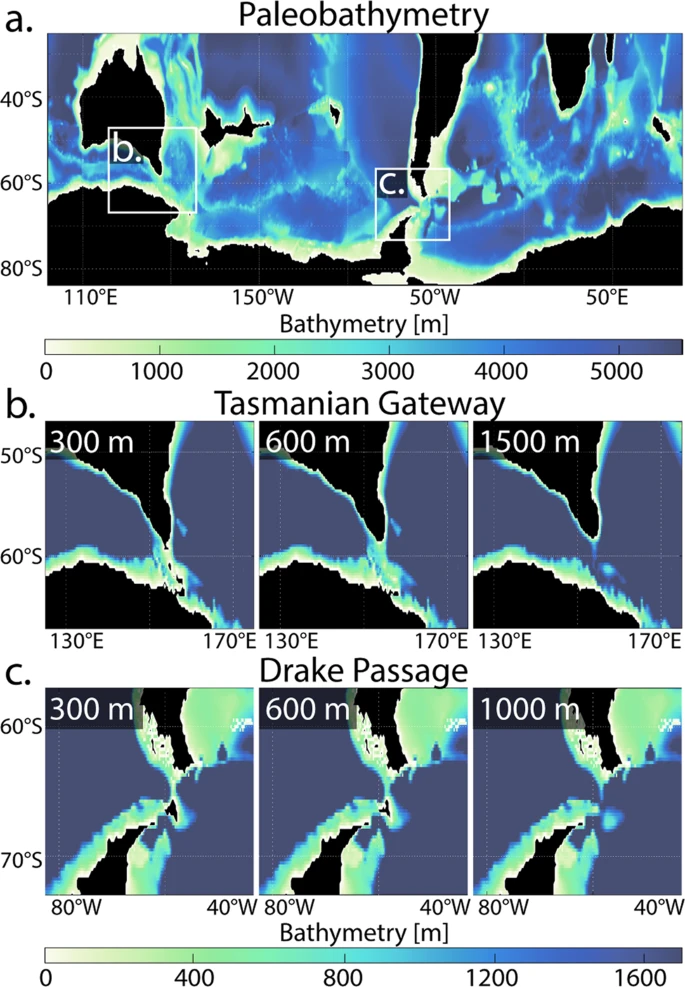
Figure 1. Paleobathymetry and gateway depths configurations. (a) High-resolution (0.25°) bathymetry of the Southern Ocean reconstructed to the Late Eocene (38 million years ago). (b, c) Stepwise subsidence of the (b) Tasmanian Gateway (TG) and (c) Drake Passage (DP), with depths adjusted to 300, 600, and 1000 m (DP)/1500 m (TG). Black regions are above sea level. Image Credit: Sauermilch, et al., 2021
Large-scale ocean gyres tend to dominate the subpolar Pacific and Atlantic basins if at least one gateway is shallow (300 m; see Figure 2a).
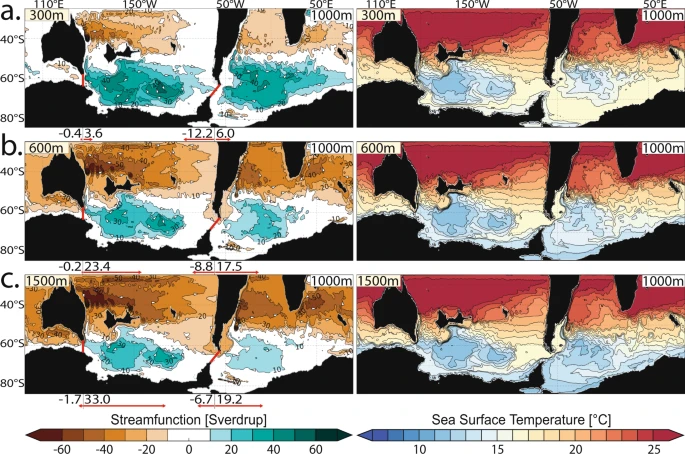
Figure 2. Impact of gateway deepening on Southern Ocean circulation and temperature. Oceanographic model results from progressive deepening of the Tasmanian Gateway (TG) from: (a) 300 m to (b) 600 m and (c) 1500 m water depths, with an already deep second gateway (Drake Passage (DP), 1000 m). See supplementary data for constant deep TG and progressively deepening DP. Left-hand side panels: ocean circulation patterns (annual mean and depth integrated stream function with contours indicating 10 Sverdrup intervals, white arrows indicate the flow direction). The zonal volume transport in east- and westward direction through both gateways (red lines) are indicated as red arrows and values in Sverdrup. Right-hand side panels: annual mean sea-surface temperatures (at 100 m water depth) with contours indicating 1 °C intervals. Black regions are above sea level. Image Credit: Sauermilch, et al., 2021
Deepening of only one gateway (Tasmanian or Drake) does not cause significant changes in Southern Ocean circulations and SST distributions (Figures 2a and 3a).
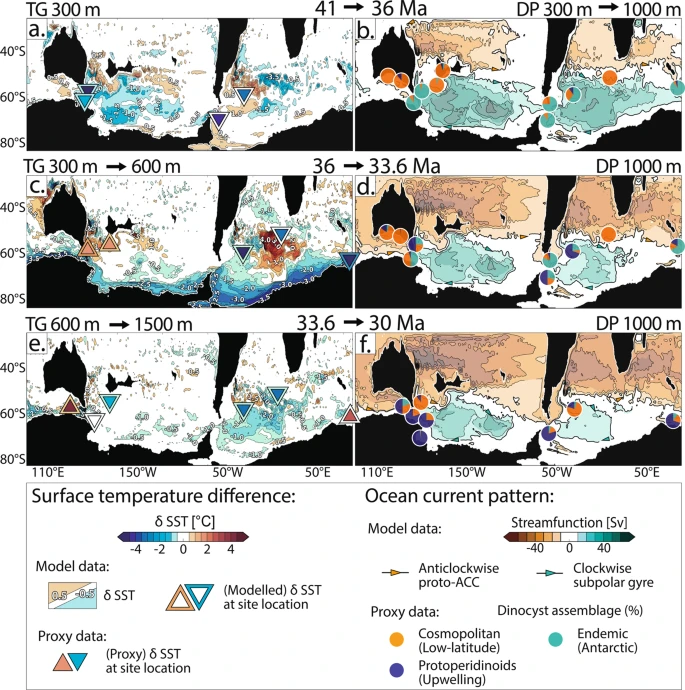
Figure 3. Paleoceanographic evolution of the Southern Ocean. a–f Model-data comparison and proposed paleoceanographic evolution of the surface Southern Ocean from the Late Eocene to Early Oligocene (41–30 million years ago, Ma). The left column presents the comparison of observed and modeled surface temperature differences (δ SST, both datasets use the same color scale, see legend). Modeled differences in sea-surface temperatures result from the: (a) Drake Passage (DP) deepening from 300 to 1000 m (Tasmanian Gateway (TG) remaining at 300 m), TG deepening from: (b) 300 to 600 m and (c) 600 to 1500 m (DP at 1000 m). Contours indicate 0.5 °C intervals. The inner part of the triangles shows relative changes of paleo sea-surface temperature proxy records from sediment drill cores within the geological time slices. The outer part of the triangles shows the modeled SST changes at these drill sites. The right column presents the comparison of observed and modeled current pattern. Modeled stream function pattern (bold contours show 10 Sverdrup (Sv) and −10 Sv; fine lines show >10 Sv and <−10 Sv; color scale, see legend, ACC = Antarctic Circumpolar Current) are taken from simulations with: (b) TG at 300 m, (d) TG at 600 m and (f) TG at 1500 m (DP at 1000 m; Figure 2). Pie charts present plankton biogeographic patterns in proportions (colors and affinities, see legend) found in sediment drill cores as proxy for surface current pattern. Details of the sites’ paleolocations, recorded geological time periods, as well as all data used in this study are collated in the SI. Image Credit: Sauermilch, et al., 2021
The subpolar gyres weaken (dropping from >50 to >40 Sv) as soon as the second gateway subsides from 300 to 600 m. This causes cooling of surface water along the whole of the Antarctic coast (south of 60°S) from 2 °C to 3.5 °C, which extends up to 2000 km from the coast (see Figures 2b and 3c).
The gyres tend to weaken further to ~30 Sv as soon as the second gateway subsides even below 600 m, while the circumpolar current strengthens (approximately 7%–19% of present day’s net transport). Meanwhile, the Antarctic coastal waters cool further to 0.5 °C–2 °C (see Figures 2c and 3e).
The simulations presented in this study reveal that gateway deepening allowed drastic surface water cooling off the Antarctic coast without the start of a powerful, fully developed ACC. Based on the findings, the study proposes that the main oceanographic change brought about by Southern Ocean gateways opening was the weakening of the Ross and Weddell gyres instead of the thermal insulation caused by the onset of the strong proto-ACC.
The study aims to model the impacts of gateway deepenings on Southern Ocean circulation patterns and SST changes. The results are not expected to accurately match parameters such as absolute SST but are predicted to match the magnitude of SST change and oceanographic circulation patterns.
The model data presented in this study with the different gateway depth configurations fit the most with the proxy data—at least one gateway stays shallow between ~41 and 36 Ma, while the second gateway tends to deepen from 300 to 600 m between 36 and 33.6 Ma, further deepening (> 600 m) from 33.6 to 30 Ma (see Figure 3).
Overall, the results of this study are compatible with proxy-based ocean flow and heat transport constraints and firmly indicate that tectonically induced oceanographic variations had a fundamental role in Earth’s major climate transition into the modern Icehouse world.
Methodology
Bathymetry at latitudes south of 40°S was reconstructed through sediment backstripping using the BALPAL software. The transition between both grids was smoothed to prevent artificial jumps in the bathymetry.
Backward modeling was used rather than forward modeling as it enables the preservation of realistic bathymetric features of small-scale, detailed geometry and seafloor roughness within the resulting paleogrid.
The vertical and spatial resolution of the model simulations presented in this study is higher compared to a majority of the previously used model configurations. The higher resolution at 0.25° offers the benefit of partially resolving mesoscale eddies with length scales of ~10–100 km.
The 0.25° model also more accurately resolves seafloor roughness and small-scale bathymetry features that considerably impact the ocean circulation patterns. The model employs a linear drag coefficient of 0.0011, a seventh-order advection scheme for temperature and salinity, a nonlinear equation of state, and the K-profile parameterization.
The surface forcing for salinity and temperature of the sea surface as well as meridional and zonal wind stresses are zonally and temporally averaged values from the coupled model (see Figure 4).
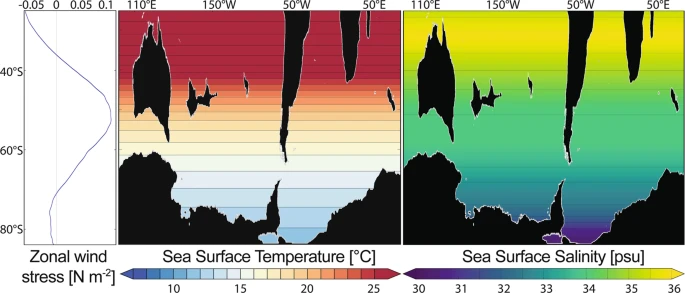
Figure 4. Restoring boundary conditions. Configuration of atmospheric forcing used in this model: stationary zonal wind stress (left), sea surface temperature (center) and sea surface salinity (right); derived from a coupled ocean-atmosphere model simulation with atmospheric CO2 concentration of 800 ppm, zonally and annually averaged. Image Credit: Sauermilch, et al., 2021
Each model simulation has been spun up for a period of 110 years. The results presented as figures are time-averaged over the past decade of the model run. The stream functions presented here have been estimated using depth-integrated zonal velocities. The temperatures presented are from a water depth of 100 m.
Journal Reference:
Sauermilch, I., Whittaker, J. M., Klocker, A., Munday, D. R., Hochmuth, K., Bijl, P. K., LaCasce, J. H. (2021) Gateway-driven weakening of ocean gyres leads to Southern Ocean cooling. Nature Communications, 12, p. 6465. Available online: https://www.nature.com/articles/s41467-021-26658-1.
References and Further Reading
- Lear, C. H., et al. (2000) Cenozoic deep-sea temperatures and global ice volumes from Mg/Ca in benthic foraminiferal calcite. Science, 287, pp. 269–272. doi.org/10.1126/science.287.5451.269.
- Cramwinckel, M. J., et al. (2018) Synchronous tropical and polar temperature evolution in the Eocene. Nature, 559, p. 382. doi.org/10.1038/s41586-018-0272-2.
- DeConto, R M & Pollard, D (2003) Rapid Cenozoic glaciation of Antarctica induced by declining atmospheric CO2. Nature, 421, pp. 245–249. doi.org/10.1038/nature01290.
- Pearson, P. N., et al. (2009) Atmospheric carbon dioxide through the Eocene–Oligocene climate transition. Nature, 461, pp. 1110–1113. doi.org/10.1038/nature08447.
- Houben, A. J., et al. (2013) Reorganization of Southern Ocean plankton ecosystem at the onset of Antarctic glaciation. Science, 340, pp. 341–344. doi.org/10.1126/science.1223646.
- Anagnostou, E., et al. (2016) Changing atmospheric CO2 concentration was the primary driver of early Cenozoic climate. Nature, 533, p. 380. doi.org/10.1038/nature17423.
- Kennett, J. P., (1977) Cenozoic evolution of Antarctic glaciations, the circum-Antarctic ocean and their impact on global paleoceanography. Journal of Geophysical Research, 82, pp. 3843–3860. doi.org/10.1029/JC082i027p03843.
- Exon, N F (2004) Cretaceous–Holocene history of the Tasmanian gateway. Proceedings of the Ocean Drilling Program, Scientific Results. Vol. 189 (Texas A&M University, Ocean Drilling Program.
- Goldner, A., et al. (2014) Antarctic glaciation caused ocean circulation changes at the Eocene–Oligocene transition. Nature, 511, pp. 574–577. doi.org/10.1038/nature13597.
- Kennedy, A. T., et al. (2015) Atmospheric and oceanic impacts of Antarctic glaciation across the Eocene–Oligocene transition. Philosophical Transactions of the Royal Society. A: Mathematical, Physical and Engineering Sciences, 373, p. 20140419. doi.org/10.1098/rsta.2014.0419
- Elsworth, G., et al. (2017) Enhanced weathering and CO2 drawdown caused by latest Eocene strengthening of the Atlantic meridional overturning circulation. Nature Geoscience, 10, pp. 213–216. doi.org/10.1038/ngeo2888.
- Hutchinson, D. K., et al. (2019) Arctic closure as a trigger for Atlantic overturning at the Eocene-Oligocene Transition. Nature Communications, 10, pp. 1–9. doi.org/10.1038/s41467-019-11828-z.
- Gasson, E., et al. (2014) Uncertainties in the modelled CO2 threshold for Antarctic glaciation. Climate of the Past, 9, pp. 5701–5745. doi.org/10.5194/cp-10-451-2014.
- Livermore, R. A., et al. (2007) Drake Passage and Cenozoic climate: an open and shut case? Geochemistry Geophysics Geosystems, 8, p. Q01005. doi.org/10.1029/2005GC001224.
- Barker, P F (2001) Scotia Sea regional tectonic evolution: implications for mantle flow and palaeocirculation. Earth-Science Reviews, 55, pp. 1–39. doi.org/10.1016/S0012-8252(01)00055-1.
- Stickley, C. E., et al. (2004) Timing and nature of the deepening of the Tasmanian Gateway. Paleoceanography, 19, p. PA4027. doi.org/10.1029/2004PA001022.
- Scher, H. D., et al. (2015) Onset of Antarctic Circumpolar Current 30 million years ago as Tasmanian Gateway aligned with westerlies. Nature, 523, pp. 580–583. doi.org/10.1038/nature14598.
- Huber, M., et al. (2004) Eocene circulation of the Southern Ocean: was Antarctica kept warm by subtropical waters? Paleoceanography, 19, p. PA4026.
- Bijl, P. K., et al. (2018) Paleoceanography and ice sheet variability offshore Wilkes Land, Antarctica - Part 2: insights from Oligocene-Miocene dinoflagellate cyst assemblages. Climate of the Past, 14, pp. 1015–1033. doi.org/10.5194/cp-14-1015-2018.
- Lyle, M., et al. (2007) Late Oligocene initiation of the Antarctic circumpolar current: evidence from the South Pacific. Geology, 35, pp. 691–694. doi.org/10.1130/G23806A.1.
- Houben, A. J., et al. (2019) Late Eocene Southern Ocean cooling and invigoration of circulation preconditioned Antarctica for full‐scale glaciation. Geochemistry, Geophysics, Geosystems, 20, pp. 2214–2234. doi.org/10.1029/2019GC008182.
- Sijp, W. P., et al. (2011) Effect of the deepening of the Tasman Gateway on the global ocean. Paleoceanography, 26, p. PA4207. doi.org/10.1029/2011PA002143.
- Zhang, Z.‐S., et al. (2010) Has the Drake Passage played an essential role in the Cenozoic cooling? Atmospheric and Oceanic Science Letters, 3, pp. 288–292. doi.org/10.1080/16742834.2010.11446884.
- Viebahn, J. P., et al. (2016) Effects of Drake Passage on a strongly eddying global ocean. Paleoceanography and Paleoclimatology, 31, pp. 564–581. doi.org/10.1002/2015PA002888.
- LaCasce, J. H., et al. (2019) Jet instability over smooth, corrugated and realistic bathymetry. Journal of Physical Oceanography, 49, 585–605. doi.org/10.1175/JPO-D-18-0129.1.
- Hogg, A M & Munday, D R (2014) Does the sensitivity of Southern Ocean circulation depend upon bathymetric details? Philosophical Transactions of the Royal Society A, 372, p. 20130050. doi.org/10.1098/rsta.2013.0050.
- Hochmuth, K., et al. (2020) The evolving paleobathymetry of the circum‐Antarctic Southern Ocean since 34 Ma: a key to understanding past cryosphere‐ocean developments. Geochemistry Geophysics Geosystems, 21, p. e2020GC009122. doi.org/10.1029/2020GC009122.
- Hutchinson, D. K., et al. (2018) Climate sensitivity and meridional overturning circulation in the late Eocene using GFDL CM2. 1. Climate, 14, pp. 789–810. doi.org/10.5194/cp-14-789-2018.
- Douglas, P. M. J., et al. (2014) Pronounced zonal heterogeneity in Eocene southern high-latitude sea surface temperatures. Proceedings of the National Academy of Sciences, pp. 6582–6587. doi.org/10.1073/pnas.1321441111.
- Liu, Z., et al. (2009) Global cooling during the Eocene-Oligocene climate transition. Science, 323, pp. 1187–1190. doi.org/10.1126/science.1166368.
- Hollis, C. J., et al. (2012) Early Paleogene temperature history of the Southwest Pacific Ocean: reconciling proxies and models. Earth and Planetary Science Letters, 349, pp. 53–66. doi.org/10.1016/j.epsl.2012.06.024.
- Inglis, G. N., et al. (2015) Descent toward the Icehouse: Eocene sea surface cooling inferred from GDGT distributions. Paleoceanography, 30, pp. 1000–1020. doi.org/10.1002/2014PA002723.
- Tibbett, E. J., et al. (2021) Late Eocene record of hydrology and temperature from Prydz Bay, East Antarctica. Paleoceanography and Paleoclimatology, 36, p. e2020PA004204. doi.org/10.1029/2020PA004204.
- Bijl, P. K., et al. (2010) Transient Middle Eocene atmospheric CO2 and temperature variations. Science, 330, pp. 819–821. doi.org/10.1126/science.1193654.
- Hartman, J. D., et al. (2018) Paleoceanography and ice sheet variability offshore Wilkes Land, Antarctica–part 3: insights from Oligocene–Miocene TEX86-based sea surface temperature reconstructions. Climate, 14, pp. 1015–1033. doi.org/10.5194/cp-14-1275-2018.
- Hoem, F. S., et al. (2021) Temperate Oligocene surface ocean conditions offshore Cape Adare, Ross Sea, Antarctica. Climate of the Past, 17, pp. 1423–1442. doi.org/10.5194/cp-17-1423-2021.
- Donohue, K. A., et al. (2016) Mean Antarctic Circumpolar Current transport measured in Drake Passage. Geophyscial Research Letters, 43, pp. 11760–11767. doi.org/10.1002/2016GL070319.
- Toumoulin, A., et al. (2020) Quantifying the effect of the Drake Passage opening on the Eocene Ocean. Paleoceanography and Paleoclimatology, 35, p. e2020PA003889. doi.org/10.1029/2020PA003889.
- Mikolajewicz, U., et al. (1993) Effect of Drake Passage and Panamanian gateways on the circulation of an ocean model. Paleoceanography and Paleoclimatology, 8, pp. 409–426. doi.org/10.1029/93PA00893.
- Manabe, S & Terpstra, T B (1974) The effects of mountains on the general circulation of the atmosphere as identified by numerical experiments. Journal of the Atmospheric Sciences, 31, pp. 3–42. doi.org/10.1175/1520-0469(1974)031<0003:TEOMOT>2.0.CO;2.
- Manabe, S., et al. (1975) A global ocean–atmosphere climate model. Part I. The atmospheric circulation. Journal of Physical Oceanography, 5, pp. 3–29. doi.org/10.1175/1520-0485(1975)005<0003:AGOACM>2.0.CO;2.
- Cramwinckel, M. J., et al. (2020) Surface-circulation change in the southwest Pacific Ocean across the Middle Eocene Climatic Optimum: inferences from dinoflagellate cysts and biomarker paleothermometry. Climate of the Past, 16, pp. 1667–1689. doi.org/10.5194/cp-16-1667-2020.
- Bijl, P. K., et al. (2013) Eocene cooling linked to early flow across the Tasmanian Gateway. Proceedings of the National Academy of Sciences of the United States of America, 110, pp. 9645–9650. doi.org/10.1073/pnas.1220872110.
- Bijl, P. K., et al. (2011) Environmental forcings of Paleogene Southern Ocean dinoflagellate biogeography. Paleoceanography and Paleoclimatology, 26, p. 1. doi.org/10.1029/2009PA001905.
- Sol González-Estebenet, M., et al. (2014) Middle Eocene Dinoflagellate cysts from Santa Cruz Province, Argentina: biostratigraphy and paleoenvironment. Review of Palaeobotany and Palynology, 211, pp. 55–65.
- Scher, H D & Martin, E E (2006) Timing and climatic consequences of the opening of Drake Passage. Science, 312, pp. 428–430. doi.org/10.1126/science.1120044.
- Matthews, K. J., et al. (2016) Global plate boundary evolution and kinematics since the late Paleozoic. Global and Planetary Change, 146, pp. 226–250. doi.org/10.1016/j.gloplacha.2016.10.002.
- van Hinsbergen, D. J., et al. (2015) A paleolatitude calculator for paleoclimate studies. PLoS ONE, 10, p. e0126946. doi.org/10.1371/journal.pone.0126946.
- Teckler, M S & Watts, A B (1978) Subsidence of the Atlantic-type continental margin off New York. Earth and Planetary Science Letters, 41, pp. 1–13. doi.org/10.1016/0012-821X(78)90036-5.
- Wold, C N (1995) Palaeobathymetric reconstruction on a gridded database: the northern North Atlantic and southern Greenland-Iceland-Norwegian sea. Geological Society, London, Special Publications, 90, pp. 271–302. doi.org/10.1144/GSL.SP.1995.090.01.17.
- Baatsen, M., et al. (2016) Reconstructing geographical boundary conditions for palaeoclimate modeling during the Cenozoic. Climate of the Past, 12, 1635–1644. doi.org/10.5194/cp-12-1635-2016.
- Weatherall, P., et al. (2015) A new digital bathymetric model of the world’s oceans. Earth Space Science, 2, pp. 331–345. doi.org/10.1002/2015EA000107.
- Haq, B U & Al-Qahtani, A M (2005) Phanerozoic cycles of sea-level change on the Arabian Platform. GeoArabia, 10, pp. 127–160. doi.org/10.2113/geoarabia1002127.
- Müller, R. D. et al. (2018) Dynamic topography of passive continental margins and their hinterlands since the Cretaceous. Gondwana Research, 53, pp. 225–251. doi.org/10.1016/j.gr.2017.04.028.
- Brown, B., et al. (2006) Circum-Antarctic palaeobathymetry: illustrated examples from Cenozoic to recent times. Palaeogeography, Palaeoclimatology, Palaeoecology, 231, pp. 158–168. doi.org/10.1016/j.palaeo.2005.07.033.
- LaCasce, J-H (2017) The prevalence of oceanic surface modes. Geophysical Research Letters, 44, 11097–11105. doi.org/10.1002/2017GL075430.
- Sauermilch, I., et al. (2019) Tectonic, oceanographic, and climatic controls on the Cretaceous‐Cenozoic Sedimentary Record of the Australian‐Antarctic Basin. JGR Solid Earth, 124, pp. 7699–7724. doi.org/10.1029/2018JB016683.
- Lindeque, A., et al. (2016) Preglacial to glacial sediment thickness grids for the Southern Pacific Margin of West Antarctica. Geochemistry Geophysics Geosystems, 17, pp. 4276–4285. doi.org/10.1002/2016GC006401.
- De Santis, L., et al. (1999) The Eastern Ross Sea continental shelf during the Cenozoic: implications for the West Antarctic ice sheet development. Global and Planetary Change, 23, pp. 173–196. doi.org/10.1016/S0921-8181(99)00056-9.
- Leitchenkov, G L (2007) Cenozoic Environmental Changes Along the East Antarctic Continental Margin Inferred from Regional Seismic Stratigraphy. Antarctica: a Keystone in a Changing World. Online Proc. 10th Int. Symp. on Antarctic Earth Science. Report No. 2007-1047-SRP-005 (USGS–US National Academy).
- Sykes, T J S (1996) A correction for sediment load upon the ocean floor: uniform versus varying sediment density estimations—implications for isostatic correction. Marine Geology, 133, pp. 35–49. doi.org/10.1016/0025-3227(96)00016-3.
- Stein, C A & Stein, S (1992) A model for the global variation in oceanic depth and heat flow with lithospheric age. Nature, 359, p. 123. doi.org/10.1038/359123a0.
- McKenzie, D (1978) Some remarks on the development of sedimentary basins. Earth and Planetary Science Letters, 40, pp. 25–32. doi.org/10.1016/0012-821X(78)90071-7.
- Eagles, G & Jokat, W (2014) Tectonic reconstructions for paleobathymetry in Drake Passage. Tectonophysics, 611, pp. 28–50. doi.org/10.1016/j.tecto.2013.11.021.
- Marshall, J., et al. (1997) A finite‐volume, incompressible Navier Stokes model for studies of the ocean on parallel computers. Journal of Geophysical Research, 102, pp. 5753–5766. doi.org/10.1029/96JC02775.
- Hill, D. J., et al. (2013) Paleogeographic controls on the onset of the Antarctic circumpolar current. Geophysical Research Letters, 40, pp. 5199–5204. doi.org/10.1002/grl.50941.
- Griffies, S. M., et al. (2015) Impacts on ocean heat from transient mesoscale eddies in a hierarchy of climate models. Journal of Climate, 28, pp. 952–977. doi.org/10.1175/JCLI-D-14-00353.1.
- Morrison, A. K., et al. (2013) The role of vertical eddy flux in Southern Ocean heat uptake. Geophysical Research Letters, 40, pp. 5445–5450. doi.org/10.1002/2013GL057706.
- Newsom, E. R., et al. (2016) Southern Ocean deep circulation and heat uptake in a high-resolution climate model. Journal of Climate, 29, pp. 2597–2619. doi.org/10.1175/JCLI-D-15-0513.1.
- Jackett, D R & Trevor, J M (1995) Minimal adjustment of hydrographic profiles to achieve static stability. Journal of Atmospheric and Oceanic Technology, 12, pp. 381–389. doi.org/10.1175/1520-0426(1995)012<0381:MAOHPT>2.0.CO;2.
- Daru, V & Tenaud, C H (2004) High order one-step monotonicity-preserving schemes for unsteady compressible flow calculations. Journal of Computational Physics, 193, pp. 563–594. doi.org/10.1016/j.jcp.2003.08.023.
- Large, W G (1994) Oceanic vertical mixing: a review and a model with a nonlocal boundary layer parameterization. Reviews of Geophysics, 32, pp. 363–403. doi.org/10.1029/94RG01872.
- Gent, P R & McWilliams, J C (1990) Isopycnal mixing in ocean circulation models. Journal of Physical Oceanography, 20, pp. 150–155. doi.org/10.1175/1520-0485(1990)020<0150:IMIOCM>2.0.CO;2.