The United Nations reported the Decade on Environmental Restoration in June 2021 to prevent, slow, and reverse ecosystem degradation worldwide. Large-scale tree restoration is critical for combating climate change, biodiversity enhancement, and ecosystem services protection. This article looks at a recent study published in Nature Geoscience, which details shifts in regional water availability caused by global tree restoration.

Image Credit: GoncharukMaks/Shutterstock.com
It is projected that an extra 900 million hectares of tree cover might exist on Earth’s surface under current climate conditions without intruding on agriculture or metropolitan areas. Several global and regional projects to enhance tree cover have been launched in the last decade, and this will play an essential role in influencing global land use in the coming decades.
Despite these continuous efforts and assertions that ecosystem restoration benefits all of the Sustainable Development Goals, the effect of tree planting on the water cycle and the availability of water remains unknown. As a result, the potential effects of ecosystem restoration on water supply downstream and downwind are frequently underestimated.
Radiation balance, infiltration and soil water storage, evaporation, streamflow, and precipitation are all affected by the increase in tree cover. Local influences of forest cover on streamflow have historically been studied primarily utilizing a paired catchment technique.
Researchers calculate how large-scale forest restoration affects the availability of water and streamflow in the idealized study.
They assess the influence of a recent estimate of the worldwide tree-restoration potential (Figure 1a) on evaporation, precipitation, and streamflow fluxes.
In addition, they also tested the multimodel streamflow against big river-basin run-off under current climate and forest-cover conditions (Figure 1b).
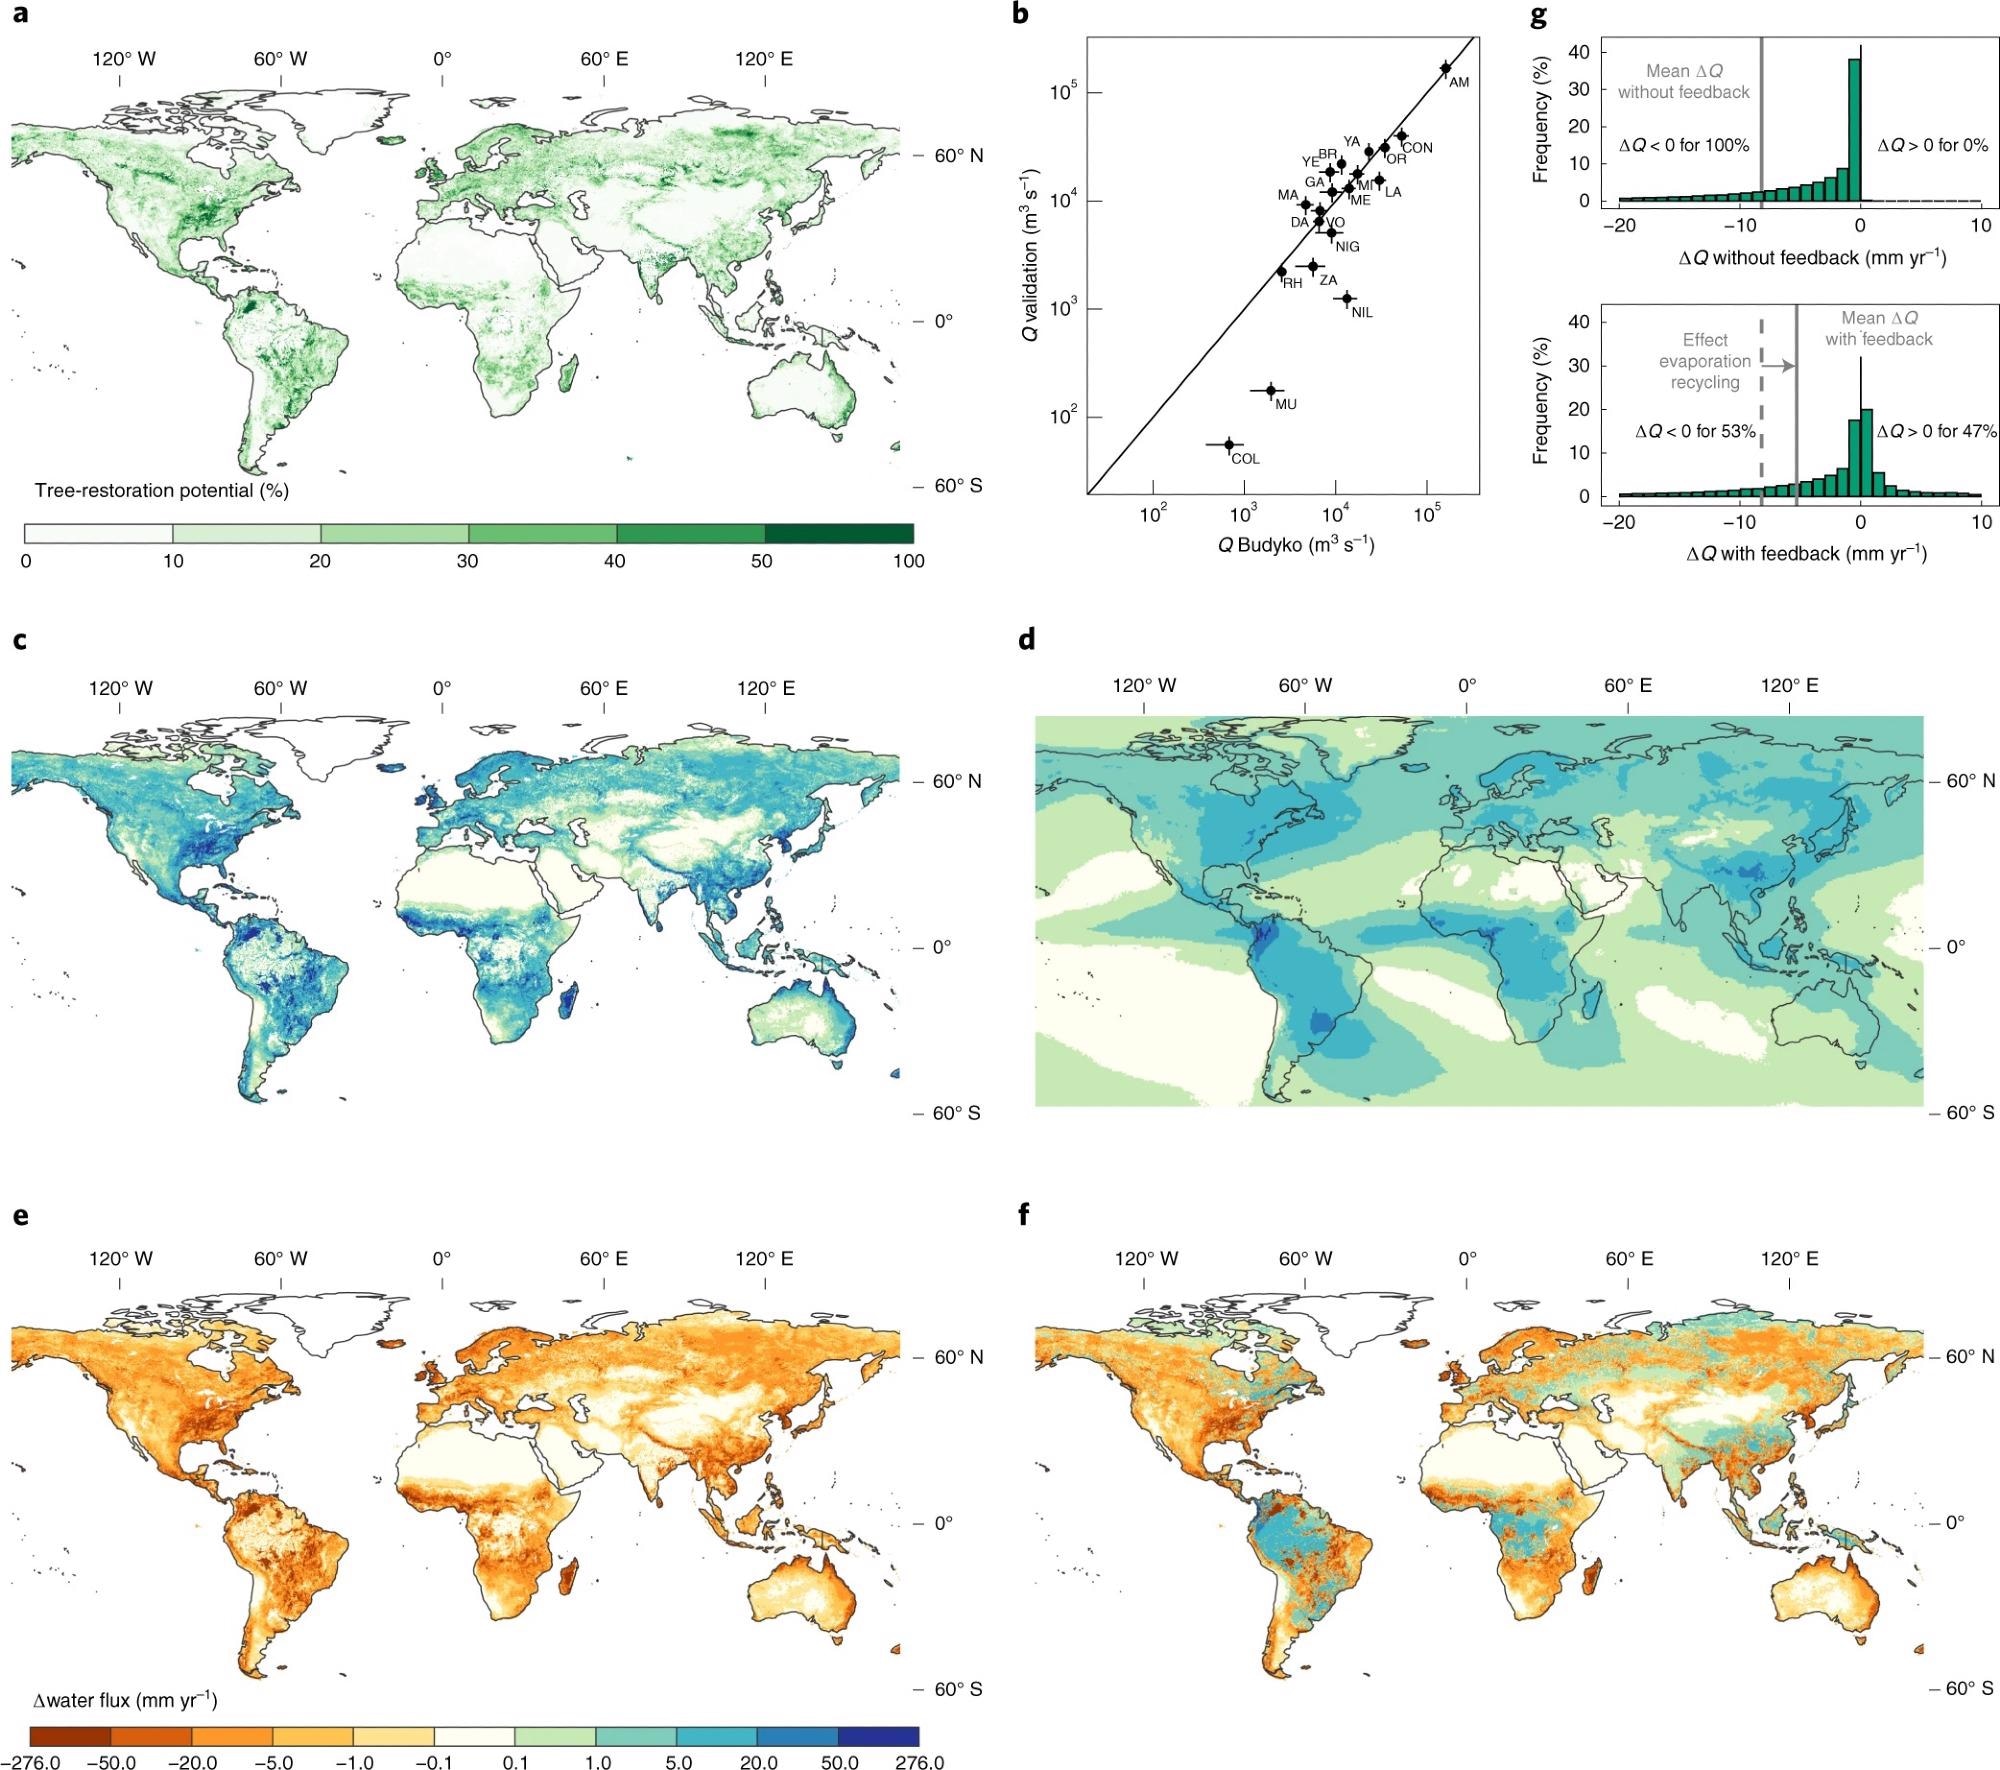
Figure 1. Impacts of forest restoration on water fluxes and water availability. a, The tree-restoration potential: the percentage area of each pixel that is suitable for tree restoration. b, Model ensemble mean versus observed streamflow (Q) measurements for 19 validated river basins. The error bars for Q Budyko indicate the standard deviation over the six Budyko models. The error bars for Q validation indicate a 20% error. The river basins are Amazon (AM), Brahmaputra (BR), Colorado (COL), Congo (CON), Danube (DA), Ganges (GA), La Plata (LA), Mackenzie (MA), Mekong (ME), Mississippi (MI), Murray–Darling (MU), Niger (NIG), Nile (NIL), Orinoco (OR), Rhine (RH), Volga (VO), Yangtze (YA), Yenisei (YE) and Zambezi (ZA). c–f, The absolute annual change in water fluxes after tree restoration: change in evaporation (c), precipitation (d), water availability without evaporation recycling (e) and water availability with evaporation recycling (f). Note that e is the inverse of c: without the feedback of evaporation recycling, the local increase in evaporation equals the local decrease in water availability. g, The histogram shows the distribution of the global changes in water availability without and with evaporation recycling; 89% (without recycling) and 91% (with recycling) of the data fall within the displayed range of –20 mm yr–1 to +10 mm yr–1. All maps display the 0.1° mean value, except for c, which displays the 0.5° mean value. Image Credit: Hoek van Dijke, et al., 2022
Researchers combine the direct and indirect effects of tree restoration at the river-basin size for 21 significant river basins to assess the implications of tree restoration at the river-basin scale. Improved evaporation reduces streamflow in all river basins (up to 9%), although streamflow loss can be close to nil when increased precipitation overcomes increased evaporation (Figure 2).
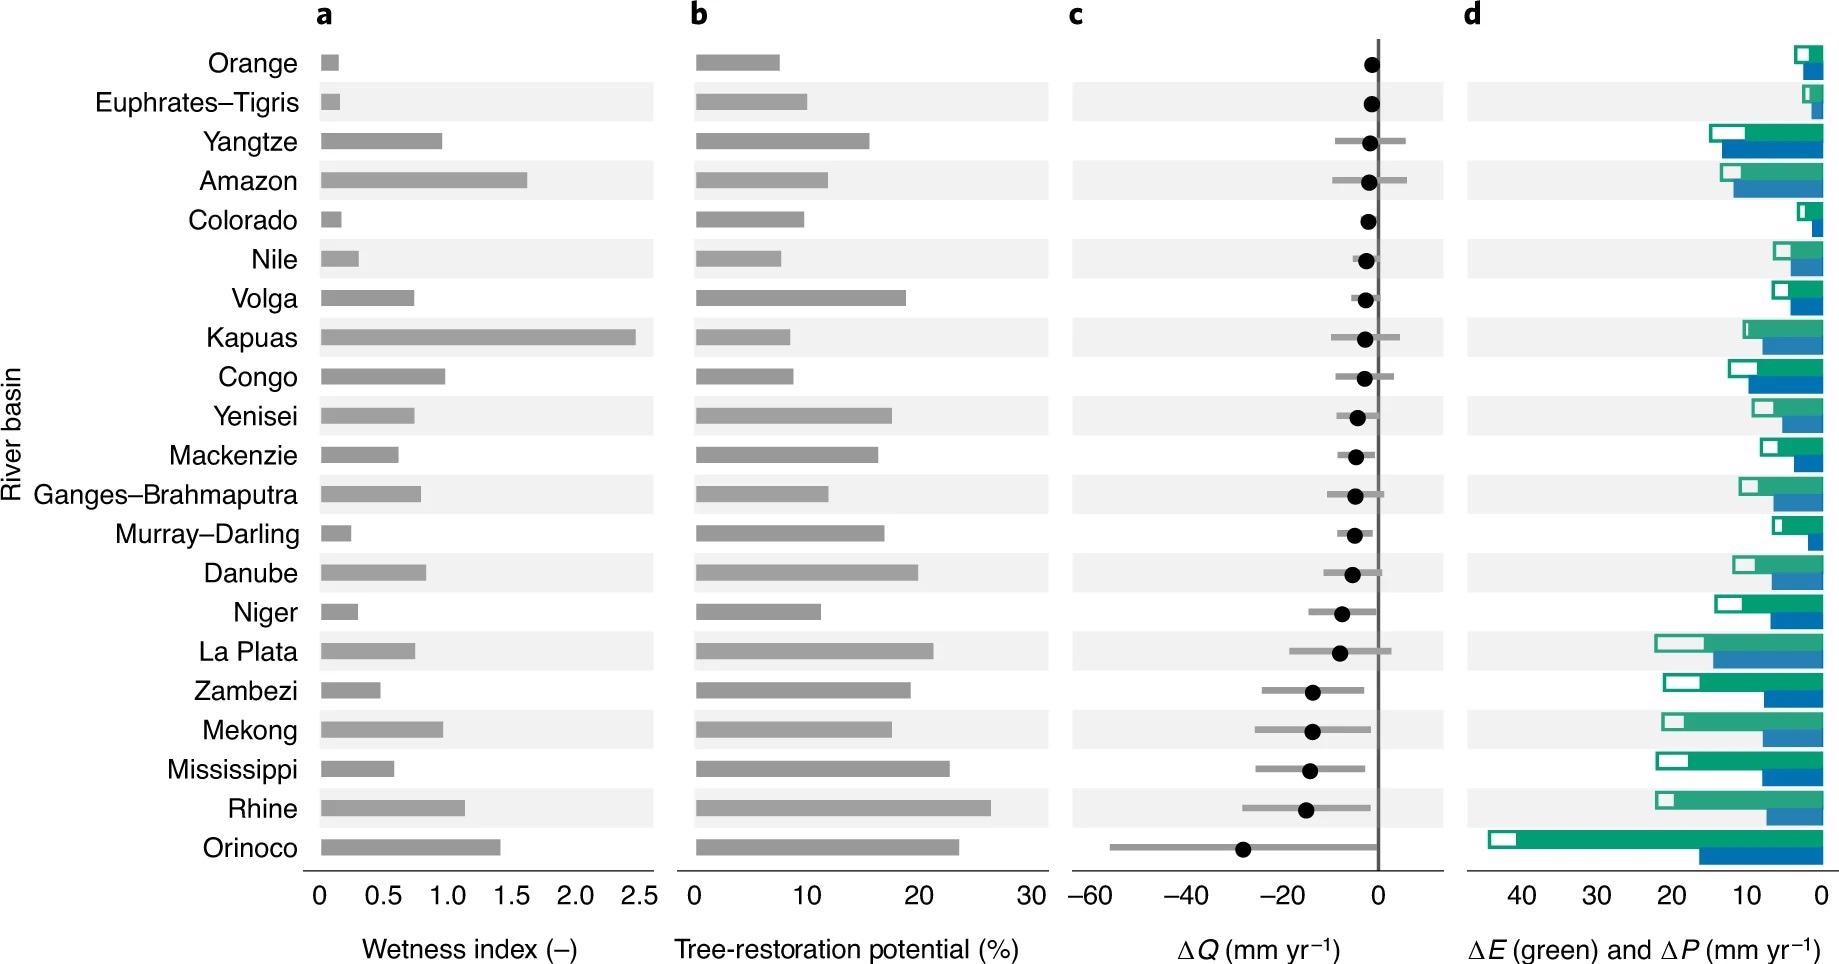
Figure 2. Impacts of global tree restoration on hydrological fluxes in selected river basins. a,b, Mean wetness index (ratio of precipitation to potential evaporation; a) and tree-restoration potential (b) for each river basin. c, The change in streamflow (ΔQ) with evaporation recycling. The dots indicate the mean river-basin change in streamflow, and the bars indicate one standard deviation (the variation over the six Budyko models). d, The change in evaporation (ΔE, in green) and precipitation (ΔP, in blue). The green bar indicates the increase in evaporation without evaporation recycling, and the green line indicates the increase in evaporation with evaporation recycling (the increase in evaporation when taking into account the increased precipitation). The river basins are sorted from the lowest to the highest decrease in streamflow. The river-basin boundaries are taken from reference 31. Image Credit: Hoek van Dijke, et al., 2022
Since arid environments may only support tree growth if there is sufficient groundwater convergence, many river basins with a poor wetness index (water-limited basins) have a low tree-restoration capability.
Evaporation and precipitation alter very little in these desert river basins. Considering the indirect benefit of evaporation recycling, streamflow will drop in most of the world’s major river basins after forest restoration.
This research reveals that large-scale tree restoration will alter regional water availability. Since water supply from evaporation recycling is insufficient to compensate for evaporation loss, the hot locations for forest restoration may see a significant decline in water availability (Figure 3a).
However, due to the lateral flow of evaporated water into the region, locations with minimal tree-restoration potential may witness an increase in water availability. This demonstrates the need to properly strategize forest restoration projects.
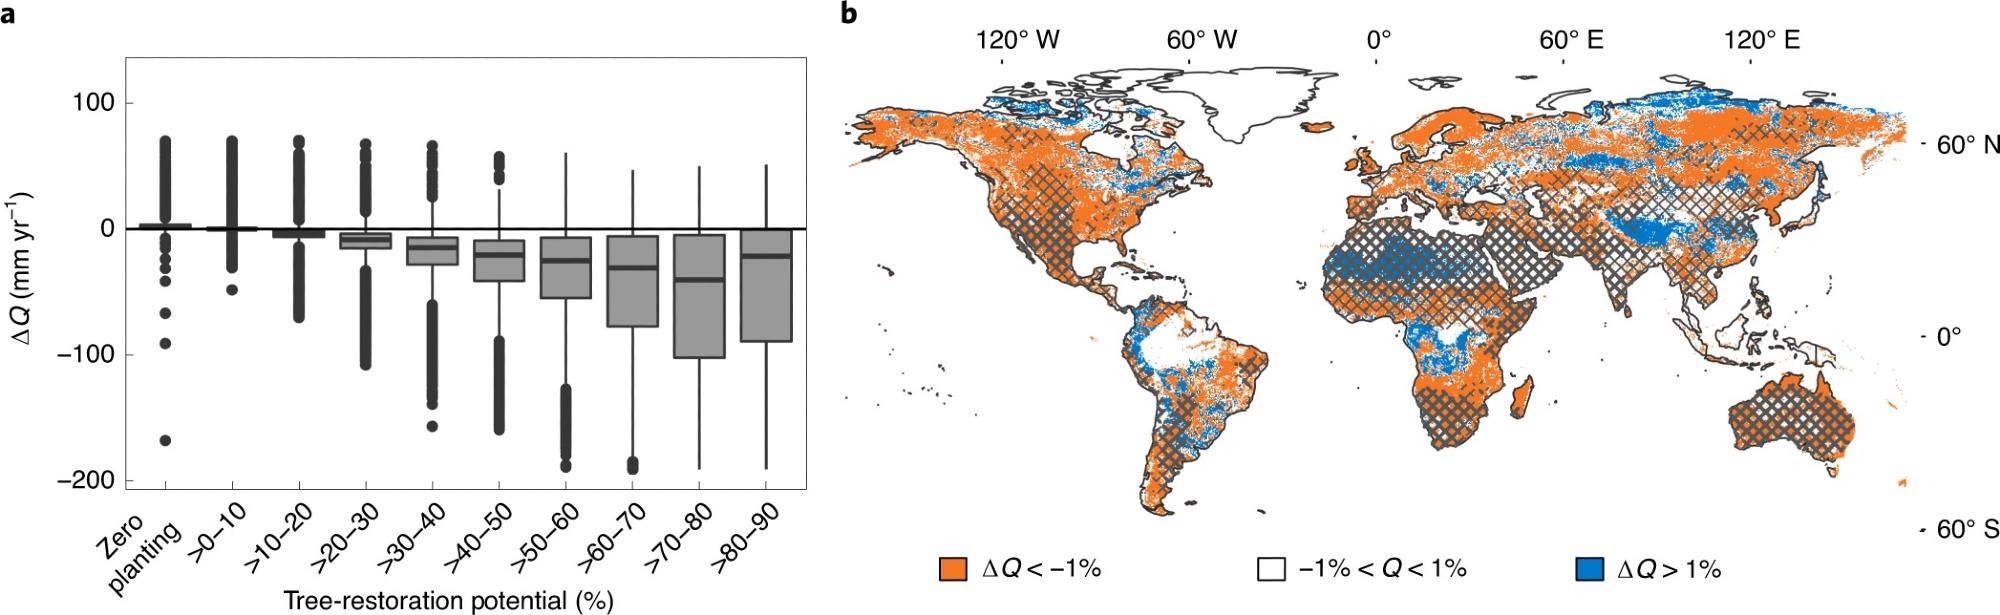
Figure 3. Implications of the percentage restored area and the implications for water scarcity. (a) Water availability could decrease in ‘hot spots for tree restoration’. The lower, middle, and upper boundaries of the boxes display the 25th, 50th, and 75th percentiles of the data (the interquartile range), respectively. The lines extend to a maximum of 1.5 times the interquartile range. (b) Water availability will decrease in several regions that currently face water scarcity: the color indicates whether local water availability will decrease (orange) or increase (blue) following the studied tree-restoration scenario. The cross-hatched regions currently face freshwater scarcity for at least three months per year, and the bold hatched regions face freshwater scarcity for at least nine months per year. Note that we quantified the change in water availability on an annual timescale. The sign of change could vary seasonally, and water availability could, for example, decrease every year but remain equal, or even increase, in the dry season. Image Credit: Hoek van Dijke, et al., 2022
Another significant conclusion is that this tree-restoration scenario could reduce annual water availability even further in certain locations that are already experiencing water constraints (Figure 3b).
Trees have been shown to improve soil porosity and organic carbon levels. As a result, tree restoration, particularly in treeless areas, improves infiltration and soil water storage capacity while reducing overland flow. Soils might store more water after tree regeneration, which would be partially mediated during the dry season.
Results and Discussion
The reported conclusions are based on cutting-edge data and methods, although various feedbacks and processes are left out of the calculations. The possible effects of enhanced tree cover on atmospheric circulation and land-atmosphere interactions are not considered in the methodology.
Localized tree restoration could improve convergence, cloud cover, and precipitation, as well as change the direction and distance traveled by atmospheric moisture.
Furthermore, the influence of tree restoration under current climate conditions is proposed in this research. However, global warming and forest regeneration will alter temperature and precipitation patterns, which are not taken into account in current calculations. By 2050, higher temperatures could diminish the worldwide tree-restoration capability by 25%.
Methodology
Researchers evaluate how a realistic large-scale tree restoration scenario will affect evaporation (E), precipitation (P), and streamflow fluxes (Q). There are four steps in the process: Before restoration, researchers employ Budyko models to determine E and Q. They estimate E and Q after restoration without evaporation recycling using Budyko models. Then, they evaluate P after restoration using the UTrack dataset and the rise in E is estimated in steps 1 and 2. To compute E and Q after restoration using evaporation recycling, they use Budyko models.
Conclusion
The impacts of worldwide large-scale forest regeneration on water fluxes, particularly evaporation recycling, were calculated in this research. The findings reveal that tree restoration affects the availability of water and streamflow on a local and continental scale and that trends of raising or lowering water availability are complicated over the world.
Increased precipitation following tree restoration may boost local water availability; nonetheless, researchers discover a global net loss in water availability across continents. Other data-driven or model-based investigations of the effects of land-cover change on water flows have reached similar conclusions.
Researchers emphasize the importance of considering the hydrological implications in future tree-restoration plans. To protect the water supply locally and remotely, or to improve the water supply in water-scarce locations, smart tree-restoration measures are required.
Journal Reference:
Hoek van Dijke, A. J., Herold, M., Mallick, K., Benedict, I., Machwitz, M., Schlerf, M., Teuling, A. J. (2022) Shifts in regional water availability due to global tree restoration. Nature Geoscience, 15(5), pp. 363-368. Available Online: https://www.nature.com/articles/s41561-022-00935-0.
References and Further Reading
- Griscom, B. W., et al. (2017) Natural climate solutions. Proceedings of the National Academy of Sciences of the United States of America, 114, pp. 11645–11650. doi.org/10.1073/pnas.1710465114.
- Bastin, J. F., et al. (2019) The global tree restoration potential. Science, 365, pp. 76–79. doi.org/10.1126/science.aax0848.
- Land Restoration for Achieving the Sustainable Development Goals (2019 ) (International Resource Panel).
- Wang-Erlandsson, L., et al. (2018) Remote land use impacts on river flows through atmospheric teleconnections. Hydrology and Earth System Sciences, 22, pp. 4311–4328. doi.org/10.5194/hess-22-4311-2018.
- Seijger, C., et al. (2021) Water and sectoral policies in agriculture–forest frontiers: an expanded interdisciplinary research approach. Ambio, 50, pp. 2311–2321. doi.org/10.1007/s13280-021-01555-5.
- Ellison, D (2018) Forests and Water Background Analytical Study 2 (UN Forum on Forests).
- Brown, A. E., et al. (2005) A review of paired catchment studies for determining changes in water yield resulting from alterations in vegetation. Journal of Hydrology, 310, pp. 28–61. doi.org/10.1016/j.jhydrol.2004.12.010.
- Bosch, J M & Hewlett, J D (1982) A review of catchment experiments to determine the effect of vegetation changes on water yield and evapotranspiration. Journal of Hydrology, 55, pp. 3–23. doi.org/10.1016/0022-1694(82)90117-2.
- Farley, K. A., et al. (2005) Effects of afforestation on water yield: a global synthesis with implications for policy. Global Change Biology, 11, pp. 1565–1576. doi.org/10.1111/j.1365-2486.2005.01011.x.
- Jackson, R. B., et al. (2005) Trading water for carbon with biological carbon sequestration. Science, 310, pp. 1944–1947. doi.org/10.1126/science.1119282.
- Zhang, L., et al. (2001) Response of mean annual evapotranspiration to vegetation changes at catchment scale. Water Resources Research, 37, pp. 701–708. doi.org/10.1029/2000WR900325.
- Filoso, S., et al. (2017) Impacts of forest restoration on water yield: a systematic review. PLoS ONE, 12, p. e0183210. doi.org/10.1371/journal.pone.0183210.
- Ning, T., et al. (2020) Effects of forest cover change on catchment evapotranspiration variation in China. Hydrological Processes, 34, pp. 2219–2228. doi.org/10.1002/hyp.13719.
- Sun, G., et al. (2006) Potential water yield reduction due to forestation across China. Journal of Hydrology, 328, pp. 548–558. doi.org/10.1016/j.jhydrol.2005.12.013.
- Huxman, T. E., et al. (2005) Ecohydrological implications of woody plant encroachment. Ecology, 86, pp. 308–319. doi.org/10.1890/03-0583.
- Ellison, D., et al. (2012) On the forest cover–water yield debate: from demand- to supply-side thinking. Global Change Biology, 18, pp. 806–820. doi.org/10.1111/j.1365-2486.2011.02589.x.
- Spracklen, D. V., et al. (2012) Observations of increased tropical rainfall preceded by air passage over forests. Nature, 489, pp. 282–285. doi.org/10.1038/nature11390.
- Meier, R. et al., (2021) Empirical estimate of forestation-induced precipitation changes in Europe. Nature Geoscience, 14, pp. 473–478. doi.org/10.1038/s41561-021-00773-6.
- Keys, P. W., et al. (2016) Revealing invisible water: moisture recycling as an ecosystem service. PLoS ONE, 11, p. e0151993. doi.org/10.1371/journal.pone.0151993.
- Lawrence, D & Vandecar, K (2015) Effects of tropical deforestation on climate and agriculture. Nature Climate Change, 5, pp. 27–36. doi.org/10.1038/nclimate2430.
- Li, Y., et al. (2018) Divergent hydrological response to large-scale afforestation and vegetation greening in China. Science Advances, 4, p. eaar4182. doi.org/10.1126/sciadv.aar4182.
- te Wierik, S. A., et al. (2021) Reviewing the impact of land use and land-use change on moisture recycling and precipitation patterns. Water Resources Research, 57, p. e2020WR029234. doi.org/10.1029/2020WR029234.
- Tuinenburg, O. A., et al. (2020) High-resolution global atmospheric moisture connections from evaporation to precipitation. Earth System Science Data, 12, pp. 3177–3188. doi.org/10.5194/essd-12-3177-2020.
- Zhang, L. et al., (2004) A rational function approach for estimating mean annual evapotranspiration. Water Resources Research, 40, p. W02502. doi.org/10.1029/2003WR002710.
- Oudin, L., et al. (2008) Has land cover a significant impact on mean annual streamflow? An international assessment using 1508 catchments. Journal of Hydrology, 357, pp. 303–316. doi.org/10.1016/j.jhydrol.2008.05.021.
- Zhou, S., et al. (2015) The complementary relationship and generation of the Budyko functions. Geophysical Research Letters, 42, pp. 1781–1790. doi.org/10.1002/2015GL063511.
- Teuling, A. J. et al. (2019) Climate change, reforestation/afforestation, and urbanization impacts on evapotranspiration and streamflow in Europe. Hydrology and Earth System Sciences, 23, pp. 3631–3652. doi.org/10.5194/hess-23-3631-2019.
- Tuinenburg, O. A., et al. (2020) Global Evaporation to Precipitation Flows Obtained with Lagrangian Atmospheric Moisture Tracking (Pangaea) doi.org/10.1594/PANGAEA.912710.
- Tuinenburg, O A & Staal, A (2020) Tracking the global flows of atmospheric moisture and associated uncertainties.Hydrology and Earth System Sciences,24, pp. 2419–2435. doi.org/10.5194/hess-24-2419-2020.
- In-Situ River Discharge Data (GRDC, accessed 19 April 2021) Available at: https://www.bafg.de/GRDC.
- Lehner, B., et al. (2008) New global hydrography derived from spaceborne elevation data. Eos, 89, 93–94. doi.org/10.1029/2008EO100001.
- Van Der Ent, R J & Savenije, H H G (2011) Length and time scales of atmospheric moisture recycling. Atmospheric Chemistry and Physics, 11, pp. 1853–1863. doi.org/10.5194/acp-11-1853-2011.
- Roebroek, C. T. J., et al. (2020) Global distribution of hydrologic controls on forest growth. Hydrology and Earth System Sciences, 24, pp. 4625–4639. doi.org/10.5194/hess-24-4625-2020.
- Mekonnen, M M & Hoekstra, AY (2016) Four billion people facing severe water scarcity. Science Advances, 2, p. e1500323. doi.org/10.1126/sciadv.1500323.
- Ellison, D., et al. (2019) Upwind forests: managing moisture recycling for nature-based resilience. Unasylva, 70, pp. 14–26.
- van der Ent, R. J., et al. (2010) Origin and fate of atmospheric moisture over continents. Water Resources Research, 46, p. W09525. doi.org/10.1029/2010WR009127.
- Lal, R (1996) Deforestation and land-use effects on soil degradation and rehabilitation in western Nigeria. I. Soil physical and hydrological properties. Land Degradation & Development, 7, pp. 19–45. doi.org/10.1002/(SICI)1099-145X(199603)7:1%3C19::AID-LDR212%3E3.0.CO;2-M.
- Ellison, D., et al. (2017) Trees, forests and water: cool insights for a hot world. Global Environmental Change, 43, pp. 51–61. doi.org/10.1016/j.gloenvcha.2017.01.002.
- Bargués Tobella, A., et al. (2014) The effect of trees on preferential flow and soil infiltrability in an agroforestry parkland in semiarid Burkina Faso. Water Resources Research, 50, pp. 3342–3354. doi.org/10.1002/2013WR015197.
- Ilstedt, U., et al. (2016) Intermediate tree cover can maximize groundwater recharge in the seasonally dry tropics. Scientific Reports, 6, p. 21930. doi.org/10.1038/srep21930.
- Spracklen, D. V., et al. (2018) The effects of tropical vegetation on rainfall. Annual Review of Environment and Resources, 43, pp. 193–218. doi.org/10.1146/annurev-environ-102017-030136.
- Ellison, D & Ellis, E (2020) Forest Cover, Windspeed, and Precipitation: A South American Case Study of the Impact of Forest Ecosystems on Wind and Rainfall Patterns EGU2020-22235 (EGU General Assembly); https://doi.org/10.5194/egusphere-egu2020-22235.
- Xu, R., et al. (2020) Contrasting impacts of forests on cloud cover based on satellite observations. Nature Communications, 13, p. 670. doi.org/10.1038/s41467-022-28161-7.
- Makarieva, A M & Gorshkov, V G (2007) Biotic pump of atmospheric moisture as driver of the hydrological cycle on land. Hydrology and Earth System Sciences, 11, pp. 1013–1033. doi.org/10.5194/hess-11-1013-2007.
- Sheil, D & Murdiyarso, D (2009) How forests attract rain: an examination of a new hypothesis. BioScience, 59, pp. 341–347. doi.org/10.1525/bio.2009.59.4.12.
- Swann, A. L. S., et al. (2018) Continental-scale consequences of tree die-offs in North America: identifying where forest loss matters most. Environmental Research Letters, 13, p. 055014.
- Yosef, G., et al. (2018) Large-scale semi-arid afforestation can enhance precipitation and carbon sequestration potential. Scientific Reports, 8, p. 996. doi.org/10.1038/s41598-018-19265-6.
- Bonan, G. B (2008) Forests and climate change: forcings, feedbacks, and the climate benefits of forests. Science, 320, pp. 1444–1449. doi.org/10.1126/science.1155121.
- Perugini, L., et al. (2017) Biophysical effects on temperature and precipitation due to land cover change. Environmental Research Letters, 12, p. 053002.
- Konapala, G., et al. (2020) Climate change will affect global water availability through compounding changes in seasonal precipitation and evaporation. Nature Communications, 11, p. 3044. https://www.nature.com/articles/s41467-020-16757-w.
- Vecchi, G. A., et al. Weakening of tropical Pacific atmospheric circulation due to anthropogenic forcing. Nature, 441, pp. 73–76 (2006). doi.org/10.1038/nature04744.
- Shaw, T. A (2019) Mechanisms of future predicted changes in the zonal mean mid-latitude circulation. Current Climate Change Reports, 5, pp. 345–357. doi.org/10.1007/s40641-019-00145-8.
- Jennifer, F & Natasa, S (2015) Evidence linking rapid Arctic warming to mid-latitude weather patterns. Philosophical Transactions of the Royal Society A, 373, p. 20140170. doi.org/10.1098/rsta.2014.0170.
- Coumou, D., et al. (2018) The influence of Arctic amplification on mid-latitude summer circulation. Nature Communications, 9, p. 2959. doi.org/10.1038/s41467-018-05256-8.
- Beck, H. E., et al. (2019) MSWEP V2 global 3-hourly 0.1 precipitation: methodology and quantitative assessment. Bulletin of the American Meteorological Society, 100, pp. 473–500. doi.org/10.1175/BAMS-D-17-0138.1.
- Trabucco, A & Zomer, R J (2018) Global Aridity Index and Potential Evapo-Transpiration (ET0) Climate Database v2. Figshare, doi.org/10.6084/m9.figshare.7504448.v3.
- Hansen, M. C., et al. (2013) High-resolution global maps of 21st-century forest cover change. Science, 342, pp. 850–853. doi.org/10.1126/science.1244693.
- Muñoz Sabater, J (2020) ERA5-Land monthly averaged data from 1981 to present. Copernicus, doi.org/10.24381/cds.68d2bb30.
- Budyko, M I (1974) Climate and Life (Academic Press).
- Loveland, T. R., et al. (2000) Development of a global land cover characteristics database and IGBP DISCover from 1 km AVHRR data. International Journal of Remote Sensing, 21, pp. 1303–1330. doi.org/10.1080/014311600210191.