The European Green Deal introduced by the European Commission (EC) in 2019 outlines the main policy initiatives for achieving net-zero greenhouse gas (GHG) emissions by 2050. Clean hydrogen has been identified as a priority area for achieving carbon neutrality by 2050.
Image Credit: Alexander Kirch/Shutterstock.com
The two key aspects are decarbonization of hydrogen and using hydrogen as a flexible energy carrier for industry and transport to reduce GHG and particle emissions. Phase 1 of the deal (from now until 2030) aims to install at least 6 GW of electrolyzers powered by renewable energy between 2020 and 2024.
Phase 2 (from 2030 until 2050) will see an increase in the demand for renewable hydrogen. Implementation of the Green Deal is expected to decrease the oil product demand and the associated hydrogen consumption. However, the deep decarbonization of industries could outbalance this decline.
Currently, nearly 120 Mt of hydrogen is produced worldwide annually, of which two-thirds is pure hydrogen and one-third is in mixture with other gases. About 95% of all hydrogen is generated from natural gas and coal, and roughly 5% is produced as a by-product from chlorine production. At present, there is no significant hydrogen production from renewable sources.
The global economic potential of hydrogen from renewable electricity is estimated to vary from 19 EJ (5277 TWh or 135 Mt) to 80 EJ (22222 TWh or 568 Mt, not necessarily all from renewables).
Renewable hydrogen has significant decarbonization potential and is thus the most compatible option with the EU’s climate neutrality goal. A 40 MW wind park coupled with electrolyzers is planned near a chemical industry site in Germany by VNG, Uniper, Terrawatt, and DBI. Similar upscaling efforts are occurring in other European countries as well as in Australia, China, Japan, and elsewhere.
Fossil-based hydrogen with carbon capture and storage (CCS) will be an additional option when the technology scales and reaches market maturity (blue hydrogen). However, such hydrogen is not necessarily CO2-free.
Fossil-based hydrogen produced from conventional steam methane reforming (SMR) or coal gasification currently represents the primary sources of global hydrogen production (grey hydrogen). This practice is not sustainable and contributes to emissions. Hydrogen can also be produced by using nuclear energy but involves high socio-economic risks.
This article offers a first analysis and estimation of the technical potential to decarbonize hydrogen demand by producing green hydrogen with electrolyzers powered by a combination of local RES resources. It is the first study to offer an estimation of the potential technical capacity to cover existing hydrogen needs with green hydrogen at the national and regional level with open source georeferenced data.
Data and Methods
This article evaluates the viability of producing green hydrogen from solar, wind, and hydropower resources. The analysis essentially compares the potential electricity demand for moving to green hydrogen industrial production with the renewable energy potentials (solar, wind, hydro) net of that need to cover existing total electricity consumption across all sectors. This was performed by collecting, harmonizing, and aggregating several open-source data.
Hydrogen Production and Energy Demand at National and Regional Level in EU
The total annual production of hydrogen in Europe is in the range of 9.756 Mt. Oil refineries (ca. 52%) and ammonia production (ca. 43%) industries are the major consumers of hydrogen.
This is a geospatial analysis and so the first step is to locate the main hubs of hydrogen production in Europe that make up the current annual production: merchant, which supplies hydrogen to other industrial customers; captive, where the hydrogen remains on site for use, and, lastly, the hydrogen that has no further use within the process or on-site. Only hydrogen in the last category can be made available for other applications.
The hydrogen production hubs were geo-located in a GIS environment and the annual production volumes were aggregated at NUTS2 regional level, as shown in Figure 1. These selected hubs are typically refineries with dedicated hydrogen production plants and ammonia plants.

Figure 1. Distribution of main hydrogen production hubs in EU27 + UK. Green and blue dots represent chemical industries with hydrogen and ammonia production. Shaded polygons show EU coal regions in transition (CRiT). Background colors represent total demand in TWh per year, i.e., the sum of electricity consumption and the potential demand for electrolysis only in hydrogen-producing regions. Image Credit: Energy Conversion and Management 2021
Table 1 shows that the geo-located hydrogen production is 68% of the total estimated EU and UK annual production. At the NUTS2 level (EU27 + UK), the developed dataset has georeferenced information of industries with hydrogen or ammonia production in 109 regions (out of the total 272).
Table 1. EU27 + UK hydrogen production according to available data sources combined. Source: Energy Conversion and Management 2021
| Source |
Annual H2 production* |
| kt |
bn m3 |
| Hydrogen Roadmap Europe 2015 |
9 756 |
109.5 |
| Chemical industry database |
8 716 |
97.2 |
| of which pure H2 (not geo-located) |
2 090 |
23.5 |
| of which pure H2 (geo-located) |
2 886 |
32.1 |
| οf which H2 for NH3 production (geo-located) |
3 740 |
41.6 |
*-Standard Ambient Temperature and Pressure (SATP), Standard ambient temperature is 25 °C, Standard pressure is 1 bar.
The energy consumption for converting electricity to hydrogen varies between electrolyzer technologies and is subject to continuous improvement. This study adopted an electrolyzer efficiency value of 48 kWh/kg in lower heating values (LHV). Thus, the country with the highest need for electricity for electrolysis is Germany (102.8 TWh), followed by the Netherlands (74 TWh).
Net-zero carbon and climate mitigation strategies involve the deployment of RES at large scales to cover electricity demand. Efforts to produce green hydrogen using processes powered by renewable electricity should not affect the transition towards clean electricity generation systems.
Figure 1 shows the calculated electricity demand across all sectors per year (2019) at the regional level, covering the current consumption and demand of hydrogen by using water electrolysis.
Green Electricity Potential
The analysis presented here considered the technical potential for electricity generation from wind, solar photovoltaic, and hydropower resources. In the case of hydropower, the analysis assumed that capacities will not expand significantly from current levels.
Solar Photovoltaic Electricity Technical Potential
The technical potential generation of electricity from solar photovoltaic (PV) energy was estimated for each NUTS2 region for both ground-mounted and rooftop systems. For the ground-mounted systems, the analysis followed a previously reported approach.
Wind Energy Technical Potential
Wind energy potentials at national and regional levels are available as part of the JRC’s ENSPRESO open dataset. For onshore wind, values are provided for the case of high land-use restrictions and for that under which the allowed distances between buildings and wind turbines sites are smaller. This analysis opted for the high-constraints scenario, excluding onshore sites with less advantageous wind characteristics.
Deep water location depths that require floating systems were also excluded while focusing on offshore areas with a CF higher than 25%. The analysis used the Reference scenario and excluded all types of floating offshore wind. Potential offshore wind installations with an estimated capacity factor of 15%–20% were also omitted.
The analysis also considered the EMHIRES dataset that provides average productivity at national and regional scales for a 30-year period (1986–2015) with hourly time step and NUTS2 spatial resolution.
Hydropower
Existing hydropower generation available in Europe was estimated using two different open source databases: the JRC Hydro-power database and the JRC open power plants database. Hydro plants were geo-located and associated with the relevant NUTS 2 region; lastly, an aggregation at NUTS2 level was performed.
Results and Discussion
The study identified the availability of ample resources for hydrogen production from renewables. At the country level, Figure 2a shows the total electricity demand per country. Figure 2b shows the breakdown of technical potential for green electricity from wind, solar PV, and hydropower.
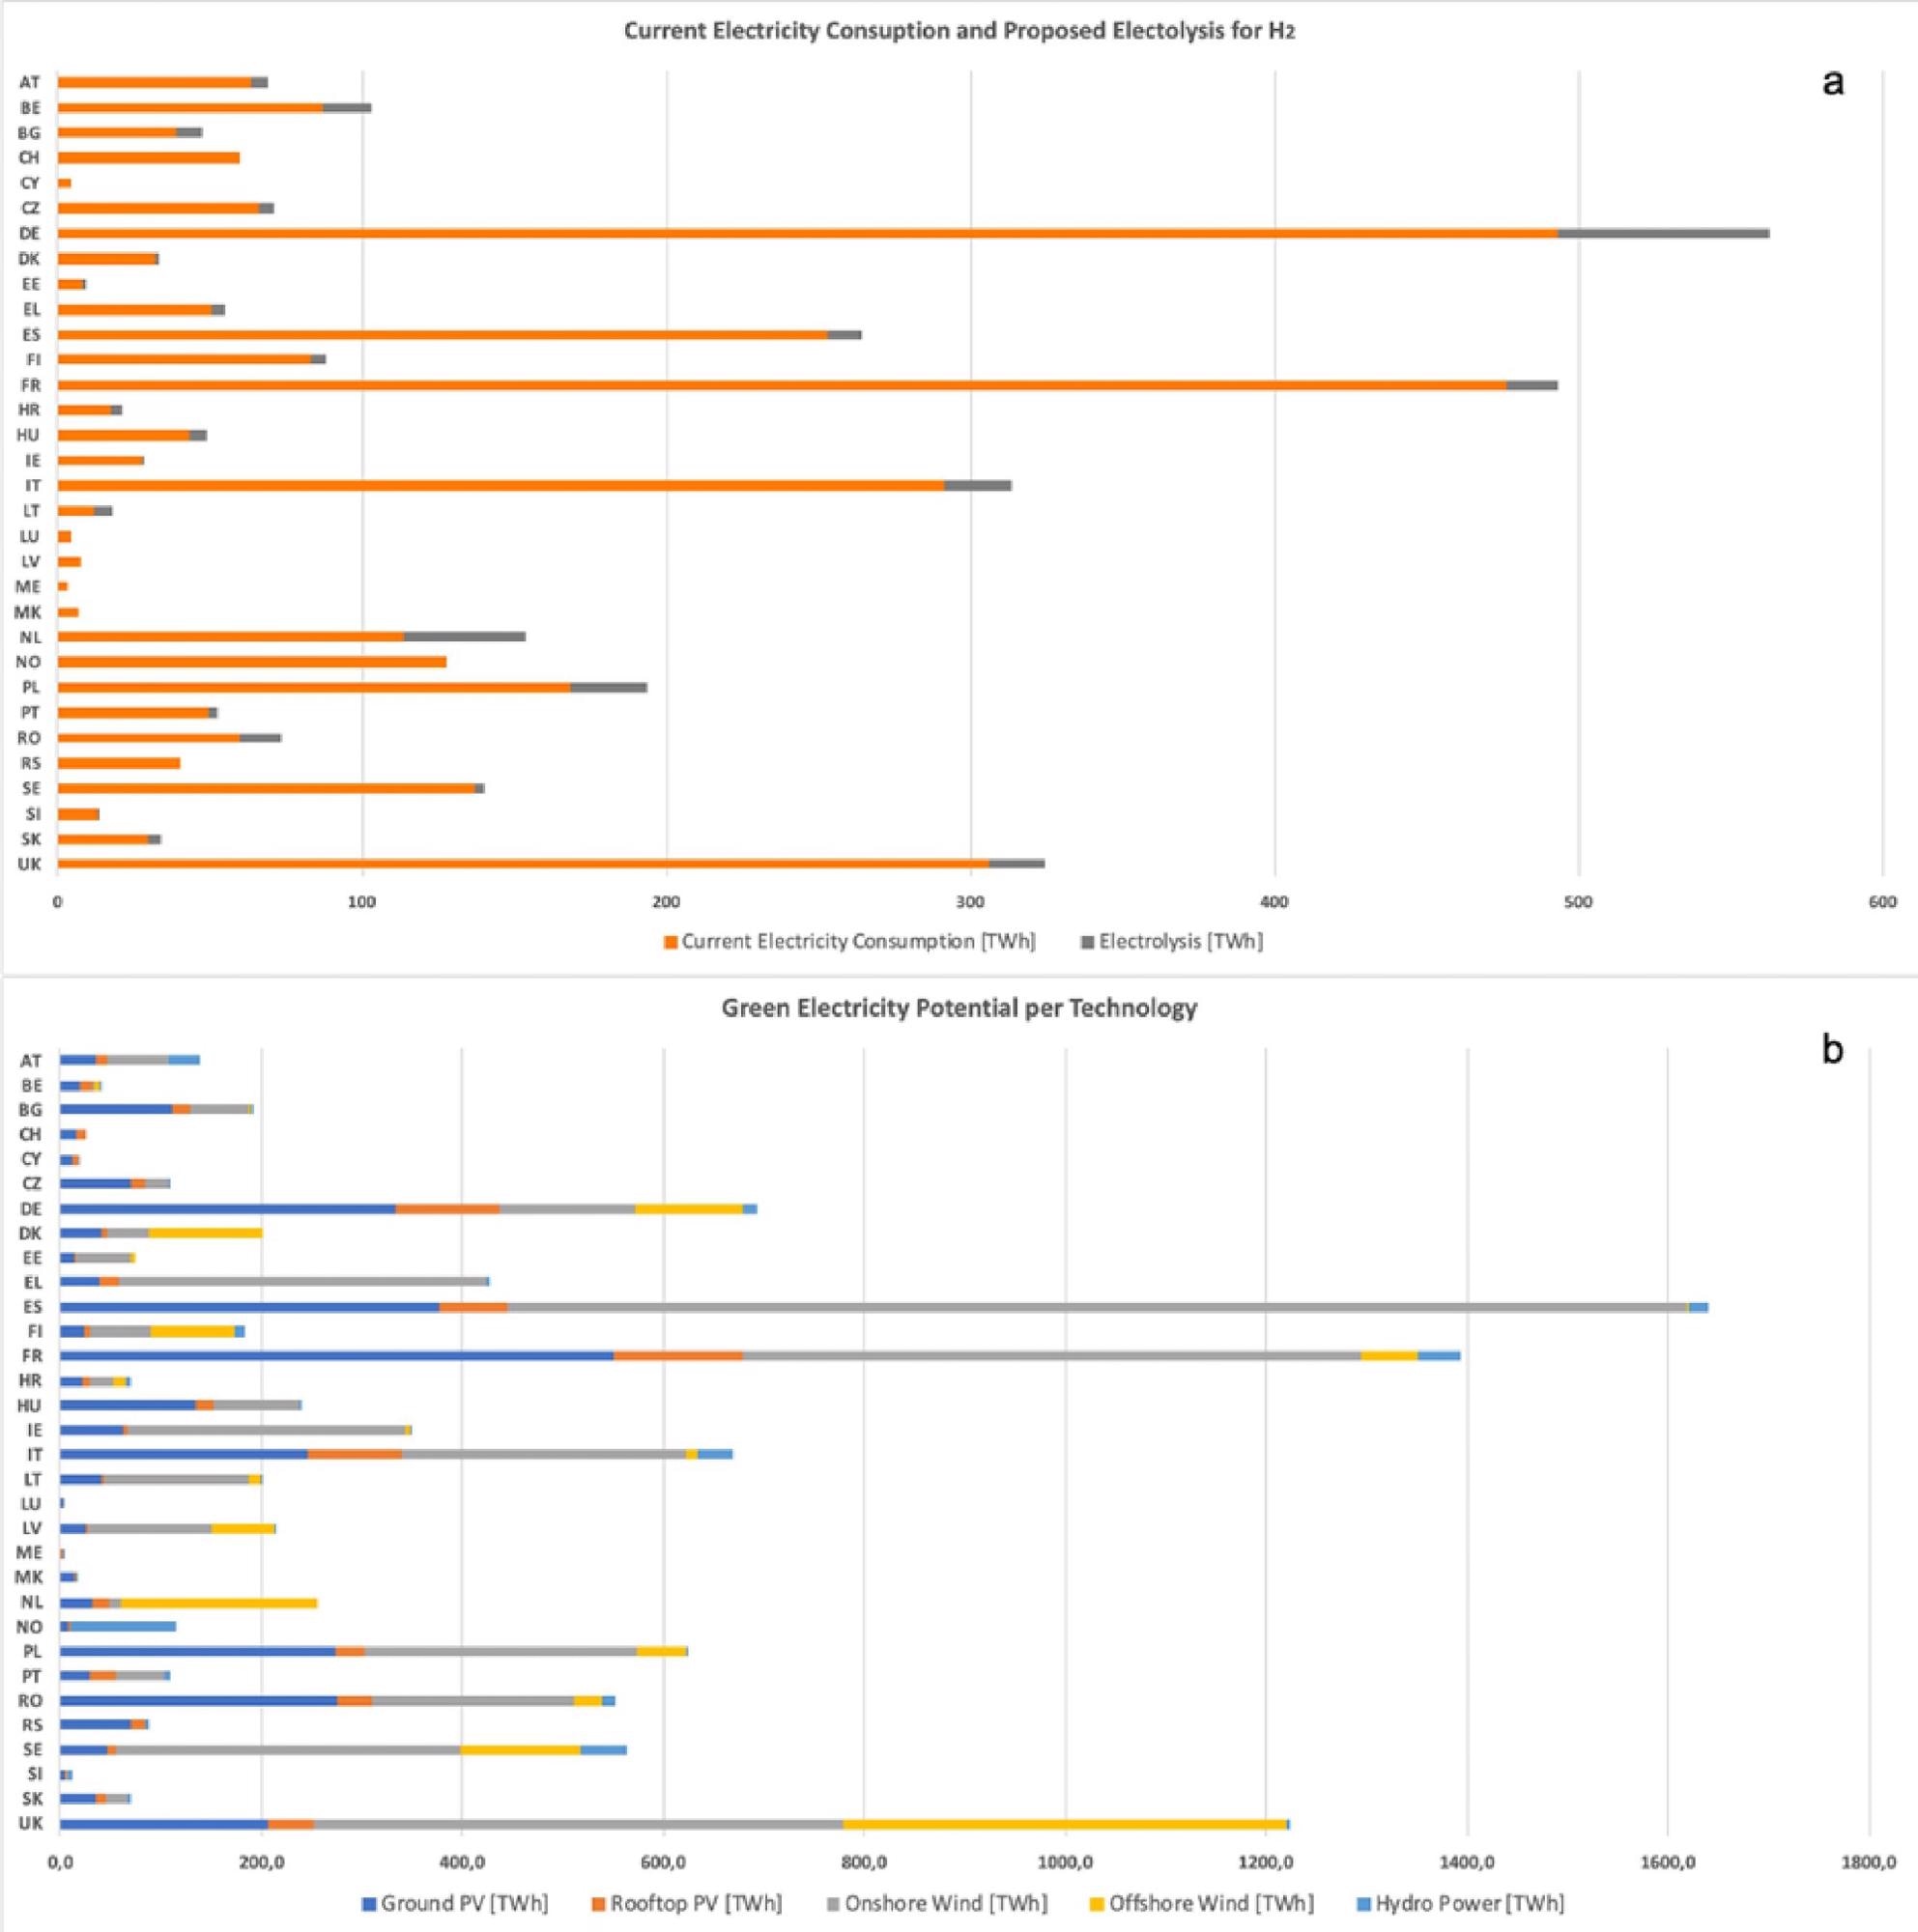
Figure 2. a: Country breakdown of current electricity consumption and postulated electricity demand for electrolysis; b: Total green energy potential per technology at national level in terawatt hours. Image Credit: Energy Conversion and Management 2021
Figure 3 compares the supply and demand values per country. Spain and France are the countries with the highest amount of surplus green energy potential followed by Romania and Poland. The United Kingdom has a large surplus renewable green electricity potential (+900 TWh), while Switzerland would have a net deficit of −34 TWh.
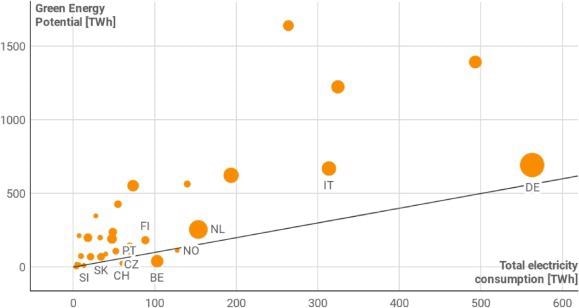
Figure 3. Total electricity demand (current consumption + proposed electricity for hydrogen electrolysis) in EU27 and UK compared to countries’ green electricity potential. The size of the markers represents the calculated electricity for hydrogen electrolysis per country. The solid black line is the 1:1 line. Image Credit: Energy Conversion and Management 2021
Regional Level
For the 109 NUTS2 (EU27 + UK) regions, as shown in Figure 4, the total technical potential for green electricity is 4334 TWh.
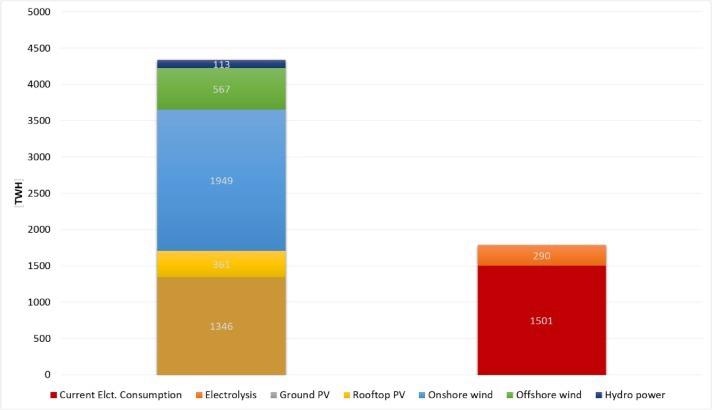
Figure 4. Comparison of the RES technical potential for all hydrogen-producing regions and electricity demand (current consumption + proposed electrolysis for hydrogen). Image Credit: Energy Conversion and Management 2021
At the individual regional level, Figure 5a presents the technical potential for green electricity and Figure 5b shows the renewable technology with the largest estimated technical potential in regions associated with hydrogen production.
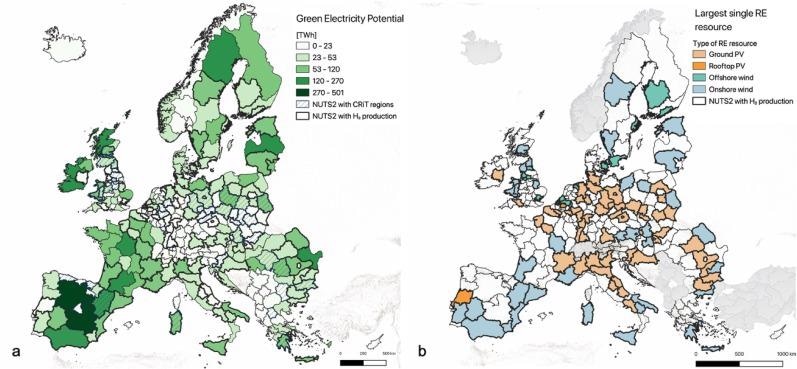
Figure 5. For the 109 NUTS2 regions with hydrogen production, panel a shows the total technical potential for green electricity per region, while panel b shows the largest single resource in that region from the categories considered in this study: ground solar PV, rooftop solar PV, onshore and offshore wind, and hydropower. Image Credit: Energy Conversion and Management 2021
Figure 5b also presents the largest single resource potential for each NUTS2 region associated. Ground-mounted PV and wind sources are dominant, with the former mainly for in-land regions and the latter for regions closer to the coast. Rooftop PV technology was of secondary importance in the latter.
Figure 6 highlights the regions with excess and deficit of RES electricity potential to cover the total demand.
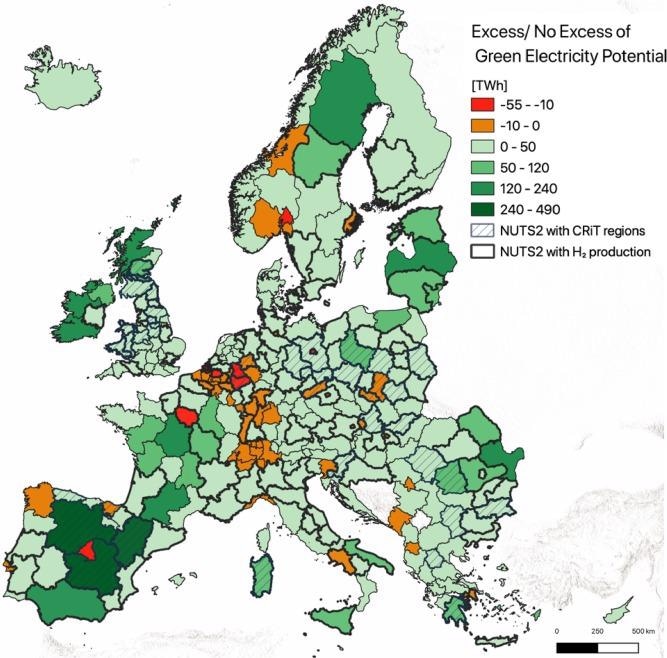
Figure 6. Regions with an excess or deficit of technical potential for green electricity after subtracting the current consumption for all sectors and that needed for moving from existing hydrogen production from grey to green. The shaded regions represent the CRiTs and the bold black outlined polygons the NUTS2 with current hydrogen production. Image Credit: Energy Conversion and Management 2021
A key finding of this study is that a majority of the examined European regions have sufficiently high technical potentials to be self-reliant using renewable energy. The impact on employment should be also considered when assessing the possible deployment of high shares of RES in industrial and energy sectors.
This research can be used as a basis for future complete techno-economic analysis involving many other factors. The analysis presented here shows that decarbonizing current hydrogen production is a no-regret option and could ensure that future hydrogen will be produced in a carbon-neutral way.
Conclusions
This study evaluated the replacement of grey hydrogen with green hydrogen production through electrolysis power by renewable energy resources for the EU27 and UK at the regional level (NUTS2).
The results of the study are relevant to the design of policies to implement the EU energy transition, specifically in relation to the role of green hydrogen and implications at the regional level for the deployment of renewable electricity generation capacity.
Further studies are needed to address factors such as detailed techno-economic analysis of regional energy systems with integrated green hydrogen production; possibilities for transmission and storage of green hydrogen across regions and the impact of the growth of hydrogen demand for new applications in industry, transport, and for heat.
Journal Reference
G.Kakoulaki et al. (2020) Green hydrogen in Europe – A regional assessment: Substituting existing production with electrolysis powered by renewables. Energy Conversion and Management, Volume 228, 113649, ISSN 0196-8904. https://doi.org/10.1016/j.enconman.2020.113649
References and Further Reading
- European Commission (2019) The European Green Deal. vol. Brussels, Belgium: Communicat. https://eur-lex.europa.eu/legal-content/EN/TXT/?qid=1588580774040&uri=CELEX
- Fuel Cells and Hydrogen Joint Undertaking (FCH) (2019). Hydrogen Roadmap Europe - a Sustainable Pathway for the European Energy Transition. Brussels, Belgium. doi.org/10.2843/249013.
- European Commission (2020) A hydrogen strategy for a climate-neutral Europe, vol. 53. Brussels, Belgium. https://energy.ec.europa.eu/index_en.
- thyssenkrupp (2019) Hydrogen from large-scale electrolysis. Dortmund, Germany. https://ucpcdn.thyssenkrupp.com/_legacy/
- Hydrogen Europe (2020) Green Hydrogen Investment and Support Report. -https://profadvanwijk.com/
- Fraile, D., et al. (2015) Overview of the market segmentation for hydrogen across potential customers groups, based on key application areas.
- IEA International Energy Agency (2019) World Energy Outlook 2019. Paris: OECD/IEA. https://www.iea.org/reports/world-energy-outlook-2019
- IRENA (2020) Hydrogen: A renewable energy perspective. Abu Dhabi, UAE. https://www.irena.org/publications/2019/Sep/Hydrogen-A-renewable-energy-perspective
- European Commission (2020) Questions and answers: A Hydrogen Strategy for a climate neutral Europe. Press Corner. Available at: https://ec.europa.eu/commission/presscorner/detail/en/QANDA_20_1257.
- Hydrogen Council (2020) Path to hydrogen competitiveness. A cost perspective. Oslo, Norway. https://hydrogencouncil.com/wp-content/uploads/2020/01/Path-to-Hydrogen-Competitiveness_Full-Study-1.pdf
- Jäger-Waldau, I., et al. (2020) How photovoltaics can contribute to GHG emission reductions of 55% in the EU by 2030. Renew Sustain Energy Rev, 126, Article 109836. doi.org/10.1016/j.rser.2020.109836.
- Fuel Cells and Hydrogen Joint Undertaking (2020) FCH JU funds pioneering green hydrogen project. Media Release. Available at: https://european-union.europa.eu/index_en.
- Glenk, G & Reichelstein, S (2019) Economics of converting renewable power to hydrogen. Nature Energy, 4, pp. 216–222. doi.org/10.1038/s41560-019-0326-1.
- International Energy Agency (IEA) (2019) The Future of Hydrogen for G20. Paris, France. https://www.iea.org/reports/the-future-of-hydrogen
- Boulamanti A, & Moya J (2017) Energy efficiency and GHG emissions: Prospective scenarios for the Chemical and Petrochemical Industry. Luxembourg. doi.org/10.2760/20486.
- Fasihi, M & Breyer, C (2020) Baseload electricity and hydrogen supply based on hybrid PV-wind power plants. Journal of Cleaner Production, 243, doi.org/10.1016/j.jclepro.2019.118466.
- Child, M., et al. (2019) Flexible electricity generation, grid exchange and storage for the transition to a 100% renewable energy system in Europe. Renewable Energy, 139, pp. 80–101. doi.org/10.1016/j.renene.2019.02.077.
- Sherwood, J (2020) The significance of biomass in a circular economy. Bioresource Technology, 300, doi.org/10.1016/j.biortech.2020.122755.
- Ruiz, P., et al. (2019) ENSPRESO - an open, EU-28 wide, transparent and coherent database of wind, solar and biomass energy potentials. Energy Strategy Reviews, 26, doi.org/10.1016/j.esr.2019.100379.
- Strachan, N., et al. (2009) Soft-linking energy systems and GIS models to investigate spatial hydrogen infrastructure development in a low-carbon UK energy system. International Journal of Hydrogen Energy, 34, pp. 642–657, doi.org/10.1016/j.ijhydene.2008.10.083.
- Capros, P., et al. (2019) Energy-system modelling of the EU strategy towards climate-neutrality. Energy Policy, 134, doi.org/10.1016/j.enpol.2019.110960.
- Perrin, J., et al. (2007) European hydrogen infrastructure atlas and industrial excess hydrogen analysis. PART III: Industrial distribution infrastructure. Roads2HyCom, pp. 1–38
- Lan, R., et al. (2012) Ammonia and related chemicals as potential indirect hydrogen storage materials. International Journal of Hydrogen Energy, 37, pp. 1482-1494, doi.org/10.1016/j.ijhydene.2011.10.004.
- Dolci F (2018). Green Hydrogen Opportunities in Selected Industrial Processes. Luxembourg: Publications Office of the European Union. doi.org/10.2760/634063.
- Fuel Cells and Hydrogen 2 Joint Undertaking (FCH JU) (2018) Multi-Annual Work Plan 2014-2020. https://european-union.europa.eu/index_en
- FLEXCHX project (2018) Flexible combined production of power, heat and transport fuels from renewable energy sources.
- Eurostat (2020) Supply of electricity - monthly data.
- ENTSO-E Transparency Platform (2020) Actual Generation per Production Type.
- Tröndle, T., et al. (2019) Home-made or imported: On the possibility for renewable electricity autarky on all scales in Europe. Energy Strategy Reviews, 26, doi.org/10.1016/j.esr.2019.100388.
- Platform on Coal and Carbon-Intensive Regions (2019). Terms of Reference. Brussels, Belgium.
- Elbersen, B., et al. (2012) Atlas of EU biomass potentials. Intell Energy Eur, p. 139.
- Kumar A., et al. (2011) Renewable Energy Sources and Climate Change Mitigation Special Report. IPCC, Cambridge, UK: Cambridge University Press, pp. 437–96. doi.org/10.1017/CBO9781139151153.009.
- European Commission - Joint Research Centre (2020) Photovoltaic Geographical Information System (PVGIS). Available at: https://ec.europa.eu/jrc/en/pvgis.
- Bódis, K., et al. (2019) Solar photovoltaic electricity generation: A lifeline for the European coal regions in transition. Sustainability, 11. doi.org/10.3390/su11133703.
- European Environment Agency. Copernicus Land Monitoring Service - Corine Land Cover. EEA 2019:1.
- Bódis, K., et al. (2019) A high-resolution geospatial assessment of the rooftop solar photovoltaic potential in the European Union. Renewable and Sustainable Energy Reviews, 114. Available at: https://doi.org/10.1016/j.rser.2019.109309.
- Gonzalez Aparicio I., et al. (2016) EMHIRES dataset Part I: Wind power generation European Meteorological derived High resolution RES generation time series for present and future scenarios. Brussels, Belgium. doi.org/10.2790/831549.
- European Commission - Joint Research Centre (2019) JRC Hydro-power database.
- European Commission - Joint Research Centre (2020) JRC Open Power Plants Database (JRC-PPDB-OPEN).
- Eurostat (2019) Energy statistics - Supply, transformation and consumption of electricity - annual data.
- Kougias I (2019) Hydropower Technology Market Report 2018. Luxembourg: Publications Office of the European Union. doi.org/10.2760/063989.
- European Commission (2020) Regulation establishing the Just Transition Fund. vol. COM (2020). European Parliament and the Council.
- Breyer, C., et al. (2018) Solar photovoltaics demand for the global energy transition in the power sector. Progress in Photovoltaics: Research and Applications, 26, pp. 505–523, doi.org/10.1002/pip.2950.