The polar region cloud system, one of the key components governing climate change, is extremely sensitive to sea ice distribution, lower-tropospheric stability, and atmospheric circulation. There have been numerous studies on clouds over Antarctica, the Southern Ocean (SO), and the complete high-latitude region of the Southern Hemisphere. This article looks at Sato, K. and Inoue, J.'s research paper published in Geophysical Research Letters.

Image Credit: papa studio/Shutterstock.com
The total cloud cover over the SO tends to be greater than that over Antarctica, even poleward of 60 °S, and the most frequent type is low-level cloud (base height of <2.0 km). In autumn-winter, the formation of low-level supercooled liquid water clouds declines with an increase in sea ice concentration (SIC). By contrast, in summer, there is no difference in low-level cloud extent between open water and sea ice areas.
This phenomenon indicates that sea ice variability does not affect cloud properties. Moreover, the frequency of occurrence of low-level clouds below 2 km over the SO is underestimated by general circulation modeling and reanalysis data.
Hence, this study investigated the fraction of ice cloud and temperature in the troposphere over the SO and Antarctica using the Cloud-Aerosol Lidar and Infrared Pathfinder Satellite Observation, or CALIPSO, data. The study also offers insights into the link between lower-tropospheric ice-cloud fraction over the SO and phytoplankton numbers.
Methodology
The CALIPSO satellite equipped with a Cloud-Aerosol Lidar with Orthogonal Polarization (CALIOP) instrument measured backscatter profiles with high vertical resolution. The measurement details can be used to predict cloud properties. The data from this satellite was used by the JAXA EarthCARE program to develop a cloud data set with a horizontal resolution of 240 m.
There are seven types of cloud particles—supercooled water, warm water, randomly oriented ice crystals (3D ice), horizontally oriented plates (2D plate), the blend of 3D ice and 2D plate, unknown1 (possibly ice crystals with horizontally oriented plates that have weak specular reflection), and unknown2 (randomly oriented ice crystals or liquid droplets).
The Clouds and the Earth’s Radiant Energy System-Energy Balanced and Filled data was used to evaluate downward shortwave and longwave radiation. The presence of phytoplanktons over the SO has been analyzed using MODIS-Aqua satellite monthly mean chlorophyll-α concentration data.
When the chlorophyll-α concentration is relatively low (high) over sea ice areas, errors in the water-leaving radiance can lead to overestimation (underestimation) of daily chlorophyll-α concentration for some pixels. This problem was solved by averaging monthly data.
Data obtained from the Hadley Centre Sea Ice and Sea Surface Temperature (HadISST) datasets were used to distinguish open water and sea ice areas. SST over sea ice areas was calculated using SST–SIC statistical relationships.
Monthly mean ERA5 data from the European Centre for Medium-Range Weather Forecasts were used for atmospheric parameters (10 m wind speed, 2 m air temperature, and sensible heat flux). The 10-ensemble mean data was used to reduce parameter uncertainty in the ERA5 data.
Results
Figures 1a–1d illustrate the seasonal distribution of the fraction of ice cloud (Fice) below 8 km over Antarctica and the SO. From Figure 1d, it is clear that Fice is highest in winter over Antarctica and the SO, while the magnitude and distribution of Fice in spring and autumn are similar (see Figures 1a and 1c). As shown in Figure 1b, in summer, Fice is smaller than in winter due to warmer temperatures.
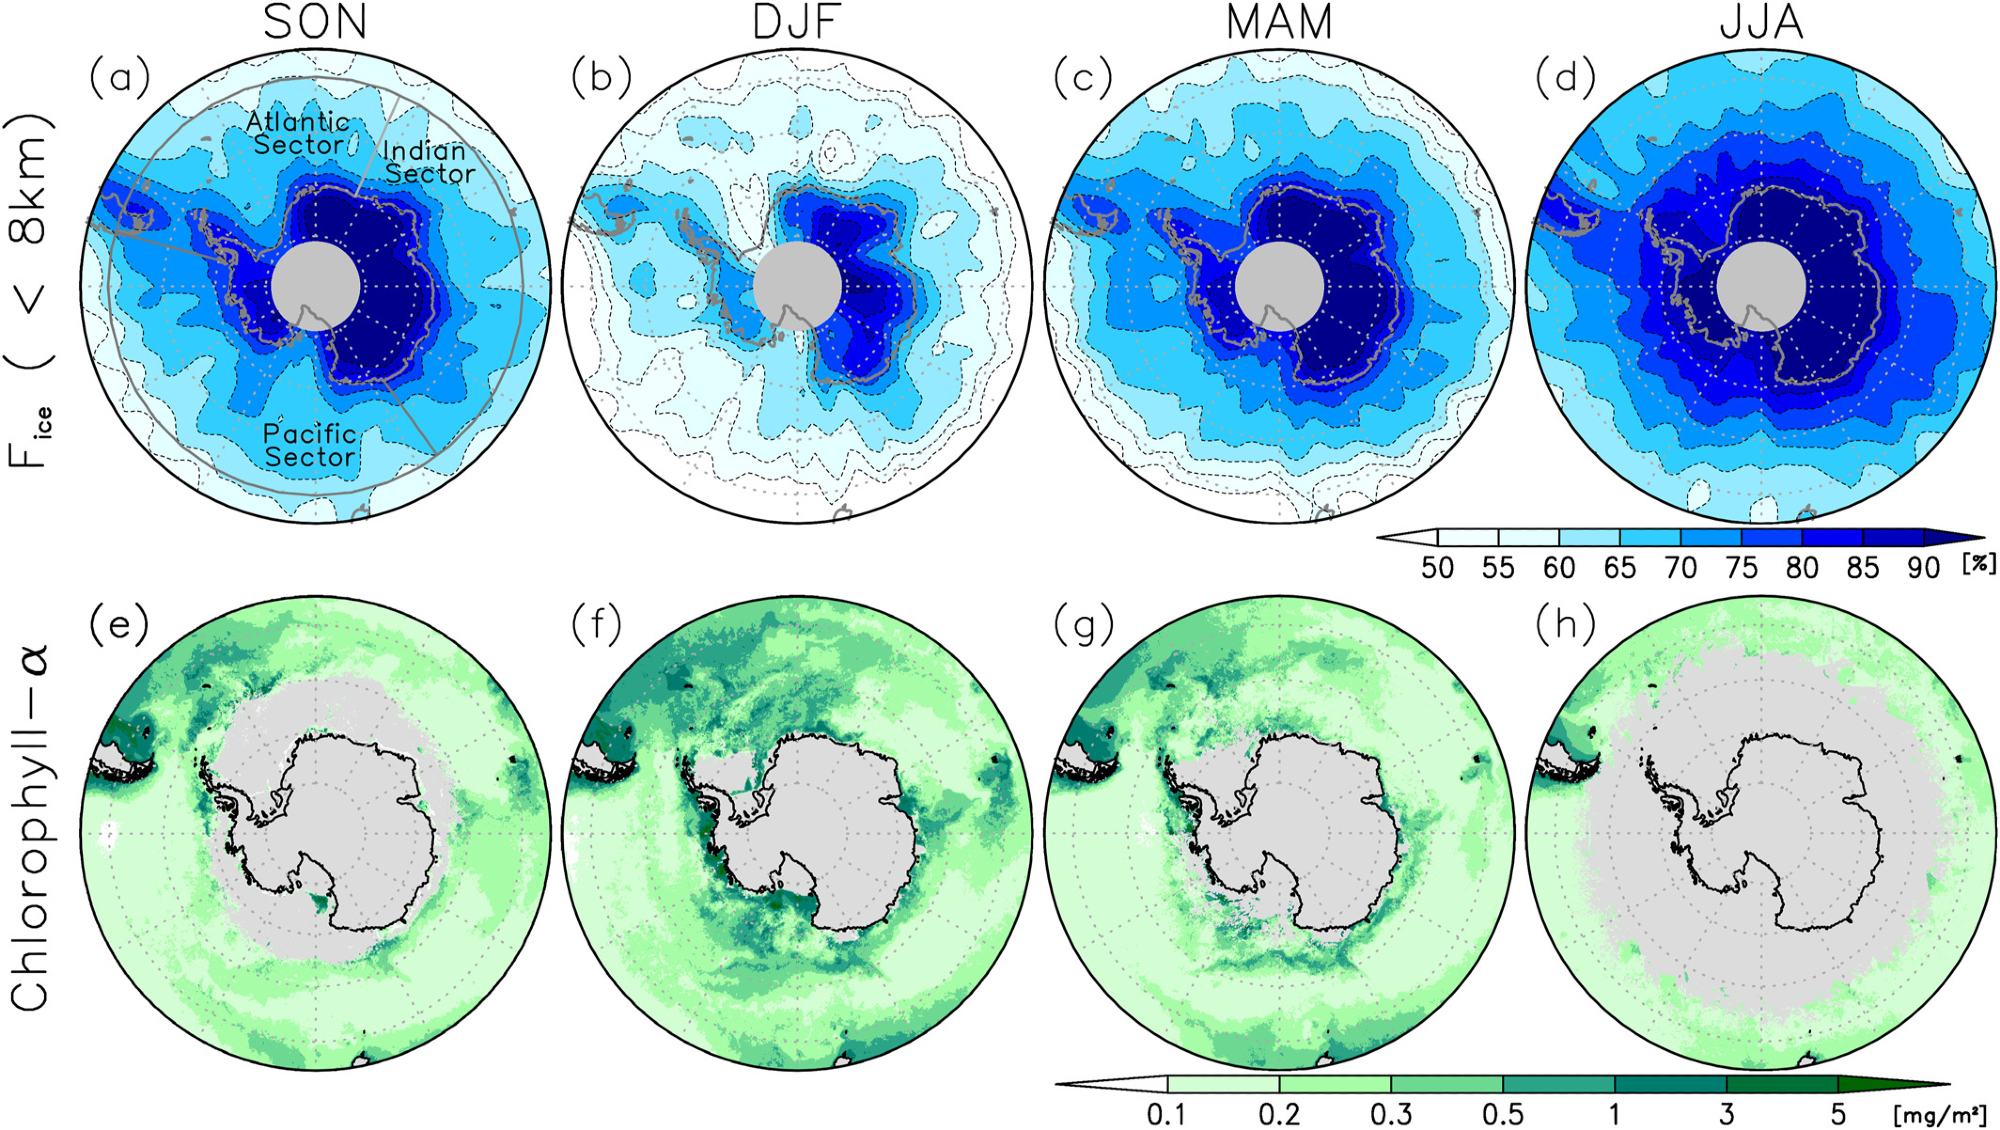
Figure 1. Fraction of ice cloud relative to total cloud fraction (Fice: %) in 2006–2015: (a) Spring (SON), (b) Summer (DJF), (c) Autumn (MAM), and (d) Winter (JJA). Seasonal ranges in (e–h) are the same as in (a–d) but depict chlorophyll data (mg/m2). Image Credit: Sato & Inoue, 2021
Figures 2a and 2d show that high-level Fice does not change seasonally over the SO and Antarctica as all liquid cloud droplets tend to freeze under extremely cold conditions in the upper troposphere. By contrast, clear seasonal change in Fice can be seen in low- and mid-level layers (see Figures 2b and 2c). Figures 2e and 2f illustrate that in winter, cold conditions cause the highest Fice over the SO and Antarctica at these levels.
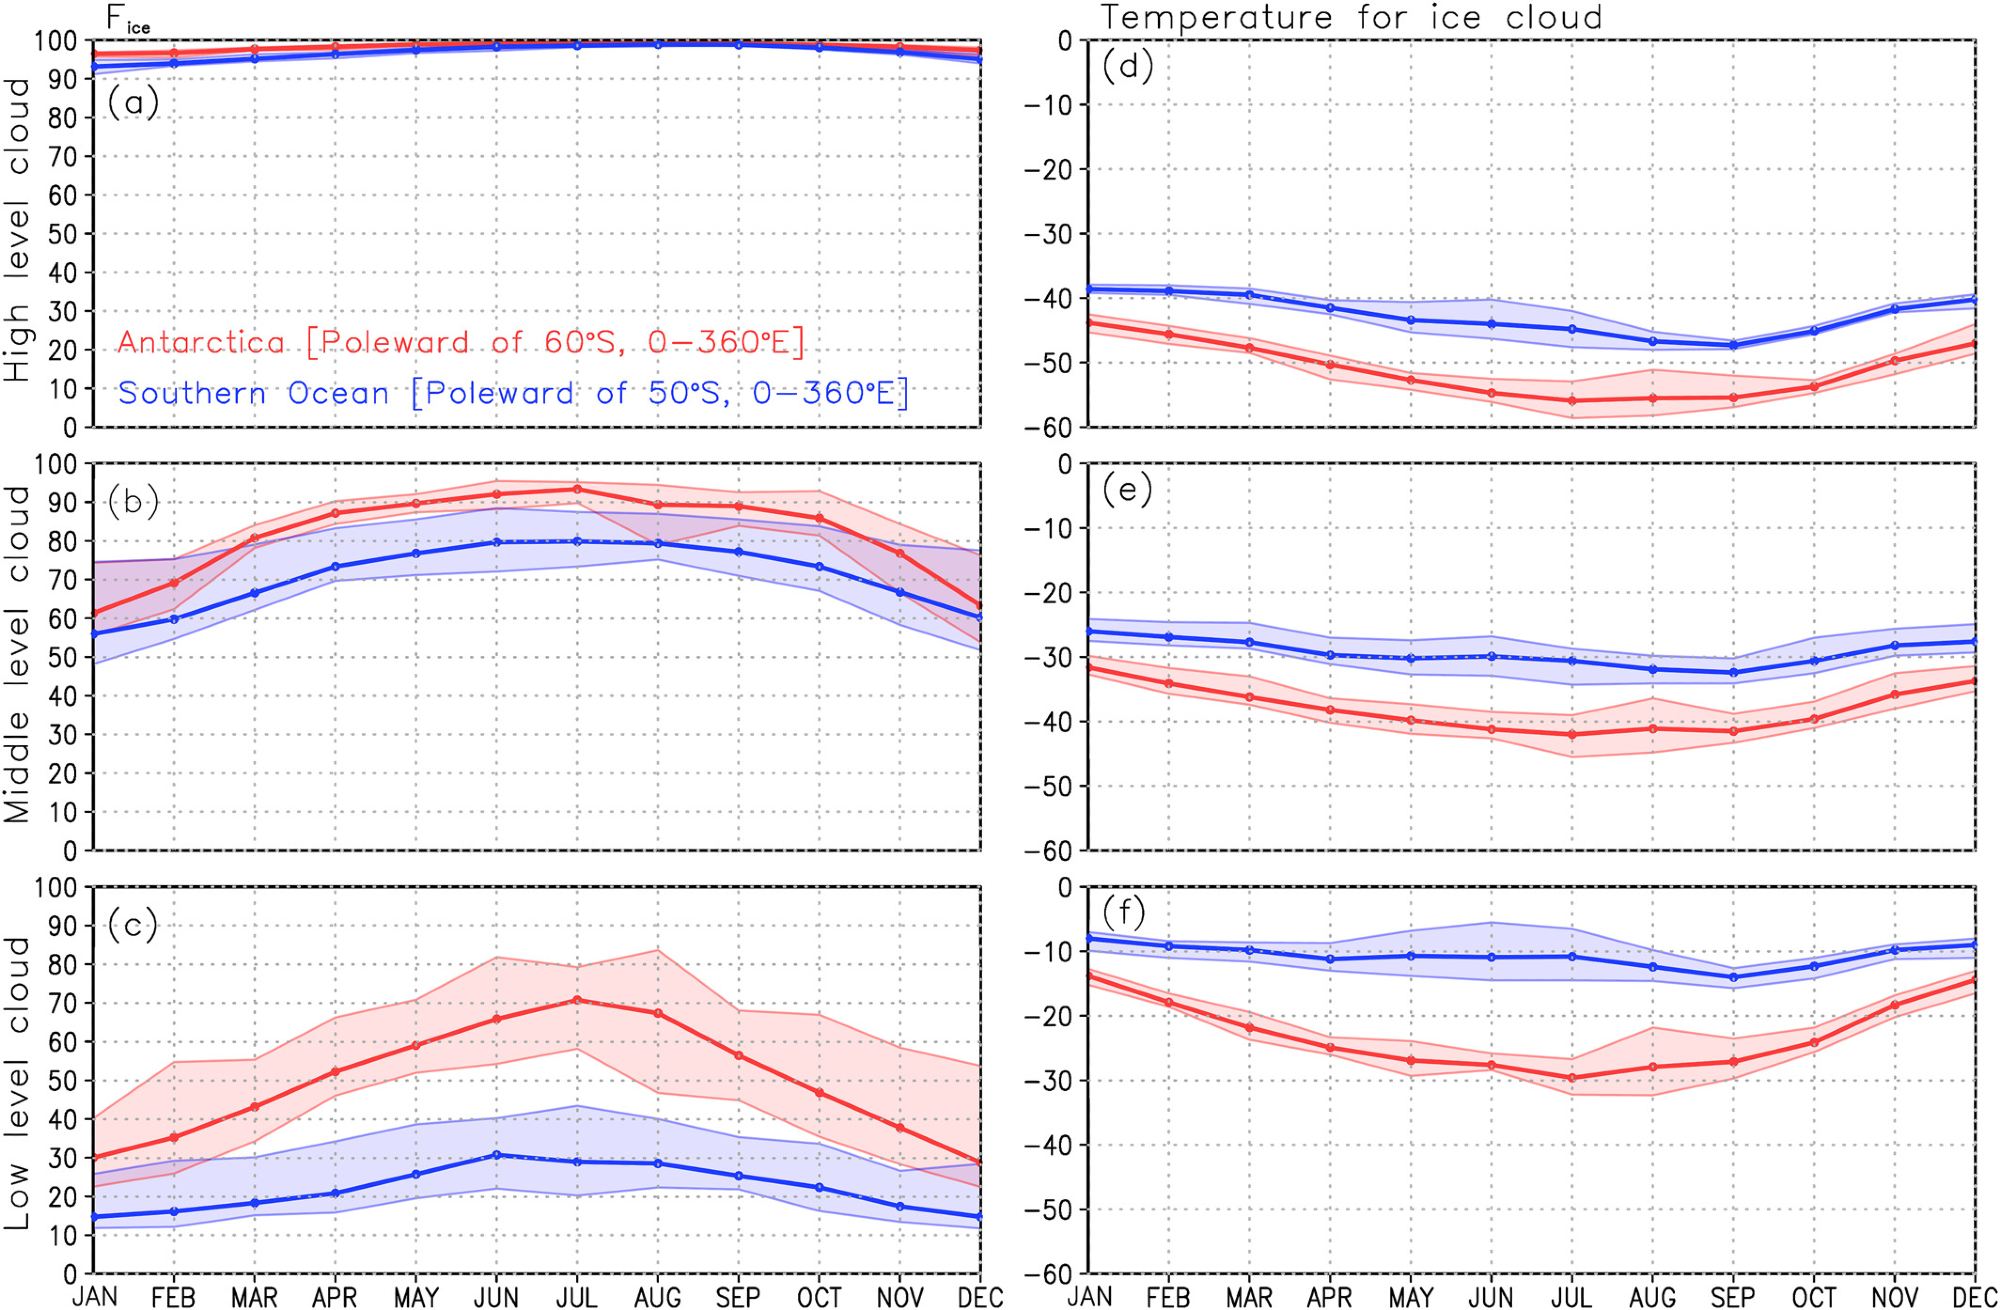
Figure 2. Monthly average fraction of ice cloud relative to total cloud (Fice: %) over Antarctica (red: poleward of 60°S) and the Southern Ocean (blue: poleward of 50°S) averaged over 0°–360°E: (a) High-level (>6 km), (b) Mid-level (2–6 km), (c) Low-level (<2 km) in 2006–2015. Shading indicates amplitude between monthly minimum and maximum encountered during 2006–2015. (d–f) same as (a–c) but for temperature (°C) when ice cloud was present. ). Image Credit: Sato & Inoue, 2021
As shown in Figure 3, the SO was divided into three regions (Atlantic, Indian, and Pacific sectors; see also Figure 1a) to investigate the zonally averaged, low-level-cloud Fice over Antarctica and the SO (poleward of 50°S) at various temperatures and intervals of 2.5 °C as a function of latitude during summer and winter.
In winter, the highest Fice is exhibited by the low-level cloud over all regions at extremely cold temperatures (see Figures 3a–3c). On the contrary, in summer, ice cloud over all regions forms at temperatures greater than −35 °C (see Figures 3d–3f).
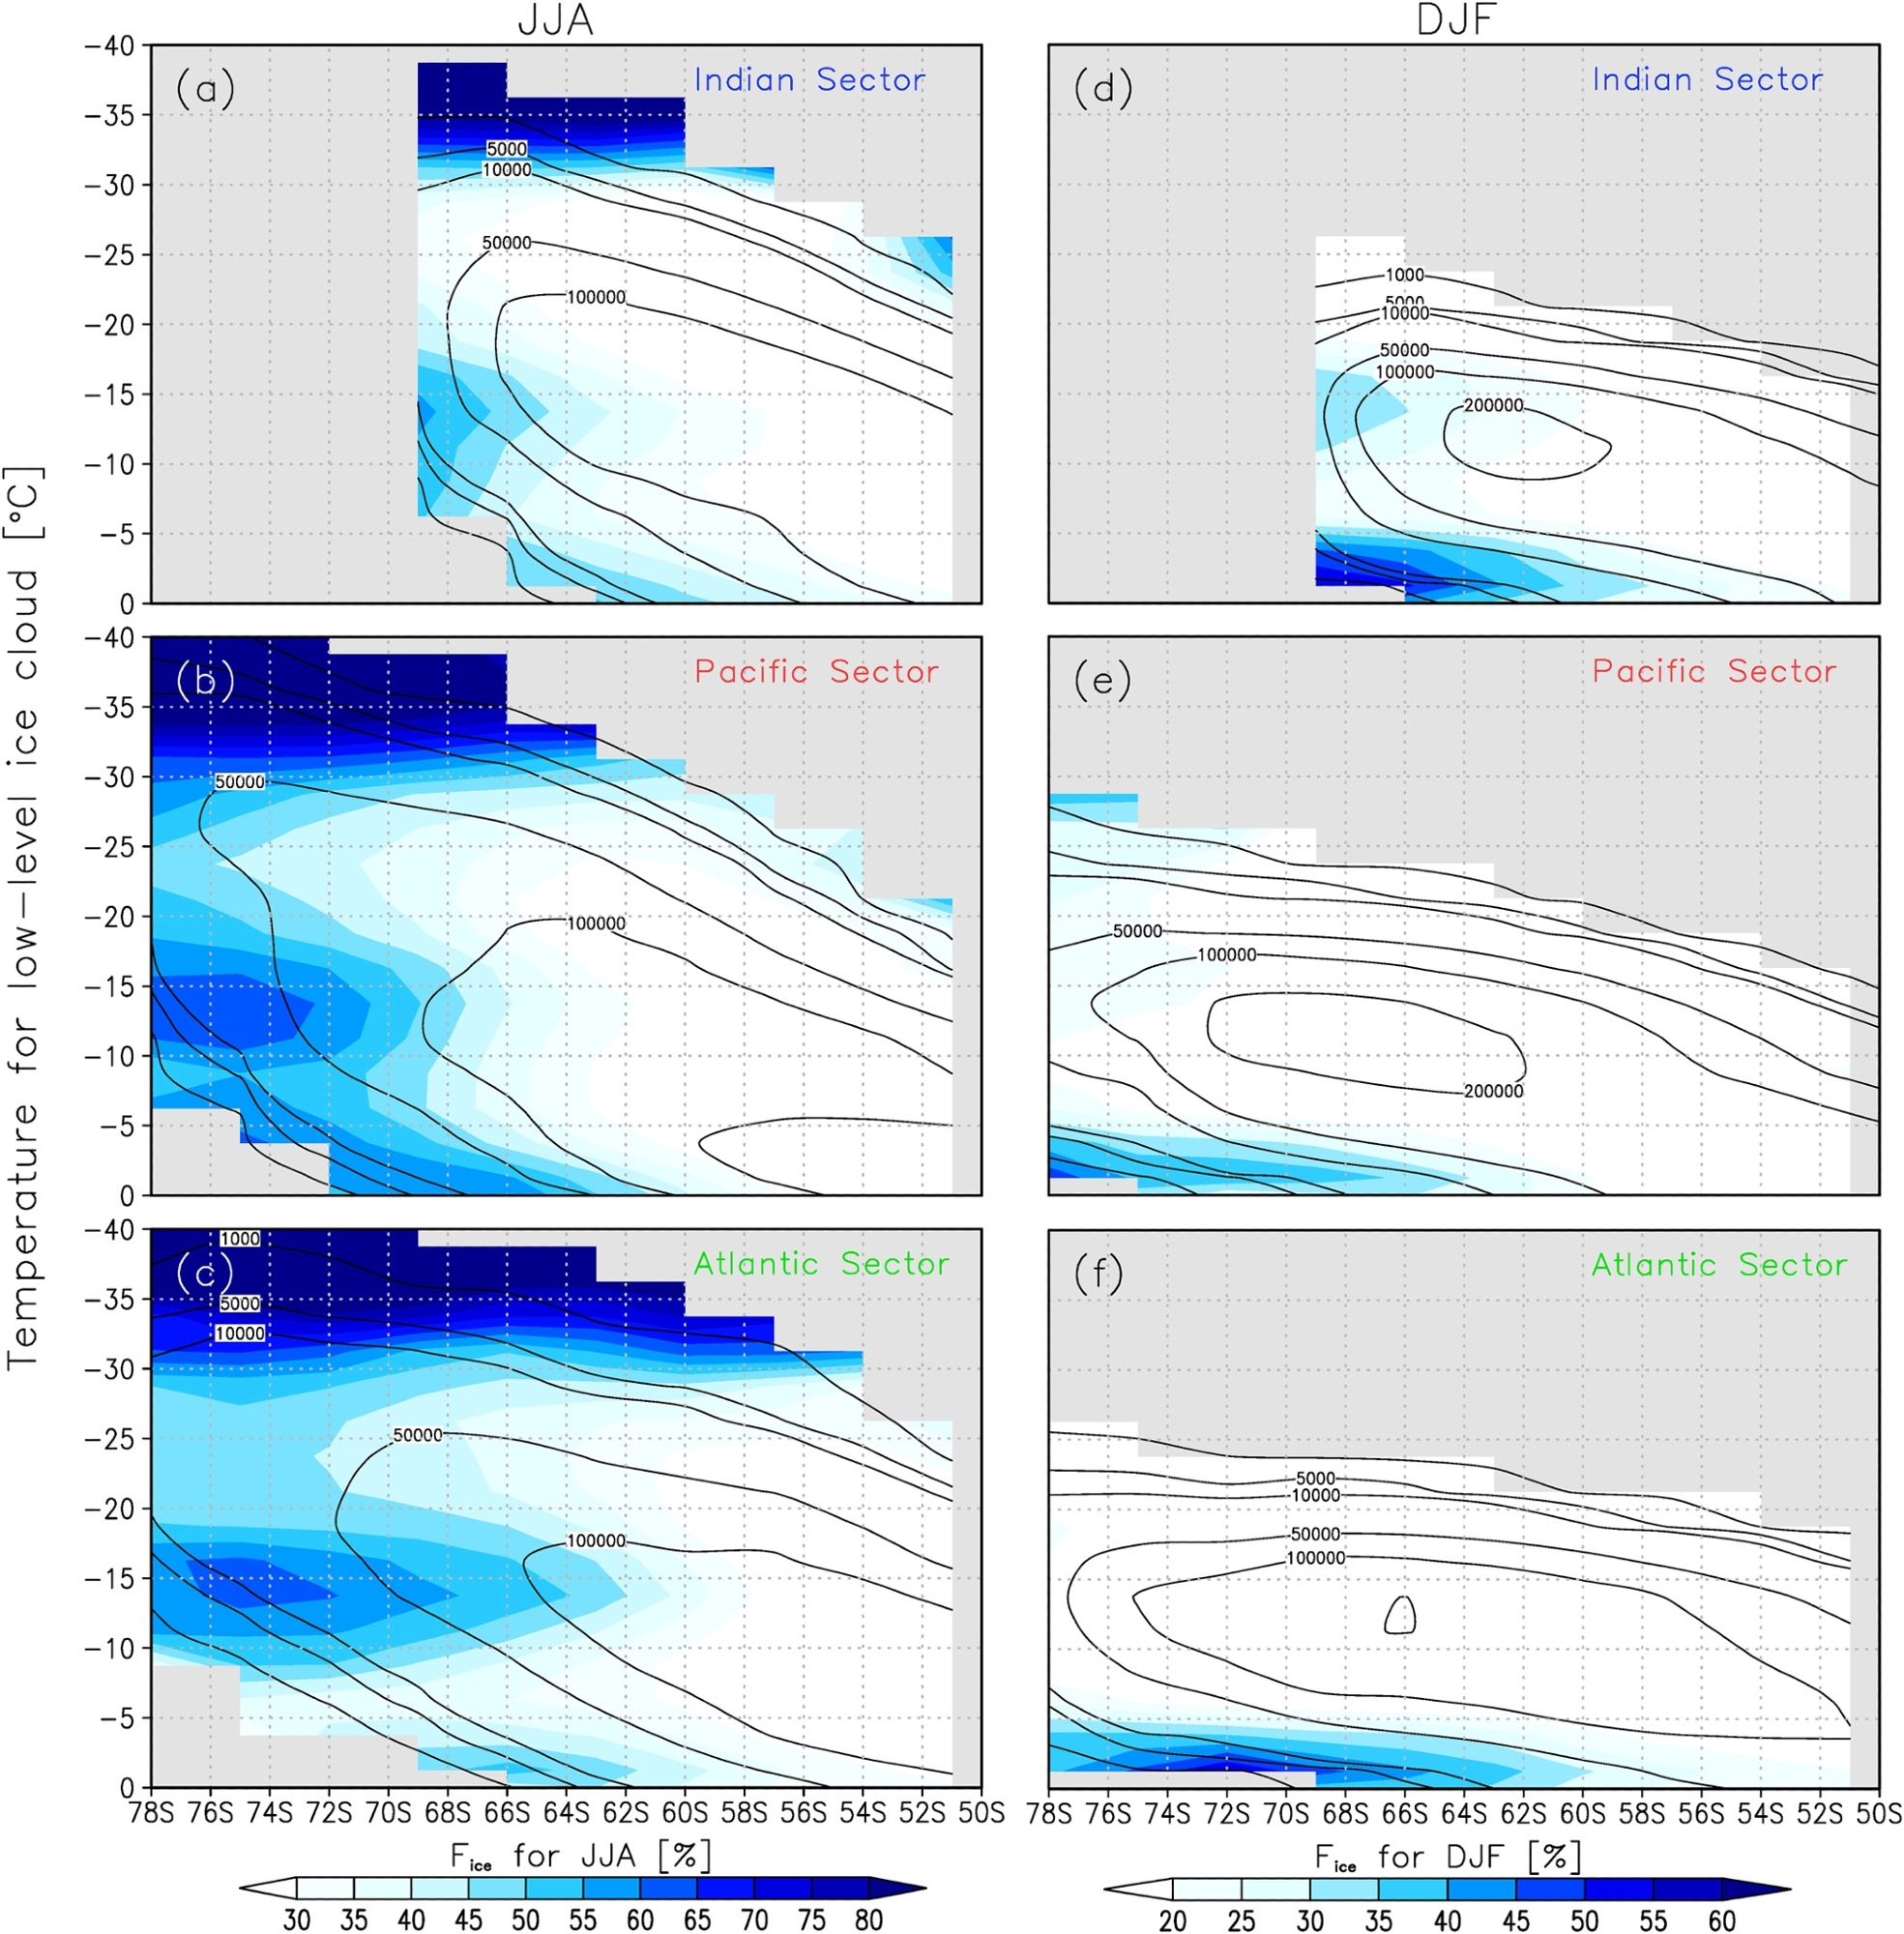
Figure 3. Dependence on latitude and cloud temperature of averaged low-level ice-cloud fraction relative to total cloud (Fice: %): (a) Indian, (b) Pacific, and (c) Atlantic sectors of the Southern Ocean in austral winter 2006–2015. Contours (1,000, 5,000, 10,000, 50,000, 100,000, and 200,000) show numbers of Nice and Nwater. (d–f) Same as (a–c) but during austral summer. ). Image Credit: Sato & Inoue, 2021
As shown in Figures 4f–4h, in summer at higher temperatures (−7.5 °C to 0 °C), low-level cloud over near-coastal Antarctic regions of all SO sectors exhibits a higher Fice than that over the ocean. Furthermore, the concentration of chlorophyll-α in high-latitude areas with sea ice is higher than in open water (see Figure 4i).
The high AOD close to coastal Antarctic regions under low ASE index conditions over the Atlantic and Pacific sectors indicates the transportation of aerosols from lower latitudes. Hence, marine bioaerosols released from high-latitude oceans likely add to the higher low-level cloud Fice at higher temperatures over coastal Antarctic regions (see Figures 4g and 4h).
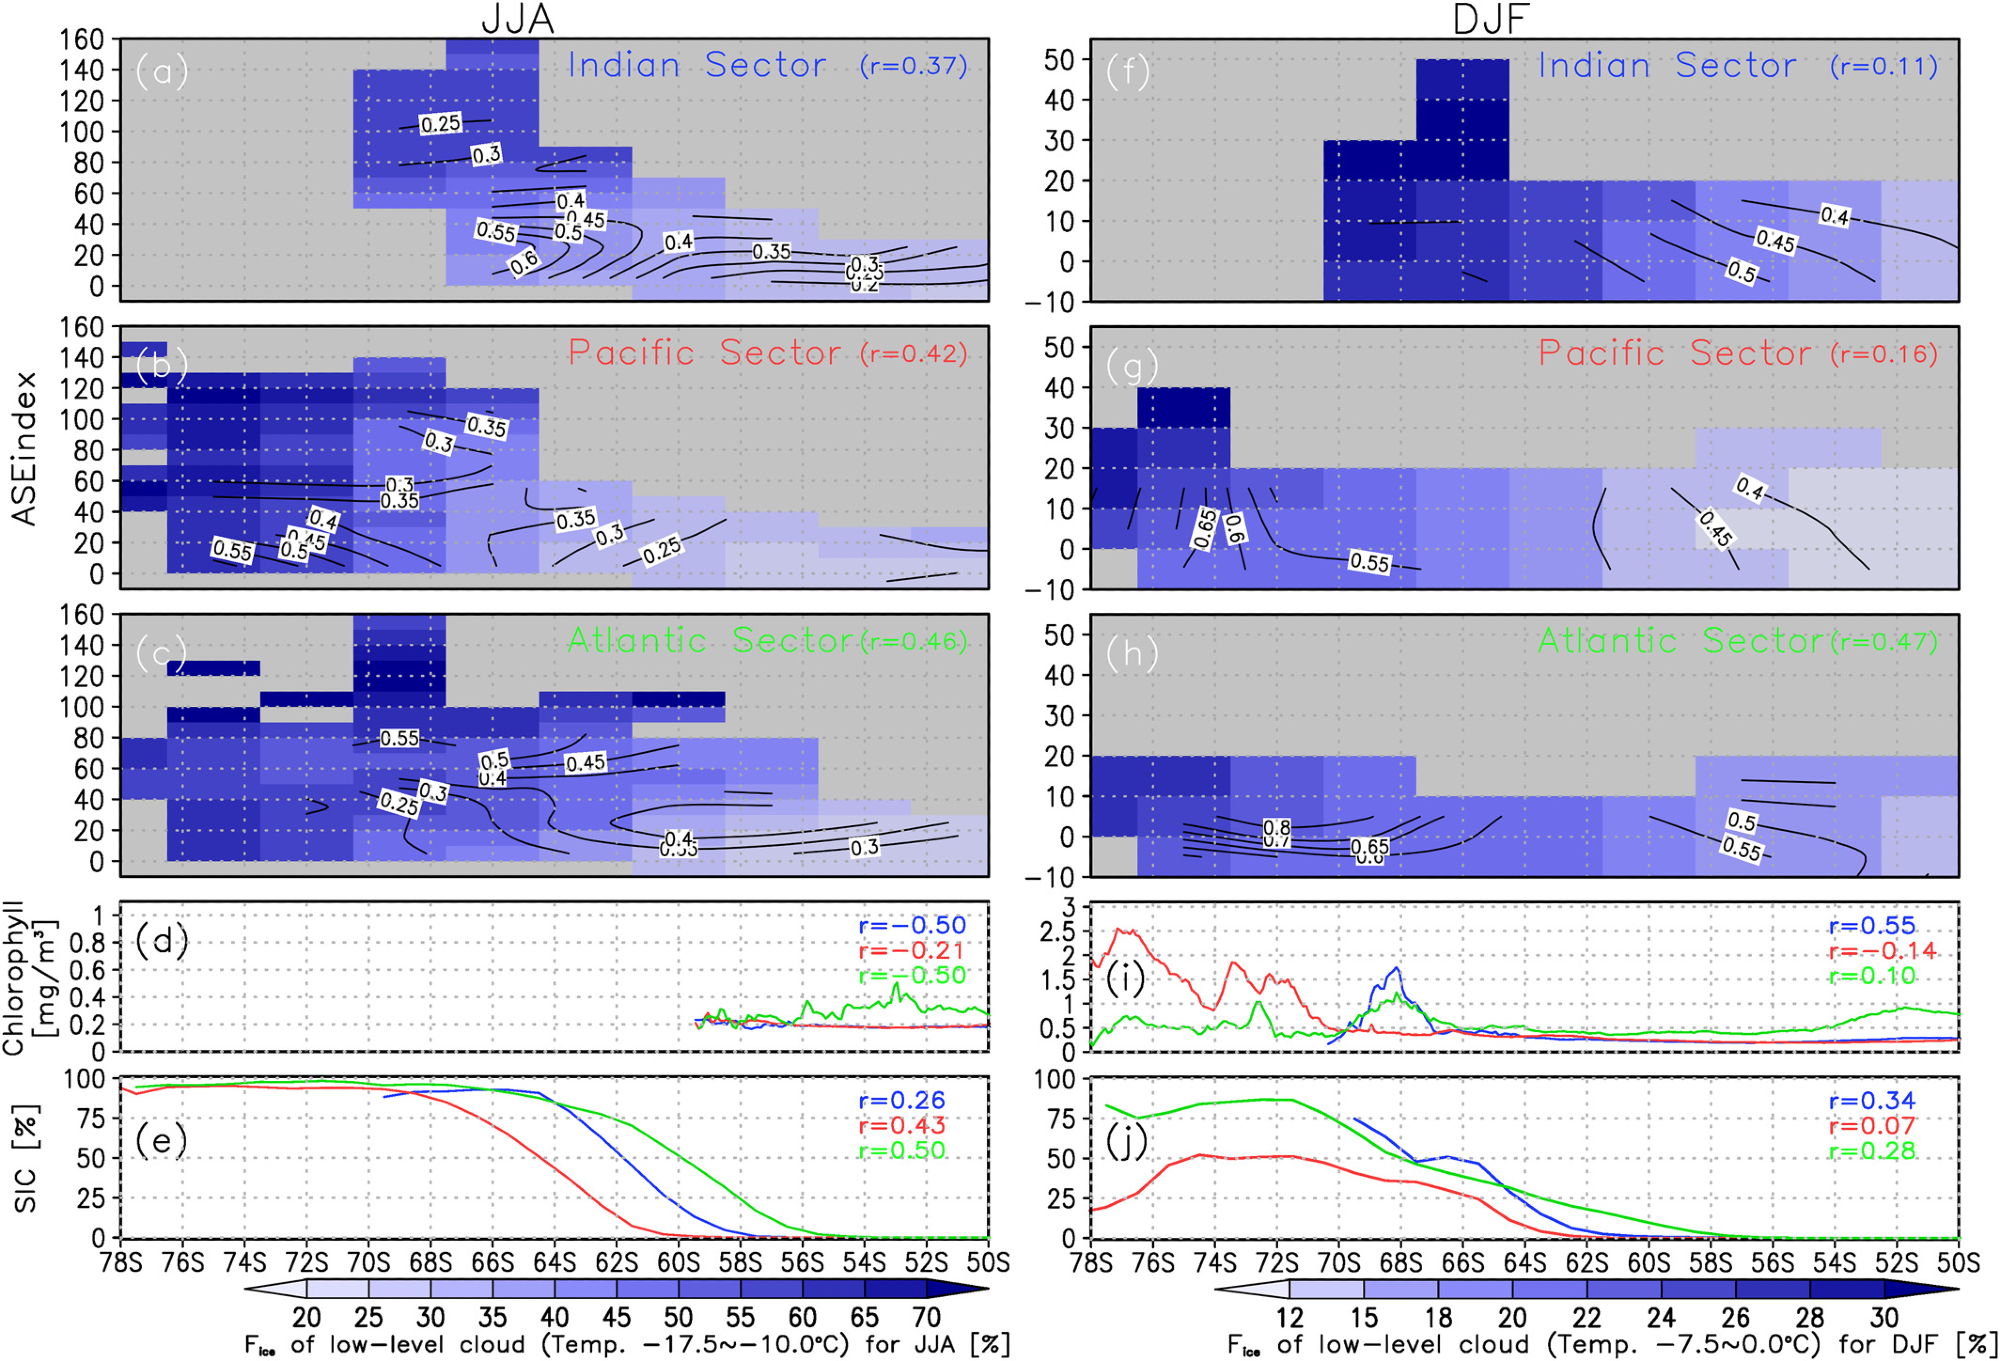
Figure 4. Dependence of averaged low-level ice-cloud fraction relative to total cloud (Fice) at higher temperatures (−17.5 °C to −10 °C) as a function of latitude and ASE index (shading: %) with aerosol optical depth for all aerosols (contours) averaged over the (a) Indian, (b) Pacific, and (c) Atlantic sectors of the Southern Ocean in austral winter 2006–2015. Values are correlation coefficients between monthly mean Fice at warm temperatures and ASE index for each region. (d) Chlorophyll concentration (mg/m2) and (e) Sea ice concentration (SIC: %) as function of latitude averaged over the Indian (blue), Pacific (red), and Atlantic sectors (green) of the Southern Ocean. Values are correlation coefficients between monthly mean Fice at higher temperatures and each parameter for each region. (f–j) Same as (a–e) but for Fice at higher temperatures (−7.5 °C to 0 °C) in austral summer. Image Credit: Sato & Inoue, 2021
Conclusion
Seasonal changes of Fice in low- and mid-level layers were observed from wintertime maxima and summertime minima. The Fice of low-level clouds over the three SO sectors and Antarctica is highest in winter. By contrast, Fice is comparatively large at temperatures varying from −17.5 °C to −10 °C under high ASE index conditions, specifically over near-coastal Antarctic regions.
Changes to total tropospheric Fice impact surface longwave/shortwave radiation budgets as the optical ice cloud depth is thinner than that of water cloud. Distributions of ice crystal and water cloud droplet size have an effect on outgoing solar radiation, but it is regarded that a comparatively small total tropospheric water cloud content is the main cause of reduction in solar radiation reflection over these regions.
During summer, the number of bioaerosols causing increased ice-cloud formation is increased by a rise in the incoming shortwave radiation at the surface through positive ice cloud-bioaerosol feedback. An extended ice-free ocean that features higher wave conditions is also propitious for increased sea spray production, promoting marine aerosol emission into the atmosphere in all seasons.
Journal Reference:
Sato, K & Inoue, J (2021) Seasonal Change in Satellite-Retrieved Lower-Tropospheric Ice-Cloud Fraction Over the Southern Ocean. Geophysical Research Letters, 48(23), p. e2021GL095295. Available Online: https://agupubs.onlinelibrary.wiley.com/doi/10.1029/2021GL095295.
References and Further Reading
- Adhikari, L., et al. (2012) Seasonal variations of Antarctic clouds observed by CloudSat and CALIPSO satellites. Journal of Geophysical Research, 117, p. D04202. doi.org/10.1029/2011JD016719.
- Alexander, S P & Protat, A (2018) Cloud properties observed from the surface and by satellite at the northern edge of the Southern Ocean. Journal of Geophysical Research: Atmospheres, 123, pp. 443–456. doi.org/10.1002/2017JD026552.
- Arrigo, K. R., et al. (2008) Primary production in the Southern Ocean, 1997–2006. Journal of Geophysical Research: Oceans, 113(C8). doi.org/10.1029/2007JC004551.
- Bélanger, S., et al. (2007) Impact of sea ice on the retrieval of water-leaving reflectance, chlorophyll a concentration and inherent optical properties from satellite ocean color data. Remote Sensing of Environment, 111, pp. 51–68. doi.org/10.1016/j.rse.2007.03.013.
- Bromwich, D. H., et al. (2012) Tropospheric clouds in Antarctica. Reviews of Geophysics, 50, p. RG1004. doi.org/10.1029/2011RG000363.
- Candlish, L. M., et al. (2013) A validation of CloudSat and CALIPSO’s temperature, humidity, cloud detection, and cloud base height over the Arctic marine cryosphere. Atmosphere-Ocean, 51(3), pp. 249–264. doi.org/10.1080/07055900.2013.798582.
- DeMott, P. J., et al. (2015) Sea spray aerosol as a unique source of ice nucleating particles. Proceedings of the National Academy of Sciences of the United States of America, 113, pp. 5797–5803. doi.org/10.1073/pnas.1514034112.
- Filioglou, M., et al. (2019) Aerosol effect on the cloud phase of low-level clouds over the Arctic. Journal of Geophysical Research: Atmospheres, 124, pp. 7886–7899. doi.org/10.1029/2018JD030088.
- Frey, W. R., et al. (2018) The combined influence of observed Southern Ocean clouds and sea ice on top-of-atmosphere albedo. Journal of Geophysical Research: Atmospheres, 123, pp. 4461–4475. doi.org/10.1029/2018JD028505.
- Gorodetskaya, I. V., et al. (2014) The role of atmospheric rivers in anomalous snow accumulation in East Antarctica. Geophysical Research Letters, 41, pp. 6199–6206. doi.org/10.1002/2014GL060881.
- Hagihara, Y., et al. (2010) Development of a combined CloudSat/CALIPSO cloud mask to show global cloud distribution. Journal of Geophysical Research, 115, p. D00H33. doi.org/10.1029/2009JD012344.
- Hallett, J & Mossop, S C (1974) Production of secondary ice particles during the riming process. Nature, 249, pp. 26–28. doi.org/10.1038/249026a0.
- Hartmann, M., et al. (2020) Wintertime airborne measurements of ice nucleating particles in the high Arctic: A hint to a marine, biogenic source for ice nucleating particles. Geophysical Research Letters, 47, pp. e2020GL087770. doi.org/10.1029/2020GL087770.
- Hersbach, H., et al. (2020) The ERA5 global reanalysis. Quarterly Journal of the Royal Meteorological Society, 146, pp. 1999–2049. doi.org/10.1002/qj.3803.
- Hirano, D., et al. (2020) Strong ice-ocean interaction beneath Shirase Glacier Tongue in East Antarctica. Nature Communications, 11, p. 4221. doi.org/10.1038/s41467-020-17527-4.
- Hoose, C & Möhler, O (2012) Heterogeneous ice nucleation on atmospheric aerosols: A review of results from laboratory experiments. Atmospheric Chemistry and Physics, 12, pp. 9817–9854. doi.org/10.5194/acp-12-9817-2012.
- Hu, C., et al. (2012) Chlorophyll a algorithms for oligotrophic oceans: A novel approach based on three-band reflectance difference. Journal of Geophysical Research: Oceans, 117, p. C01011. doi.org/10.1029/2011JC007395.
- Hu, Y., et al. (2009) CALIPSO/CALIOP cloud phase discrimination algorithm. Journal of Atmospheric and Oceanic Technology, 26, pp. 2293–2309. doi.org/10.1175/2009JTECHA1280.1.
- Huang, Y., et al. (2012) A study on the low-altitude clouds over the Southern Ocean using the DARDAR-MASK. Journal of Geophysical Research, 117, p. D18204. doi.org/10.1029/2012JD017800.
- Inoue, J & Hori, M E (2011) Arctic cyclogenesis at the marginal ice zone: A contributory mechanism for the temperature amplification? Geophysical Research Letters, 38(12), p. L12502. doi.org/10.1029/2011GL047696.
- Inoue, J., et al. (2021) Application of cloud particle sensor sondes for estimating the number concentration of cloud water droplets and liquid water content: Case studies in the Arctic region. Atmospheric Measurement Techniques, 14(7), pp. 4971–4987. doi.org/10.5194/amt-14-4971-2021.
- Inoue, J., et al. (2021) Oceanic supply of ice nucleating particles and its effect on ice cloud formation: A case study in the Arctic Ocean during a cold-air outbreak in early winter. Geophysical Research Letters, 48, p. e2021GL094646. doi.org/10.1029/2021gl094646.
- Jolly, B., et al. (2018) An analysis of the cloud environment over the Ross Sea and Ross Ice Shelf using CloudSat/CALIPSO satellite observations: The importance of synoptic forcing. Atmospheric Chemistry and Physics, 18, pp. 9723–9739. doi.org/10.5194/acp-18-9723-2018.
- Kato, S., et al. (2018) Surface irradiances of edition 4.0 Clouds and the Earth’s Radiant Energy System (CERES) Energy Balanced and Filled (EBAF) data product. Journal of Climate, 31(11), pp. 4501–4527. doi.org/10.1175/JCLI-D-17-0523.1.
- Kawai, H., et al. (2015) Characteristics of the cloud top heights of marine boundary layer clouds and the frequency of marine fog over mid-latitudes. Journal of the Meteorological Society of Japan, 93, pp. 613–628. doi.org/10.2151/jmsj.2015-045.
- Kawamoto, K., et al. (2020) Effect of dust load on the cloud top ice-water partitioning over northern middle to high latitudes with CALIPSO products. Geophysical Research Letters, 46, p. e2020GL088030. doi.org/10.1029/2020GL088030.
- Kirpes, R. M., et al. (2019) Wintertime Arctic sea spray aerosol composition controlled by sea ice lead microbiology. ACS Central Science, 5(11), pp. 1760–1767. doi.org/10.1021/acscentsci.9b00541.
- Kuma, P., et al. (2020) Evaluation of Southern Ocean cloud in the HadGEM3 general circulation model and MERRA-2 reanalysis using ship-based observations. Atmospheric Chemistry and Physics, 20, pp. 6607–6630. doi.org/10.5194/acp-20-6607-2020.
- Lawson, R P & Gettelman, A (2014) Impact of Antarctic mixed-phase clouds on climate. Proceedings of the National Academy of Sciences of the United States of America, 111(51), pp. 18156–18161. doi.org/10.1073/pnas.1418197111.
- Listowski, C., et al. (2019) Antarctic clouds, supercooled liquid water, and mixed phase, investigated with DARDAR: Geographical and seasonal variations. Atmospheric Chemistry and Physics, 19, pp. 6771–6808. doi.org/10.5194/acp-19-6771-2019.
- Loeb, N. G., et al. (2018) Clouds and the Earth’s Radiant Energy System (CERES) Energy Balanced and Filled (EBAF) Top-of-atmosphere (TOA) edition-4.0 data product. Journal of Climate, 31, pp. 895–918. doi.org/10.1175/jcli-d-17-0208.1.
- Mace, G. G., et al. (2020) On the frequency of occurrence of the ice phase in supercooled Southern Ocean low clouds derived from CALIPSO and CloudSat. Geophysical Research Letters, 47, p. e2020GL087554. doi.org/10.1029/2020GL087554.
- Mace, G. G., et al. (2021) Mixed-phase clouds over the Southern Ocean as observed from satellite and surface-based lidar and radar. Journal of Geophysical Research: Atmospheres, 126, p. e2021JD034569. doi.org/10.1029/2021JD034569.
- McCluskey, C. S., et al. (2018) Observations of ice nucleating particles over Southern Ocean waters. Geophysical Research Letters, 45, pp. 11989– 11997. doi.org/10.1029/2018GL079981.
- McFarquhar, G. M., et al. (2020) Observations of clouds, aerosols, precipitation, and surface radiation over the Southern Ocean: An overview of CAPRICORN, MARCUS, MICRE, and SOCRATES. Bulletin of the American Meteorological Society, 102(4), p. E894–E928.
- Nishizawa, T., et al. (2011) Algorithms to retrieve optical properties of three component aerosols from two-wavelength backscatter and one-wavelength polarization lidar measurements considering nonsphericity of dust. Journal of Quantitative Spectroscopy & Radiative Transfer, 112, pp. 254–267. doi.org/10.1016/j.jqsrt.2010.06.002.
- Okamoto, H., et al. (2010) Global analysis of ice microphysics from CloudSat and CALIPSO: Incorporation of specular reflection in lidar signals. Journal of Geophysical Research, 115, p. D22209. doi.org/10.1029/2009JD013383.
- Partain, P. (2007). CloudSat ECMWF-AUX auxiliary data process description and interface control document, p. 11. Cooperative Institute for Research in the Atmosphere, Colorado State University.
- Rayner, N. A., et al. (2003) Global analyses of sea surface temperature, sea ice, and night marine air temperature since the late nineteenth century. Journal of Geophysical Research: Atmospheres, 108(D14), p. 4407. doi.org/10.1029/2002JD002670.
- Richert, I., et al. (2019) Summer comes to the Southern Ocean: How phytoplankton shape bacterioplankton communities far into the deep dark sea. Ecosphere, 10(3), p. e02641. doi.org/10.1002/ecs2.2641.
- Sato, K., et al. (2018) Improved reanalysis and prediction of atmospheric fields over the Southern Ocean using campaign-based radiosonde observations. Geophysical Research Letters, 45, pp. 11406–11413. doi.org/10.1029/2018GL079037.
- Sato, K., et al. (2012) Impact of Arctic sea-ice retreat on the recent change in cloud-base height during autumn. Geophysical Research Letters, 39, p. L10503. doi.org/10.1029/2012GL051850.
- Sato, K., et al. (2021) Antarctic Peninsula warm winters influenced by Tasman Sea temperatures. Nature Communications, 12, p. 1497. doi.org/10.1038/s41467-021-21773-5.
- Sato, K., et al. (2020) Antarctic radiosonde observations reduce uncertainties and errors in reanalyses and forecasts over the Southern Ocean: An extreme cyclone case. Advances in Atmospheric Sciences, 37, pp. 431–440. doi.org/10.1007/s00376-019-8231-x.
- Sato, K & Okamoto, H (2011). Refinement of global ice microphysics using spaceborne active sensors. Journal of Geophysical Research, 116, p. D20202. doi.org/10.1029/2011JD015885.
- Sato, K & Simmonds, I (2021) Antarctic skin temperature warming related to enhanced downward longwave radiation associated with increased atmospheric advection of moisture and temperature. Environmental Research Letters, 16, p 064059. doi.org/10.1088/1748-9326/ac0211.
- Scott, B C & Hobbs, P V (1977). A theoretical study of the evolution of mixed-phase cumulus clouds. Journal of the Atmosphere Science, 34, pp. 812–826. doi.org/10.1175/1520-0469(1977)034<0812:atsote>2.0.co;2.
- Scott, R C, et al. (2017) West Antarctic ice sheet cloud cover and surface radiation budget from NASA A-Train satellites. Journal of Climate, 30(16), pp. 6151–6170. doi.org/10.1175/jcli-d-16-0644.1.
- Simmonds, I., et al. (2003) Synoptic activity in the seas around Antarctica. Monthly Weather Review, 131(2), pp. 272–288. doi.org/10.1175/1520-0493(2003)131<0272:saitsa>2.0.co;2.
- Tamura, T., et al. (2016) Sea ice production variability in Antarctic coastal polynyas. Journal of Geophysical Research: Oceans, 121, pp. 2967–2979. https://doi.org/10.1002/2015JC011537.
- Taylor, M. H., et al. (2013) On the drivers of phytoplankton blooms in the Antarctic marginal ice zone: A modeling approach. Journal of Geophysical Research: Oceans, 118, pp. 63–75. doi.org/10.1029/2012JC008418.
- Taylor, P. C., et al. (2015) Covariance between Arctic sea ice and clouds within atmospheric state regimes at the satellite footprint level. Journal of Geophysical Research: Atmospheres, 120(656–12), pp. 12656–12678. doi.org/10.1002/2015JD023520.
- Uetake, J., et al. (2020) Airborne bacteria confirm the pristine nature of the Southern Ocean boundary layer. Proceedings of the National Academy of Sciences of the United States of America, 117 (24), pp. 13275–13282. doi.org/10.1073/pnas.2000134117.
- Vardiman, L (1978) The generation of secondary ice particles in clouds by crystal-crystal collision. Journal of the Atmosphere Sciences, 35, pp. 2168–2180. doi.org/10.1175/1520-0469(1978)035<2168:tgosip>2.0.co;2.
- Vergara-Temprado, J., et al. (2018) Strong control of Southern Ocean cloud reflectivity by ice-nucleating particles. Proceedings of the National Academy of Sciences of the United States of America, 115, pp. 2687–2692. doi.org/10.1073/pnas.1721627115.
- Villanueva, D., et al. (2021) Hemispheric and seasonal contrast in cloud thermodynamic phase from A-Train spaceborne instruments. Journal of Geophysical Research: Atmospheres. 126, p. e2020JD034322. doi.org/10.1073/pnas.1721627115.
- Wall, J. C., et al. (2017) Low-cloud, boundary layer, and sea ice interactions over the Southern Ocean during winter. Journal of Climate, 30, pp. 4857–4871. doi.org/10.1175/jcli-d-16-0483.1.
- Waseda, T., et al. (2018) Correlated increase of high ocean waves and winds in the ice-free waters of the Arctic ocean. Scientific Reports, 8, p. 4489. doi.org/10.1038/s41598-018-22500-9.
- Williams, C. M., et al. (2016) Pelagic microbial heterotrophy in response to a highly productive bloom of Phaeocystis Antarctica in the Amundsen Sea Polynya, Antarctica. ELEMENTA: Science of the Anthropocene, 4, p. 000102.
- Winker, D. M., et al. (2007) Initial performance assessment of CALIOP. Geophysical Research Letters, 34, L19803. doi.org/10.1029/2007GL030135.
- Yamauchi, A., et al. (2018) Differences in the fractions of ice clouds between eastern and western parts of Eurasian continent using CALIPSO in January 2007. Atmospheric Science Letters, 19, p. e807. doi.org/10.1002/asl.807.
- Yamauchi, A., et al. (2020) Differences in cloud characteristics between Barents Sea and East Siberian Sea using CALIPSO data. Journal of the Remote Sensing Society of Japan, 40, pp. S12–S18. doi.org/10.11440/rssj.40.S12.
- Yoshida, R., et al. (2010) Global analysis of cloud phase and ice crystal orientation from Cloud-Aerosol Lidar and Infrared Pathfinder Satellite Observation (CALIPSO) data using attenuated backscattering and depolarization ratio. Journal of Geophysical Research, 115, p. D00H32. doi.org/10.1029/2009JD012334.