Nanoplastics (<1 µm) and microplastics (<5 mm) are of growing concern in food, health, and environment-related fields. To reliably measure them, particle-resolved data on size, chemical composition, and morphology is required.
Raman microscopy facilitates the imaging of nanoplastics and microplastics and advanced chemical identification, providing a non-harmful analytical technique with submicron spatial resolution.
Grounded in inelastic light scattering, Raman spectroscopy provides molecular fingerprints that help to clearly categorize material. Raman imaging and particle-by-particle microspectroscopy, complementary Raman-based techniques, are compared in this article.
Comparing Measurement Techniques
Particles are optically selected and analyzed individually in particle-by-particle microspectroscopy. This method is adaptable and capable of selective analysis but is affected by reduced statistical relevance, selection bias, and prolonged measurement time at higher particle counts.
When employing Raman imaging, spatially resolved chemical datasets are created, enabling classification based on chemical contrast, evaluation of heterogeneous particles, and improved categorization reliability through spectral averaging.
Experimental Setup
All calculations were carried out using a confocal RAMANtouch Raman microscope fitted with a high-numerical-aperture objective. As precise characterization optimization is crucial for accurate measurement of nanoplastics, parameters were optimized to balance spatial resolution, spectral quality, and acquisition speed.
- Laser wavelength: 532 nm
- Laser power: 8.7 mW (point mode)/115 mW (line mode)
- Integration time: Two x 0.5 seconds (point mode)/three seconds (line mode)
- Objective: 100×, NA 0.9
- Step size (imaging): 200 nm
- Identification process: Library matching (particle mode)/correlation (imaging)
Results and Discussion
To reduce the filter substrate’s influence on the comparison, the nanoplastic particle reference sample was analyzed on a flat glass surface. Both imaging and particle-by-particle techniques were used to evaluate performance in discerning, detecting, and analyzing particles.
Particle-by-Particle Microspectroscopy
Initially, nanoplastic particles were localized according to their visual contrast in the optical image. The detection of particles was improved by changing key variables, for example, intensity thresholds, autofocus conditions, and size filters.
These variables strongly affect the obtained particle metrics and, as such, demand meticulous tuning. Before the measurement, integration time and laser power were specified.
The extracted particle coordinates were evaluated in sequence once the analysis had begun. A Raman spectrum was obtained for each detected particle (Figure 1, top right) and associated with its matching morphological descriptors from the visual image.
Lastly, material determination was carried out via database comparison of the collected spectra, finalizing the automated analysis procedure from particle detection to chemical classification. The observed particles were properly categorized as polystyrene.
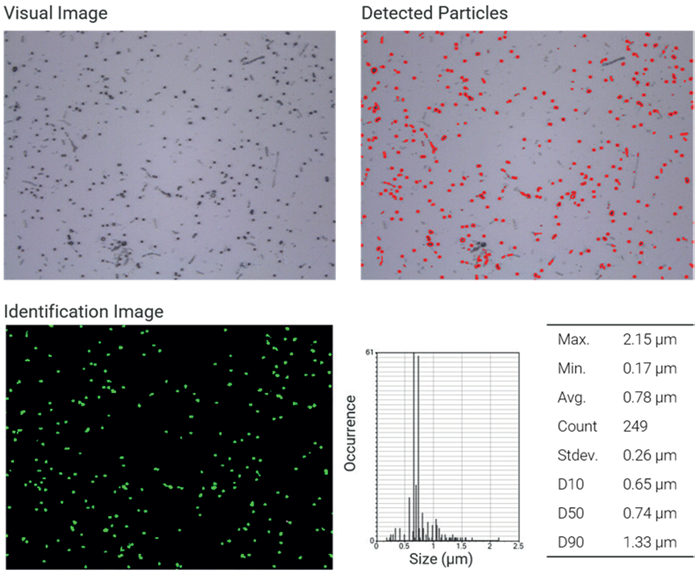
Figure 1. NP analysis particle by particle. Top left: Visual image of nanoplastics (100x objective lens). Top right: Map of detected particles based on visual contrast. Bottom left: Identified polystyrene particles based on the Raman spectrum. Bottom right: Particle and size statistics. Image Credit: Bruker Optics
Raman Imaging
When evaluating Raman imaging, the same field of view was examined using laser line scanning. In this technique, the integration time and laser power had to be enhanced to create a balance between an appropriate signal-to-noise ratio and efficient acquisition, along with the scanning step size.
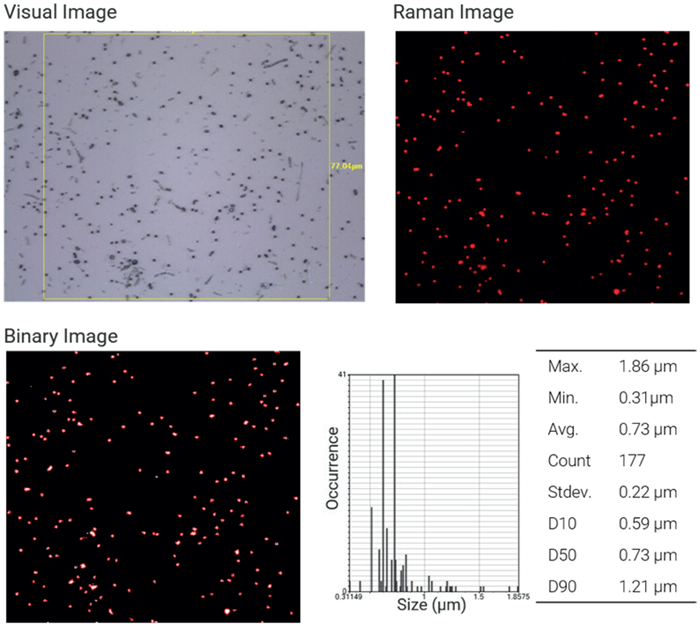
Figure 2. NP analysis by imaging. Top left: Visual image of nanoplastics with region of interest (100x objective lens). Top right: Raman image of polystyrene particles based on correlation analysis. Bottom left: Binarization of the Raman image to extract particle statistics. Bottom right: Particle and size statistics. Image Credit: Bruker Optics
The obtained Raman dataset (Figure 2) was assessed using correlation analysis, with reference spectra from several polymer types. A significant correlation with the polystyrene reference spectrum is displayed in red, verifying the predicted material composition.
Particle data (Figure 2, bottom right) was then generated through binarizing the correlation image. This data is strongly reliant on the spatial resolution of the analysis, notably the designated step size, which has a direct impact on the binarization thresholds, alongside the validity of particle size and shape evaluation.
Direct Comparison
Ultimately, both techniques offered reliable detection and characterization of nanoplastics down to submicron sizes. Equivalent particle counts were acquired for both approaches after particles outside the Raman imaging area were excluded.
Slight variations were noticed:
- Two particles identified in Raman imaging are not located in the particle-by-particle technique (Figure 3, white circles), and conversely (Figure 3, blue circles).
- Particle sizes obtained from optical discovery are normally bigger, as neighboring characteristics are included (Figure 3, orange circles).
- Raman imaging-based sizing is highly reliant on pixel resolution and step size.
These changes happen because the evaluation and detection strategies are inherently unique. Raman imaging delivers a clear chemical map of the complete area of measurement, while particle-by-particle analysis depends on optical pre-selection and can exclude low-contrast particles.
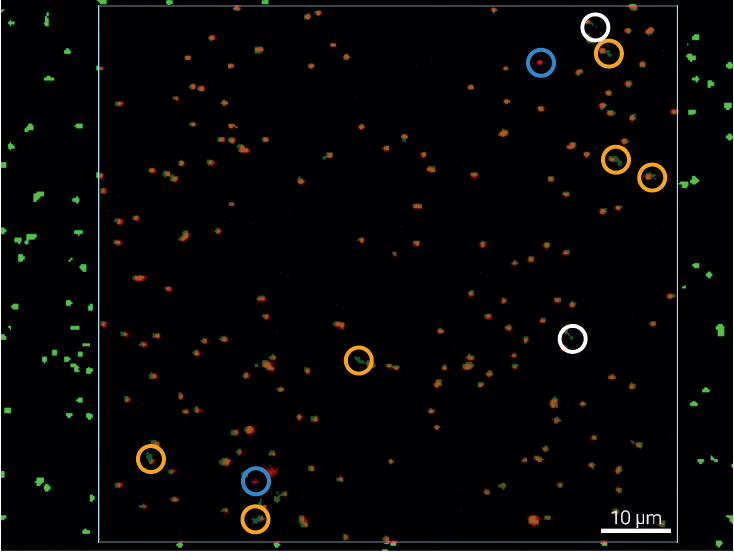
Figure 3. Particle Analysis Overlay. Merge of particle-by-particle and Raman imaging analysis results. White circles indicate particles detected by microspectroscopy but missing in the Raman imaging result, while light blue circles highlight particles identified by Raman imaging but not captured in the particle-by-particle approach. Yellow circles mark discrepancies in particle size, arising from differences in the respective size-determination methods. Image Credit: Bruker Optics
Conclusion
Raman microscopy is a dynamic and strong method for nanoplastic identification, offering particle-resolved assessment and chemical characterization at the submicron scale.
Both Raman imaging and particle-by-particle microspectroscopy deliver reliable performance and yield highly comparable results in a controlled model system.
While Raman imaging yields transparent, spatially resolved chemical data, particle-by-particle quantification offers efficient and targeted measurements. The strong harmony amongst these methods emphasizes their complementary nature.
When combined, these methods produce a dynamic and robust analytical process for nanoplastic evaluation and provide a powerful basis for future measurements of real-world samples and complicated mixtures.
Acknowledgments
Produced from materials originally authored by Fabian Knechtel from Bruker Optics GmbH & Co. KG.

This information has been sourced, reviewed, and adapted from materials provided by Bruker Optics.
For more information on this source, please visit Bruker Optics.