Article updated on 26 November 2021
Coastal ecosystems undergo pressures from both offshore and land-based human activity along with human wastewater—an area that is less researched. The current methods used for the same do not account for both nitrogen (N) and pathogen inputs. Looking at Tuholske, C. et al's paper published in the journal PLOS ONE, this article discusses the use of a new high-resolution geospatial model to evaluate and map N and pathogen from human sewage for ~135,000 watersheds around the world.

Image Credit: Davdeka/Shutterstock.com
Coastal marine ecosystems undergo various pressures, including overfishing, climate change, offshore commercial uses, and land-based activities such as agriculture. Nutrient and chemical pollution run-off from land-based activities connect coastal marine systems to terrestrial human activities.
It has been noted that agricultural fertilizers and livestock waste play a major role in coastal eutrophication, hypoxic zones, harmful algal blooms, or anoxic dead zones with significant impacts which are worsened with global climate change.
Certain studies measured and mapped the effects of human sewage on coastal ecosystems which are known to contribute significantly to anthropogenic N inputs. However, treatment methods involved emitting N while removing pathogens, and there is no combined research on nutrient input and pathogen risk as of now.
Present processes analyzing nitrogen or pathogen input to surface water from human sewage have their own set of limitations as they both rely on a common modeling design and do not account for the impact of future climate and socioeconomic change.
This study is the first of its kind presenting a globally comprehensive, fine-resolution (~1-km) analysis of N and pathogen from wastewater from almost 135,000 watersheds and coastal zones that drain into the ocean.
The study evaluates differences between N and pathogen inputs and the estimated potential exposure of two major sensitive habitats (coral reefs and seagrass beds) to these inputs.
AZoCleantech spoke to Cascade Tuholske, the Earth Institute Postdoctoral Research Scientist from Columbia University working on the project:
Our study literally puts the problem of wastewater inputs to the ocean on the map. Until now, we have lacked a high resolution understanding of how wastewater impacts coastal ecosystems worldwide. But by mapping both Nitrogen and pathogen wastewater inputs across 133,000 plus watersheds, we can begin to address the problem and improve both human and ecosystem health across coastal waters worldwide.
Cascade Tuholske, Earth Institute Postdoctoral Research Scientist, Center for International Earth Science Information Network (CIESIN), Columbia Climate School, Columbia University
Methodology
Both nitrogen effluent (N, grams yr−1) and pathogens [as estimated by fecal indicator organisms (FIO)] were created through a similar approach. The population and settlement type data (~1 km resolution) were merged with national-level statistics on protein consumption (for nitrogen alone).
The study used the following programs to carry out the analyses:
- Python v3.7
- R v3.6.3
- GRASS GIS v7.8.3
European Global Human Settlement Population Layer version 4 (GHS-Pop) was employed to provide population estimates for 2015. GHS-Pop is the sole gridded population dataset with corresponding settlement typologies (GHS-SMOD) created from a common modeling paradigm.
National statistics from WHO-UNICEF 2017 Joint Monitoring Project Wastewater (JMP) was used to estimate the amount of N removed from wastewater and access to sanitation was employed to calculate N production coefficients.
Three sewage treatment categories of nitrogen removal efficiency were developed. The proposed model utilized a uniform N removal rate for sewage systems. FIO production was modeled as a function of sanitation infrastructure and population size. This enables evaluating the exposure of coastal ecosystems to FIOs.
The model presumed that populations with inputs from septic tanks or open defecation more than a kilometer far from coastlines and surface water do not contribute to effluent totals.
To evaluate pixel-level N effluents, the proposed model utilized FAO’s Food Balance Sheets containing information for 178 countries to look at annual national estimates for grams of protein consumed per capita.
As metabolic research has established that 16% of the protein ingested is excreted in various forms of N, the pixel-level consumption was scaled by 0.16 to obtain an N excretion base. A database of national-level protein consumption and per capita GDP was constructed to account for the unavailable data.
A high-resolution watershed vector data with corresponding pourpoints were developed with an automated flow-accumulation process. To estimate each nation’s discharge into the world’s oceans, the effluents of all the pourpoints within the country were summed.
The plume model helped to distribute values into coastal waters based on a cost path. This enables drivers to wrap around headlands and islands.
The modeled wastewater plume data evaluated coal and seagrass exposure to N inputs from wastewater. The N values for each sanitation system and the total N from all wastewater for each raster cell containing the habitat were extracted.
Results
The proposed model shows that wastewater inputs into coastal waters amount to an estimated 6.2 Tg N of total anthropogenic N in coastal ecosystems around the world. The current fine-resolution model enables the identification of locations of specifically high (or low) inputs (see Figure 1).
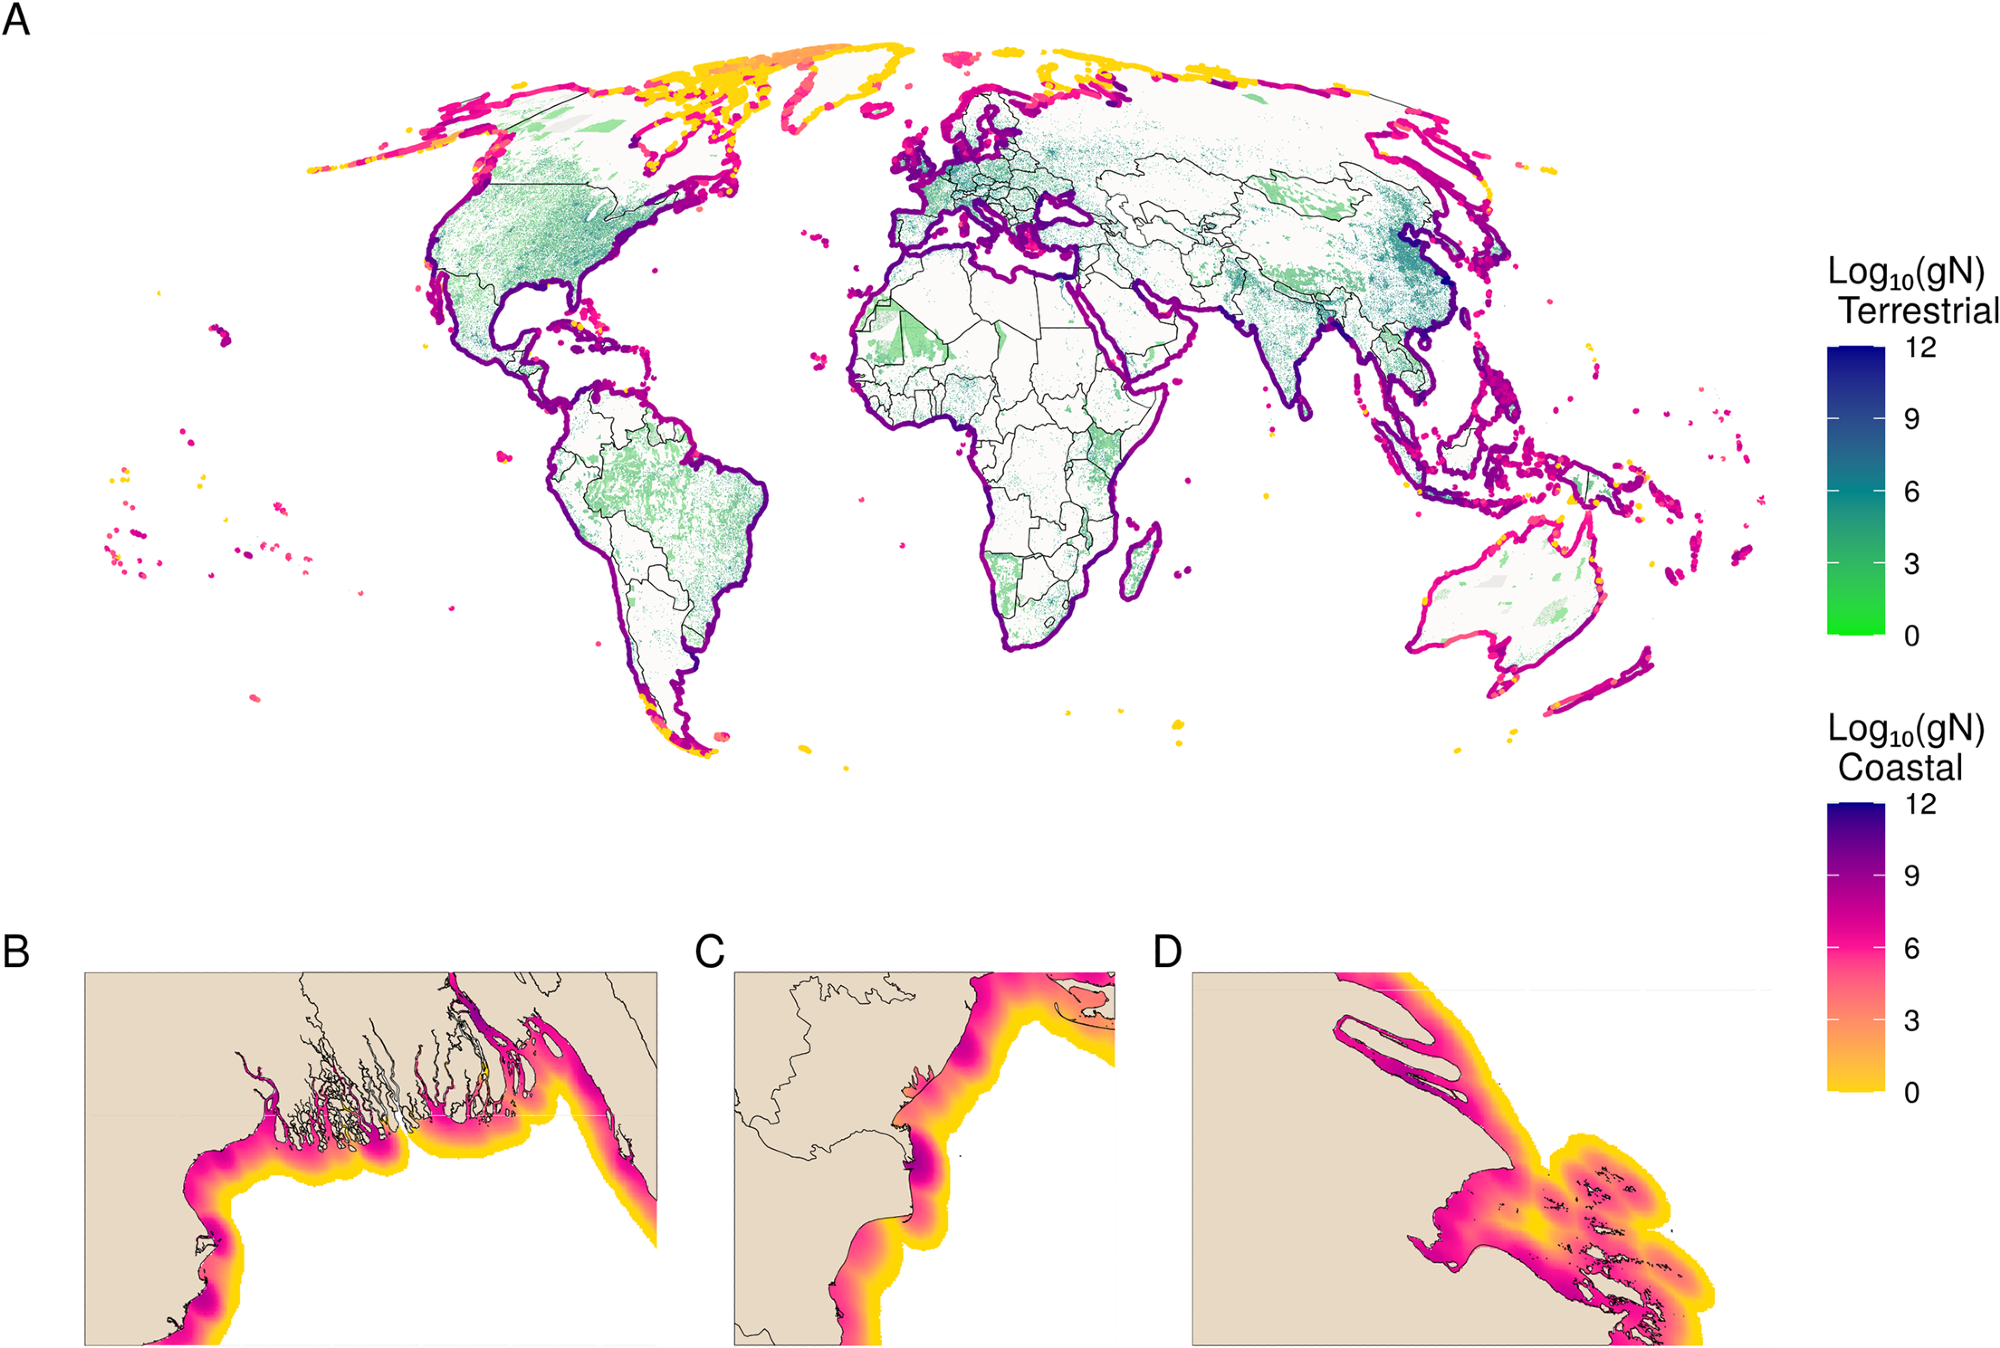
Figure 1. Global distribution of total wastewater N. (A) Global map of the terrestrial sources (green to blue) and coastal diffusion of inputs (yellow to purple) of total wastewater N, measured in log10(gN) in both. Coastal plumes have been buffered to line segments to exaggerate patterns to be visible at the global scale. Insets show zoomed-in views of the (B) Ganges, (C) Danube, and (D) Chang Jiang (Yangtze) Rivers, showing wastewater plumes at high resolution. Image Credit: Tuholske, et al., 2021.
Figure 2 underlines the significant variation by country and region.
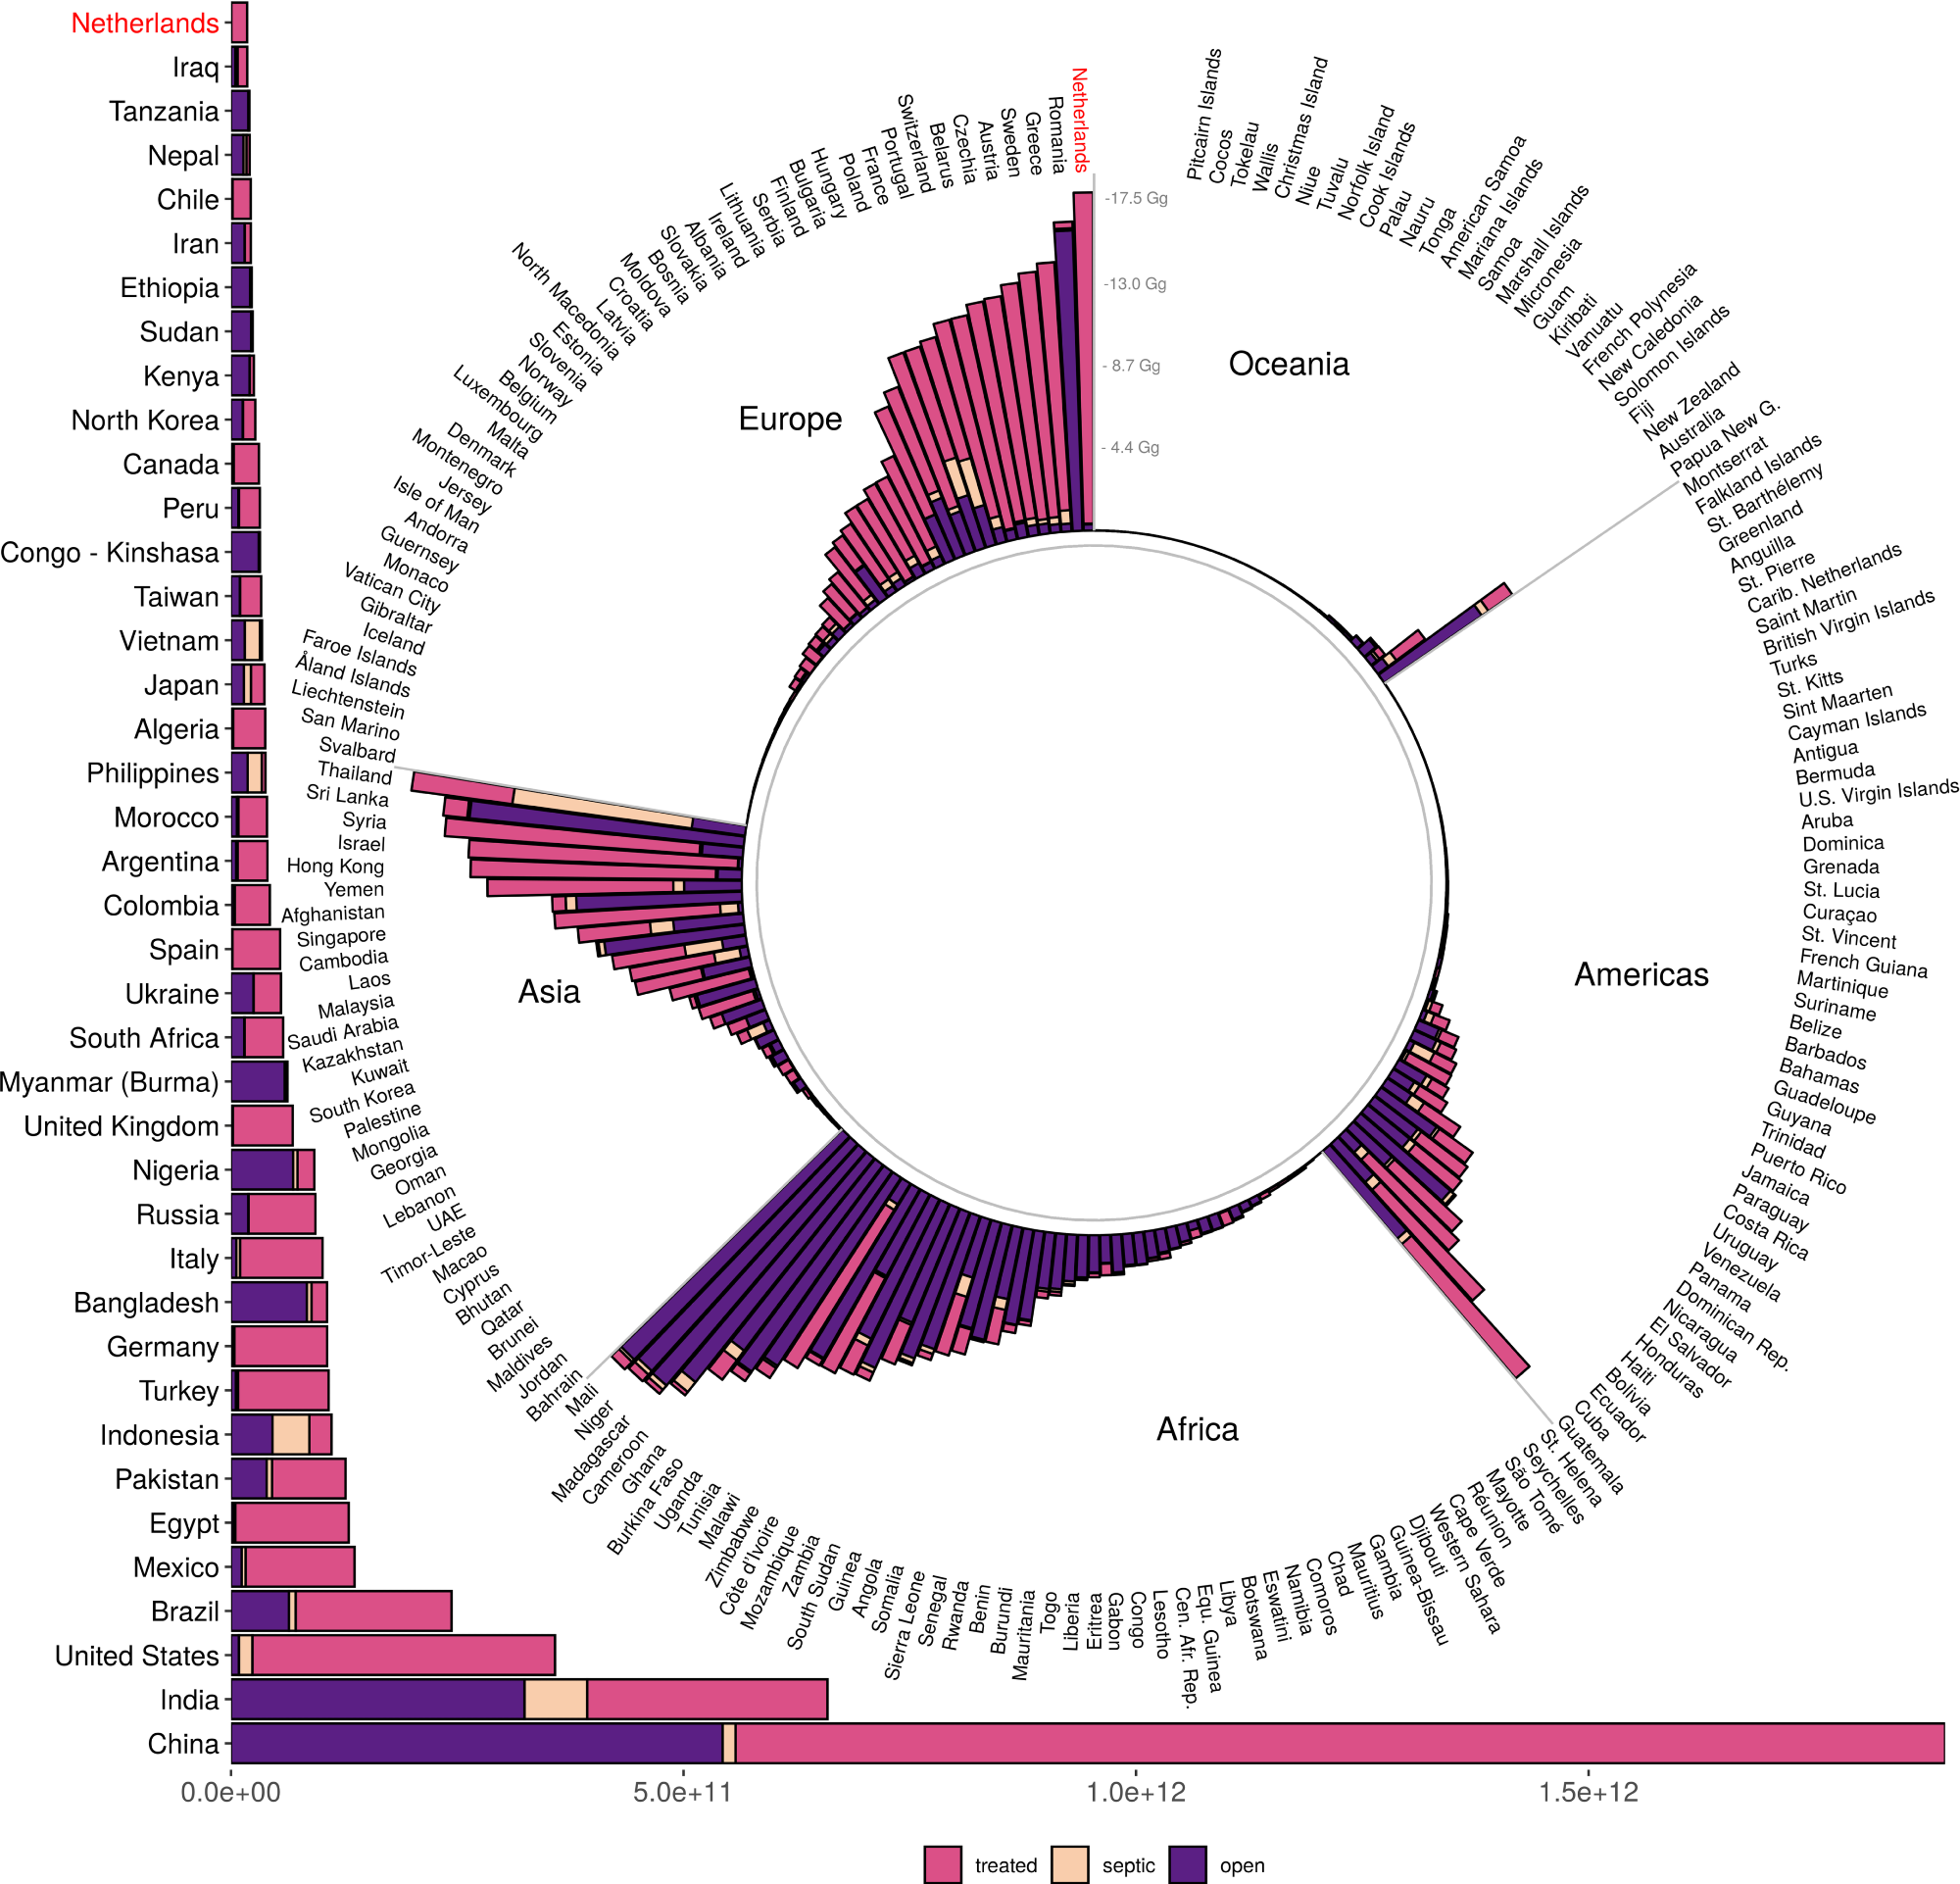
Figure 2. Total nitrogen input into Exclusive Economic Zone (EEZ) waters of coastal countries, by source type (sewer, septic, direct). The global total wastewater input is 6.2 Tg N, with 3.9 Tg from sewers, 0.3 Tg from septic, and 2 Tg from direct input. The top 40 countries are shown in the horizontal bar chart; the remaining countries are in the pinwheel, grouped by continent or larger geographical region. Note that the Netherlands is shown in both places (in red) to help connect the scale of the two parts of the figure. Image Credit: Tuholske, et al., 2021.
The proposed model indicates that wastewater input of N from watersheds into coastal waters is highly concentrated, with half (n = 67,308) of all watersheds adding no nitrogen or pathogens.
The wastewater N source differs across the watersheds—from sewered to direct input. By modeling the plume of wastewater N into coastal waters, it was evaluated that around 58% of all coral reefs worldwide and 88% of all seagrass beds encounter some anthropogenic N input from wastewater (see Figure 3).
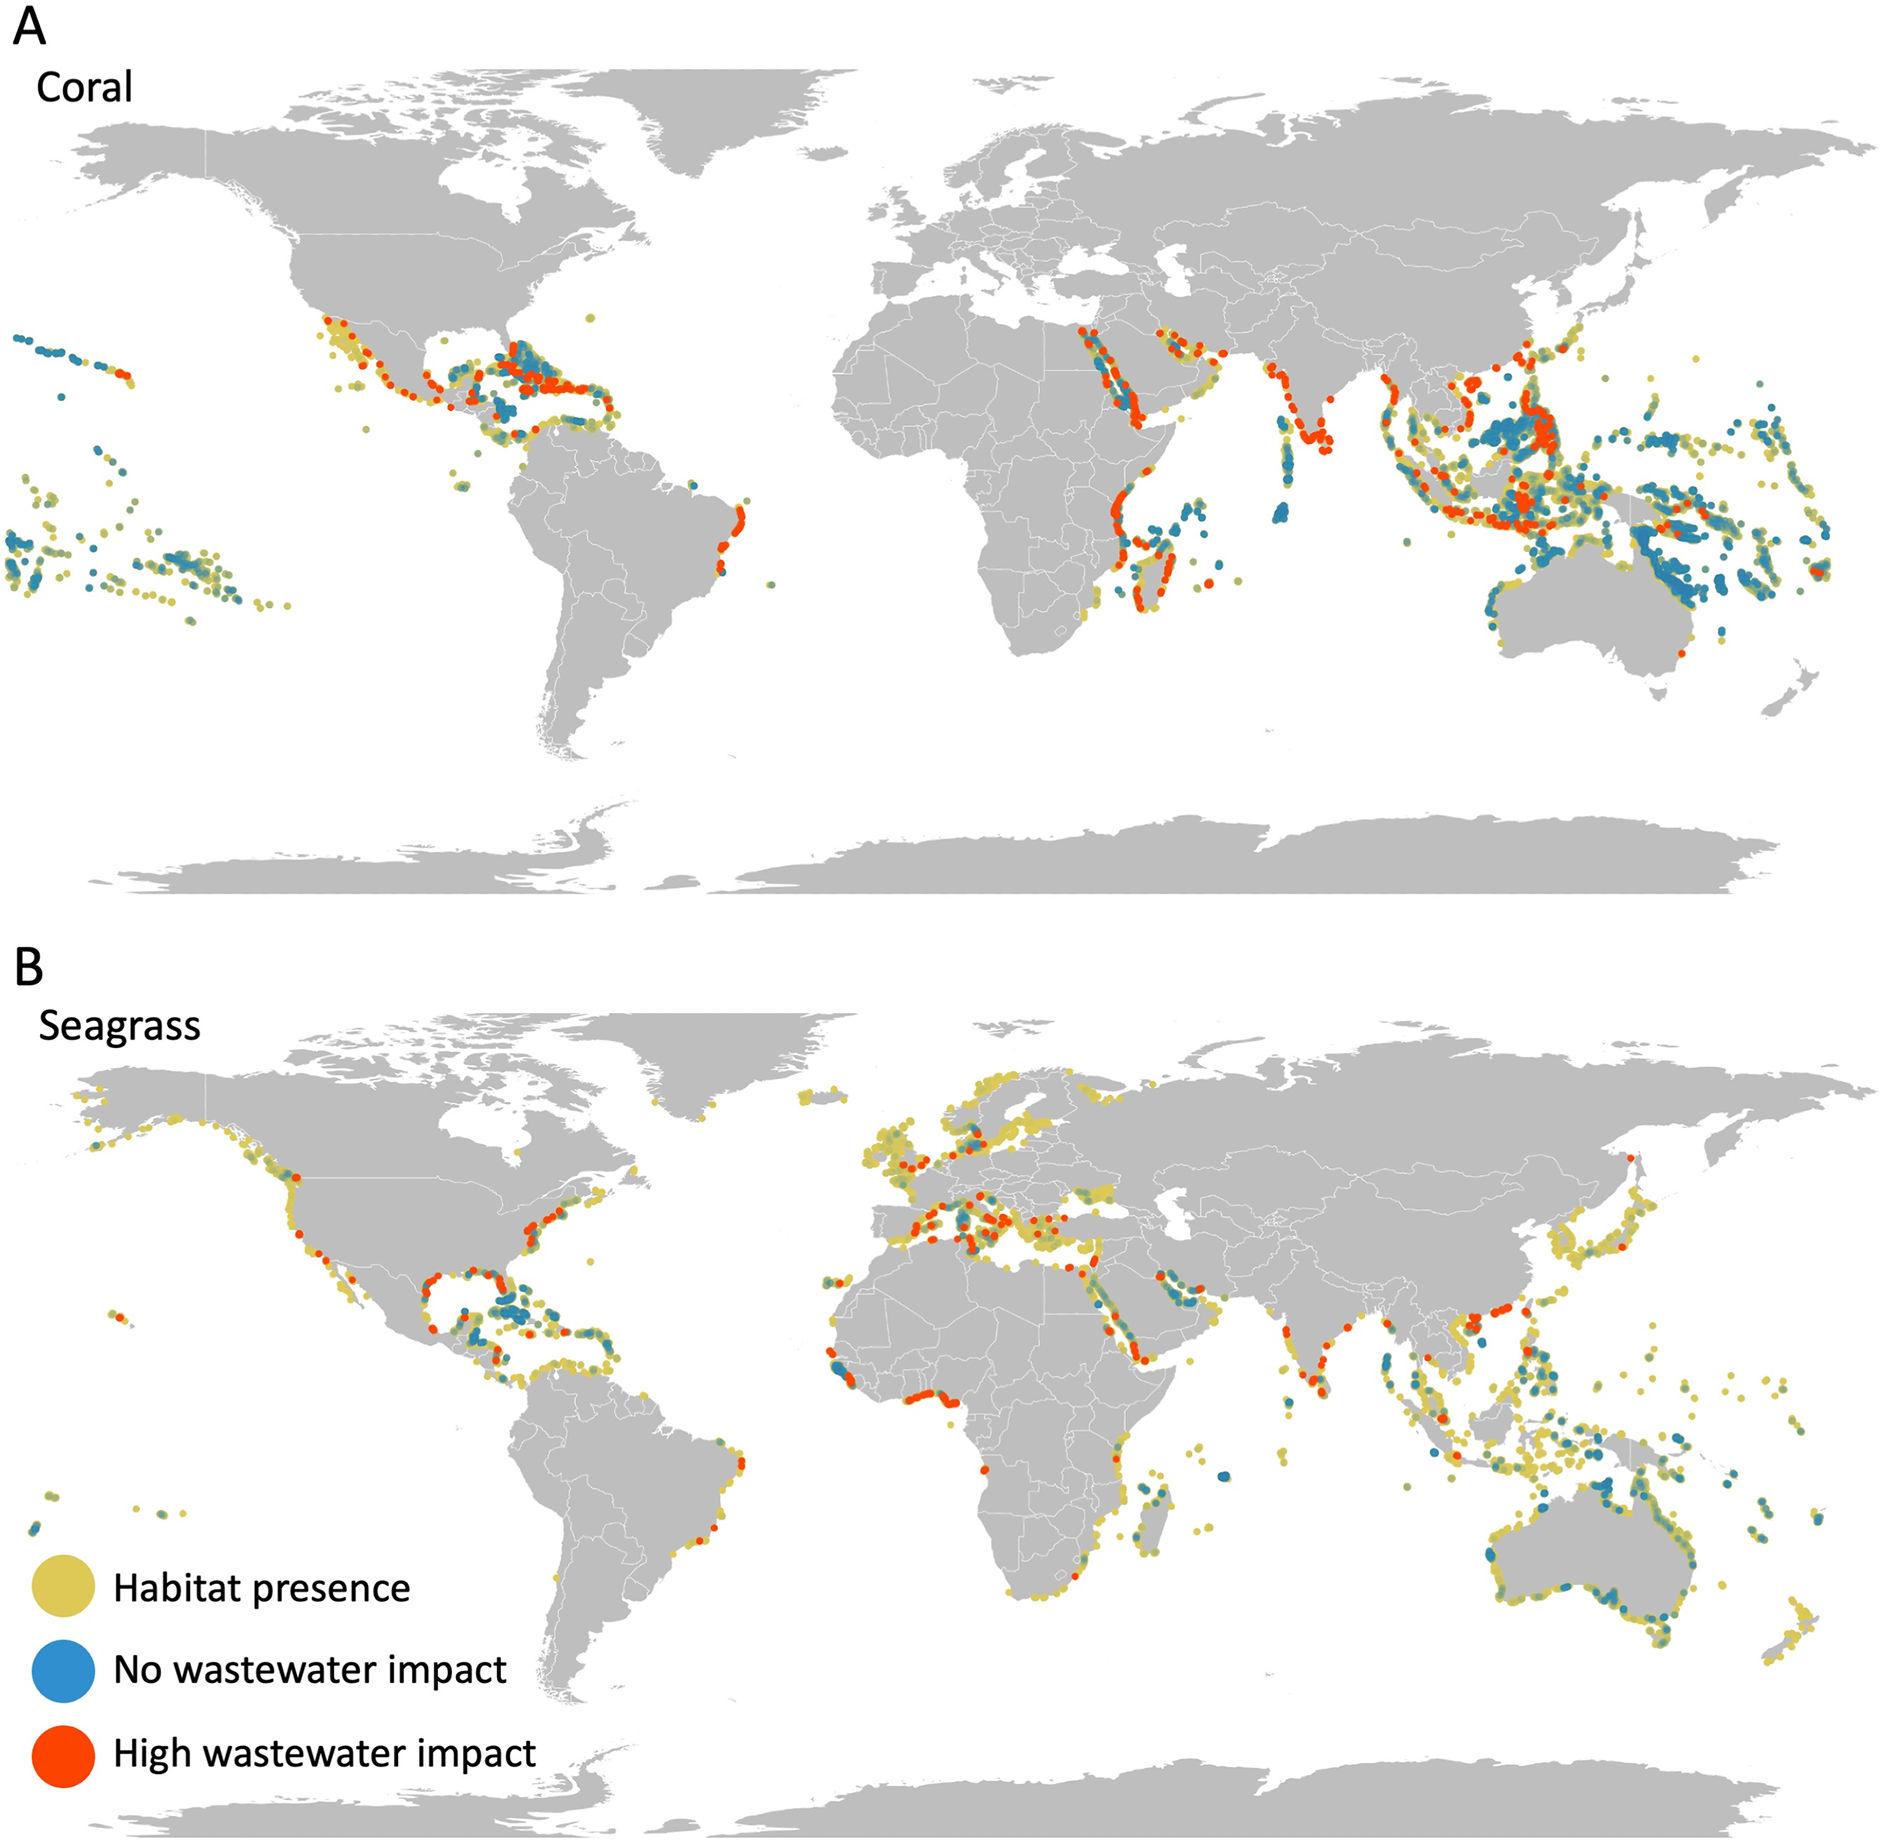
Figure 3. Expected impact of N on sensitive coastal habitats. Maps show where (A) coral reefs and (B) seagrass beds are heavily impacted (raster cells in top 2.5% of exposure; red dots), not impacted (no exposure to wastewater N; dark blue dots), or impacted but not in the top 2.5% (yellow dots). Raster cells are represented as points that visually over-represents the habitat; red is overlaid on top which makes it visually dominant; blue points are transparent and overlaid on green/yellow points such that higher densities of unimpacted areas are brighter blue. Image Credit: Tuholske, et al., 2021.
Along with wastewater impacts, pressure from overfishing and habitat degradation from coastal development add to the other stressors.
Wastewater contains human pathogens and excess N, posing a risk to both human health and ecological health. The study found that 25 watersheds contributed to over 51% of FIO into the ocean.
Wastewater impacts human health by creating elevated levels of pathogens that make us sick. At the same time, Nitrogen from wastewater impacts coastal ecosystems, creating harmful algal blooms that can lead to coastal dead zones. Coastal ecosystems are fragile. We are worried that too much Nitrogen in coastal areas can lead to tipping points where marine life cannot recover.
Cascade Tuholske, Earth Institute Postdoctoral Research Scientist, Center for International Earth Science Information Network (CIESIN), Columbia Climate School, Columbia University
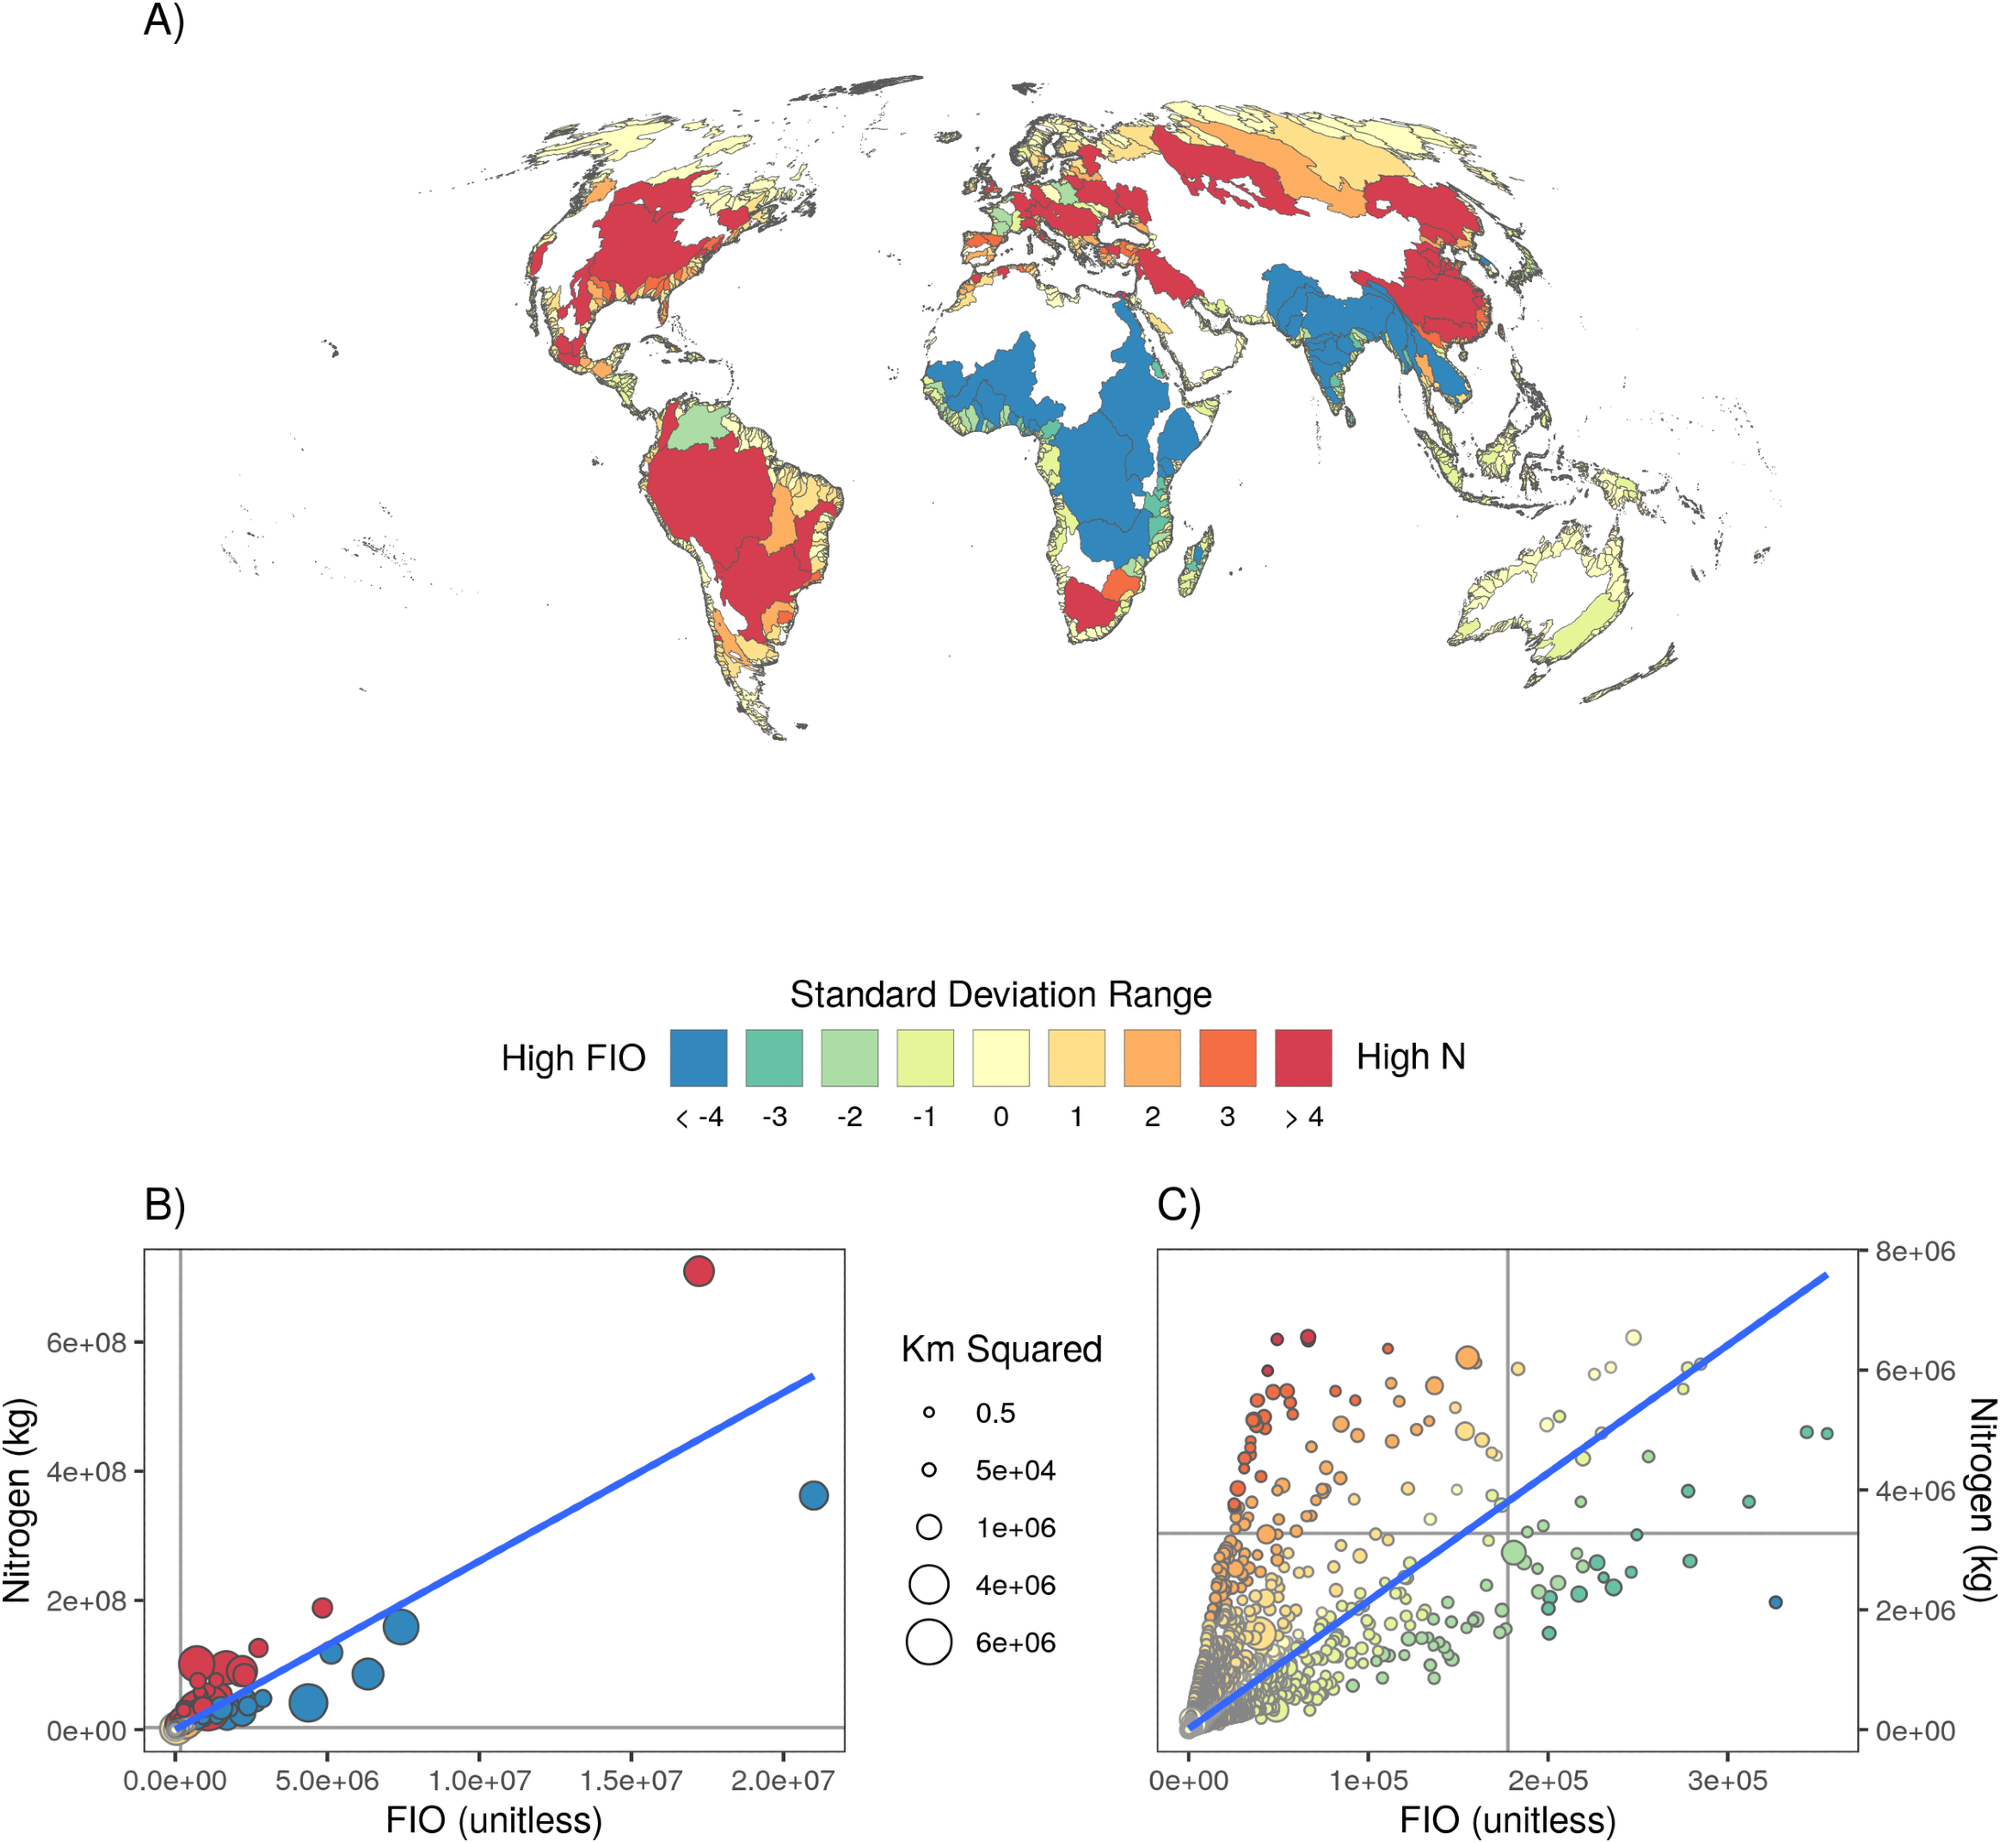
Figure 4. The relationship between watershed level input of N versus FIO. Watersheds for which total N exceeds (yellow to red colors) or is well below (green to blue colors) expected levels given predicted nitrogen/pathogen outputs from their correlation. Global map (A) and scatterplots of all watersheds, both full extent (B) and zoomed in (C). Watersheds for which the levels are proportional to expectations are white on the map, inclusive of the nearly 50% of (very small) watersheds for which there are no nitrogen or pathogen inputs. Dots in the scatter plot are scaled to the size of the watershed. Image Credit: Tuholske, et al., 2021.
Figure 4 shows spatial heterogeneity when comparing N vs. FIO input.
Places where N and FIO inputs are highly correlated pose a significant challenge in discovering a comprehensive solution.
Conclusion
This article provides crucial information required to give the needed clarity, highlighting FIO and N inputs across all watersheds, and also by country. However, the proposed model does not completely account for variations in land cover, sanitation efficiency, ecosystem processes, and other biogeochemical processes. The study also did not account for the input of phosphorus or other chemicals and pollutants that harms habitats and species.
This study is the first to produce fine-resolution, comparable data mapping land-based sources and downstream exposure of both pathogens and N in coastal ecosystems and employs sophisticated, high-resolution data on urbanization and population size.
The model offers a contrast between high spatial resolution demographic drivers and coarse-grained landscape dynamics. This model can be used to pinpoint priority hotspots for in-depth in situ monitoring that can identify the true sources and quantities of pollutants such as N.
Journal Reference:
Tuholske, C., Halpern, B. S., Blasco, G., Villasenor, J. C., Frazier, M., Caylor, K. (2021) Mapping global inputs and impacts from of human sewage in coastal ecosystems. PLOS ONE, 16(11), p. e0258898. Available at: https://journals.plos.org/plosone/article?id=10.1371/journal.pone.0258898.
References and Further Reading
- Halpern, B. S., et al. (2008) A global map of human impact on marine ecosystems. Science, 319, pp. 948–952. doi.org/10.1126/science.1149345.
- Vitousek, P. M., et al. (1997) Human Alteration of the Global Nitrogen Cycle: Sources and Consequences. Ecological Applications, 7, pp. 737–750. doi.org/10.1890/1051-0761(1997)007[0737:HAOTGN]2.0.CO;2.
- Halpern, B. S., et al. Global priority areas for incorporating land–sea connections in marine conservation. Conservation Letters, 2, pp. 189–196. doi.org/10.1111/j.1755-263X.2009.00060.x.
- Malone, T C & Newton, A (2020) The Globalization of Cultural Eutrophication in the Coastal Ocean: Causes and Consequences. Frontiers in Marine Science, 7, p. 670. doi.org/10.3389/fmars.2020.00670.
- He, Q & Silliman, B R (2019) Climate Change, Human Impacts, and Coastal Ecosystems in the Anthropocene. Current Biology, 29, pp. R1021–R1035. doi.org/10.1016/j.cub.2019.08.042.
- Harley, C. D. G., et al. (2006) The impacts of climate change in coastal marine systems. Ecology Letters, 9, pp. 228–241. doi.org/10.1111/j.1461-0248.2005.00871.x
- Diaz, R J & Rosenberg, R (2008) Spreading dead zones and consequences for marine ecosystems. Science, 321, pp. 926–929. doi.org/10.1126/science.1156401.
- Mekonnen, M M & Hoekstra, A Y (2015) Global Gray Water Footprint and Water Pollution Levels Related to Anthropogenic Nitrogen Loads to Fresh Water. Environmental Science & Technology, 49, pp. 12860–12868. doi.org/10.1021/acs.est.5b03191.
- Rabalais, N. N., et al. (2009) Global change and eutrophication of coastal waters. ICES Journal of Marine Science, 66(7), pp. 1528–1537. doi.org/10.1093/icesjms/fsp047.
- Howarth, R W (2008) Coastal nitrogen pollution: A review of sources and trends globally and regionally. Harmful Algae, 8, pp. 14–20. doi.org/10.1016/j.hal.2008.08.015.
- Breitburg, D. L., et al. (2009) Hypoxia, nitrogen, and fisheries: integrating effects across local and global landscapes. Annual Review of Marine Science, 1, pp. 329–349. doi.org/10.1146/annurev.marine.010908.163754.
- Burkholder, J. M., et al. (2007) Seagrasses and eutrophication. Journal of Experimental Marine Biology and Ecology, 350, pp. 46–72. doi.org/10.1016/j.jembe.2007.06.024.
- Lovelock, C. E., et al. (2009) Nutrient enrichment increases mortality of mangroves. PLoS ONE, 4, p. e5600. doi.org/10.1371/journal.pone.0005600.
- Bertness, M. D., et al. (2002) Anthropogenic modification of New England salt marsh landscapes. Proceedings of the National Academy of Sciences of the United States of America, 99, pp. 1395–1398. doi.org/10.1073/pnas.022447299.
- Altieri, A. H., et al. (2017) Tropical dead zones and mass mortalities on coral reefs. Proceedings of the National Academy of Sciences of the United States of America, 114, pp. 3660–3665. doi.org/10.1073/pnas.1621517114.
- Wear, S. L., et al. (2021) Sewage pollution, declining ecosystem health, and cross-sector collaboration. Biological Conservation, 255, p. 109010. doi.org/10.1016/j.biocon.2021.109010.
- Wear, S L & Thurber, R V (2015) Sewage pollution: mitigation is key for coral reef stewardship. Annals of the New York Academy of Sciences, 1355, pp. 15–30. doi.org/10.1111/nyas.12785
- Wear, S L (2019) Battling a Common Enemy: Joining Forces in the Fight against Sewage Pollution. Bioscience, 69, pp. 360–367. doi.org/10.1093/biosci/biz025.
- Lassaletta, L., et al. (2014) Food and feed trade as a driver in the global nitrogen cycle: 50-year trends. Biogeochemistry, 118, pp. 225–241. doi.org/10.1007/s10533-013-9923-4.
- Sans, P & Combris, P (2015) World meat consumption patterns: An overview of the last fifty years (1961–2011). Meat Science, 109, pp. 106–111. doi.org/106–111.10.1016/j.meatsci.2015.12.003.
- Wang, X., et al. (2019) Impact hotspots of reduced nutrient discharge shift across the globe with population and dietary changes. Nature Communications, 10, p. 2627 doi.org/10.1038/s41467-019-10445-0.
- Mara, D D (2003) Water, sanitation and hygiene for the health of developing nations. Public Health, 117, pp. 452–456. doi.org/10.1016/S0033-3506(03)00143-4.
- WHO (2019) Progress on household drinking water, sanitation and hygiene 2000–2017: special focus on inequalities. World Health Organization.
- Seitzinger, S P & Kroeze, C (1998) Global distribution of nitrous oxide production and N inputs in freshwater and coastal marine ecosystems. Global Biogeochemical Cycles, 12, pp. 93–113. doi.org/10.1029/97GB03657.
- Seitzinger, S. P., et al. (2010) Global river nutrient export: A scenario analysis of past and future trends. Global Biogeochemical Cycles, 24. doi.org/10.1029/2009GB003587.
- Mayorga, E., et al. (2010) Global Nutrient Export from WaterSheds 2 (NEWS 2): Model development and implementation. Environmental Modelling & Software, 25, pp. 837–853. doi.org/10.1016/j.envsoft.2010.01.007.
- Van Drecht, G., et al. (2009) Global nitrogen and phosphate in urban wastewater for the period 1970 to 2050. Global Biogeochemical Cycles, 23. doi.org/10.1029/2009GB003458.
- Bouwman, A. F., et al. (2005) Exploring changes in river nitrogen export to the world’s oceans. Global Biogeochemical Cycles, 19, p. 704. doi.org/10.1029/2004GB002314.
- van Puijenbroek, P. J. T. M., et al. (2019) Global nitrogen and phosphorus in urban waste water based on the Shared Socio-economic pathways. Journal Environmental Management, 231, pp. 446–456. doi.org/10.1016/j.jenvman.2018.10.048.
- Sanders, B. F., et al. (2012) Taking the “waste” out of “wastewater” for human water security and ecosystem sustainability. Science. doi.org/10.1126/science.1216852.
- Pagilla, K. R., et al. (2008) Nitrogen speciation in wastewater treatment plant influents and effluents—the US and Polish case studies. Water Science and Technology, pp. 1511–1517. doi.org/10.2166/wst.2008.213.
- Lamb, J. B., et al. (2017) Seagrass ecosystems reduce exposure to bacterial pathogens of humans, fishes, and invertebrates. Science, 355, pp. 731–733. doi.org/10.1126/science.aal1956.
- Kroeze, C., et al. (2016) Global modelling of surface water quality: a multi-pollutant approach. Current Opinion in Environmental Sustainability, 23, pp. 35–45. doi.org/10.1016/j.cosust.2016.11.014.
- Vilmin, L., et al. (2018) Forms and subannual variability of nitrogen and phosphorus loading to global river networks over the 20th century. Global Planetary Change, 163, pp. 67–85. doi.org/10.1016/j.gloplacha.2018.02.007.
- Beusen, A H W & Van Beek, L P H (2015) Coupling global models for hydrology and nutrient loading to simulate nitrogen and phosphorus retention in surface water – description of IMAGE–GNM and analysis of performance. Geoscientific Model Development. doi.org/10.5194/gmd-8-4045-2015.
- Morée, A. L., et al. (2013) Exploring global nitrogen and phosphorus flows in urban wastes during the twentieth century. Global Biogeochemical Cycles, 27, pp. 836–846. doi.org/10.1002/gbc.20072.
- Seitzinger, S. P., et al. (2005) Sources and delivery of carbon, nitrogen, and phosphorus to the coastal zone: An overview of Global Nutrient Export from Watersheds (NEWS) models and their application. Global Biogeochemical Cycles, 19. doi.org/10.1029/2005GB002606.
- Van Drecht, G., et al. (2003) Global modeling of the fate of nitrogen from point and nonpoint sources in soils, groundwater, and surface water. Global Biogeochemical Cycles, 17. doi.org/10.1029/2003GB002060
- WHO/UNICEF (2017) WHO/UNICEF Joint Monitoring Project. 2017. Available at: https://washdata.org/data/downloads#WLD.
- Hofstra, N & Vermeulen, L C (2016) Impacts of population growth, urbanisation and sanitation changes on global human Cryptosporidium emissions to surface water. International Journal of Hygiene and Environmental Health, 219, pp. 599–605. doi.org/10.1016/j.ijheh.2016.06.005.
- Vermeulen, L. C., et al. (2019) Cryptosporidium concentrations in rivers worldwide. Water Research, 149, pp. 202–214. doi.org/10.1016/j.watres.2018.10.069.
- Kiulia, N. M., et al. (2015) Global occurrence and emission of rotaviruses to surface waters. Pathogens, 4, pp. 229–255. doi.org/10.3390/pathogens4020229.
- Hofstra, N., et al. (2013) Exploring global Cryptosporidium emissions to surface water. Science of the Total Environment, 442, pp. 10–19. doi.org/10.1016/j.scitotenv.2012.10.013.
- Islam, M. M. M., et al. (2018) Modelling of river faecal indicator bacteria dynamics as a basis for faecal contamination reduction. Journal of Hydrology, 563, pp. 1000–1008. doi.org/10.1016/j.jhydrol.2018.06.077.
- Islam, M. M. M., et al. (2018) Modelling the impact of future socio-economic and climate change scenarios on river microbial water quality. International Journal of Hygiene and Environmental Health, 221, pp. 283–292. doi.org/10.1016/j.ijheh.2017.11.006
- Reder, K., et al. (2017) A sensitivity and uncertainty analysis of a continental-scale water quality model of pathogen pollution in African rivers. Ecological Modelling, 351, pp. 129–139. doi.org/10.1016/j.ecolmodel.2017.02.008.
- Malik, O. A., et al. (2015) A global indicator of wastewater treatment to inform the Sustainable Development Goals (SDGs). Environmental Science & Policy, 48, pp. 172–185. doi.org/10.1016/j.envsci.2015.01.005
- Florczyk, A. J., et al. (2019) Description of the GHS Urban Centre Database 2015. http://dx.doi.org/10.2760/037310.
- Leyk, S., et al. (2019) The spatial allocation of population: a review of large-scale gridded population data products and their fitness for use. Earth System Science Data. doi.org/10.5194/essd-11-1385-2019.
- Tuholske, C., et al. (2021) Implications for Tracking SDG Indicator Metrics with Gridded Population Data. Sustainability, 13, p. 7329. doi.org/10.3390/su13137329.
- Gerritse, R. G., et al. (1995) Nitrogen losses from a domestic septic tank system on the Darling Plateau in Western Australia. Water Research, 29, pp. 2055–2058. doi.org/10.1016/0043-1354(95)00023-E.
- Kay, D., et al. (2008) Faecal indicator organism concentrations in sewage and treated effluents. Water Research, 42, pp. 442–454. doi.org/10.1016/j.watres.2007.07.036.
- Beal, C. D., et al. (2005) Process, performance, and pollution potential: A review of septic tank–soil absorption systems. Soil Research, 43, pp. 781–802. doi.org/10.1071/SR05018.
- United Nations Statistics division (2013) Standard country and area codes classifications (m49). Available at: http://unstats.un.org/unsd/methods/m49/m49regin.htm.
- Lehner, B., et al. (2008) New global hydrography derived from spaceborne elevation data. EOS, 89, p. 93. doi.org/10.1029/2008EO100001.
- Food and Agriculture Organization of the United Nations (2017) Protein Supply Quantity. Available at: http://www.fao.org/faostat/en/#data/FBS.
- Smil, V (2002) Nitrogen and food production: proteins for human diets. AMBIO: A Journal of the Human Environment, 31, pp. 126–131. doi.org/10.1579/0044-7447-31.2.126.
- Tilman, D., et al. (2011) Global food demand and the sustainable intensification of agriculture. Proceedings of the National Academy of Sciences of the United States of America, 108, pp. 20260–20264. doi.org/10.1073/pnas.1116437108.
- Jenson, S K & Domingue, J O (1988) Extracting topographic structure from digital elevation data for geographic information system analysis. Photogrammetric Engineering and Remote Sensing, 54, pp. 1593–1600.
- Farr, T G & Kobrick, M (2000) Shuttle radar topography mission produces a wealth of data. Transactions Geophysical Union, 81, p. 583. doi.org/10.1029/EO081i048p00583.
- UNEP-WCMC WorldFish Centre, WRI TNC. (2018) Global distribution of warm-water coral reefs, compiled from multiple sources including the Millennium Coral Reef Mapping Project. Version 4.0. Includes contributions from IMaRS-USF and IRD (2005), IMaRS-USF (2005) and Spalding et al. (2001). Available at: http://data.unep-wcmc.org/datasets/1.
- UNEP-WCMC SFT (2018) Global distribution of seagrasses (version 6.0). Sixth update to the data layer used in Green and Short (2003). Available at: http://data.unep-wcmc.org/datasets/7.
- Beusen, A., et al. (2016) Global riverine N and P transport to ocean increased during the 20th century despite increased retention along the aquatic continuum. Biogeosciences, 13, pp. 2441–2451. doi.org/10.5194/bg-13-2441-2016.
- Halpern, B. S., et al. (2008) Managing for cumulative impacts in ecosystem-based management through ocean zoning. Ocean & Coastal Management, 51, pp. 203–211.
- .
- Pehlivanoglu-Mantas, E & Sedlak, D L (2008) Measurement of dissolved organic nitrogen forms in wastewater effluents: concentrations, size distribution and NDMA formation potential. Water Research, 42, pp. 3890–3898. doi.org/10.1016/j.watres.2008.05.017.
- Morrissey, C. A., et al. (2013) Stable isotopes as indicators of wastewater effects on the macroinvertebrates of urban rivers. Hydrobiologia, 700, pp. 231–244. doi.org/10.1007/s10750-012-1233-7.
- Fertig, B., et al. (2014) Oyster δ15N as a Bioindicator of Potential Wastewater and Poultry Farming Impacts and Degraded Water Quality in a Subestuary of Chesapeake Bay. Journal of Coastal Research, 30, pp. 881–892. doi.org/10.2112/JCOASTRES-D-11-00231.1.
- Dillon, K S & Chanton, J P (2008) Nitrogen stable isotopes of macrophytes assess stormwater nitrogen inputs to an urbanized estuary. Estuaries and Coasts, 31, pp. 360–370. doi.org/10.1007/s12237-007-9028-1