Mass spectrometry has seen widespread use in workplaces for many years in the multi-point, multi-component monitoring of a diverse range of volatile organic compounds (VOCs).
The manufacture of vinyl chloride monomer (VCM) from the reaction of chlorine and ethylene is a key application of mass spectrometry. This reaction initially produces ethylene dichloride (EDC), also known as 1,2-dichloroethane (DCE).1
A number of companies are also looking to monitor these VOCs in cooling water, requiring sensitive, selective analysis of a wide range of VOCs down to part-per-billion levels.
The robust combination of the Thermo Scientific™ Sentinel™ PRO 710 Mass Spectrometer’s high-precision magnetic sector MS with an established sampling probe is well suited to this need.
Monitoring Ethylene Dichloride in Process Water
EDC is regularly detected in surface water at concentrations in the μg/liter range, especially near industrialized areas. The highest levels of EDC are typically found close to factories producing VCM.2
The World Health Organization has established a guideline value of 30 µg/L for EDC in drinking water due to its potential as a human carcinogen. This level is approximately equivalent to 30 parts per billion by mass in water.
There is a risk that process cooling water may become contaminated with trace levels of EDC during its manufacture. This contamination occurs via leakages, with a subsequent risk of contaminated plant effluent being released into local water sources.
It is important that a monitoring system be both sensitive enough to detect these trace levels and selective enough to distinguish EDC from the wide range of other VOCs used throughout a typical chemical plant.
Supported Capillary Membrane Sampling
The Supported Capillary Membrane Sampler (SCMS) (Figure 1) was originally designed to interface with a gas- or liquid-chromatograph, but it is possible to interface this with MS to take advantage of its faster analysis speed.
The SCMS was initially developed and patented by Dow Chemical Company and later licensed to Global FIA Inc.3 It features a metal body with a long (typically two-meter), thin-walled membrane tubing wrapped around it.
Dissolved VOCs will permeate through the tube membrane wall into a carrier gas stream. The rate of this permeation is dependent on the dissolved VOC’s concentration. The SCMS can be understood as equivalent to headspace and purge-and-trap sampling, while offering a simpler, more direct sampling system.
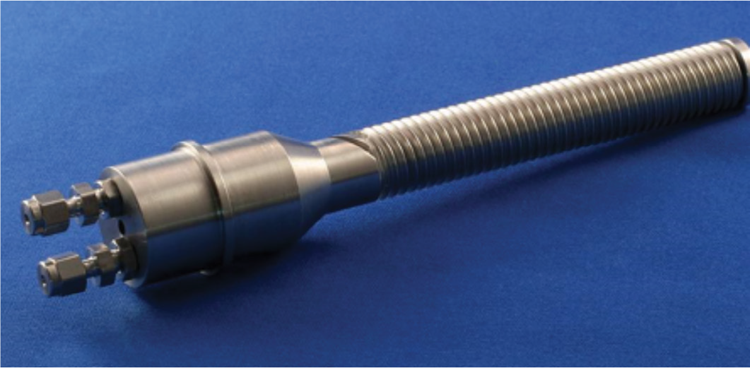
Figure 1. SCMS Supported Capillary Membrane Sampler (Global FIA Solutions). Image Credit: Thermo Fisher Scientific – Environmental and Process Monitoring Instruments
The carrier gas enters the SCMS through 1/8” tubing from a mass flow controller. The carrier gas for the Sentinel PRO 710 Mass Spectrometer is generally air. This gas then flows through the silicone rubber permeation tubing before exiting the SCMS via a second 1/8 in. tube connected to the Rapid Multistream Sampler (RMS) of the Sentinel PRO 710 Mass Spectrometer.
Typical carrier gas flow through the device is 40 mL per minute. The device’s output is connected directly to the Sentinel PRO 710 Mass Spectrometer by approximately four meters of stainless steel tubing. This tubing should be trace-heated to at least 50 °C.
Figure 2 shows a typical installation schematic. It is also important to note that the SCMS can be installed in a flow cell, which is also available from Global FIA Inc.
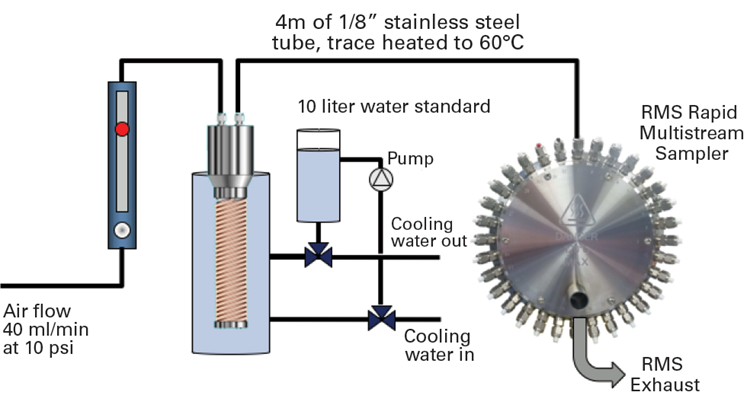
Figure 2. Typical SCMS probe installation. Image Credit: Thermo Fisher Scientific – Environmental and Process Monitoring Instruments
Calibration
Cylinders containing 10 ppm of each VOC in a separate cylinder are used to calibrate the Sentinel PRO. Next, known VOC concentrations in water are used to determine the conversion factor for concentration in the air carrier gas (molar ppm) to the actual concentration in the water that is flowing through the probe cell (ppm by weight).
The permeation rate of the SCMS is known to vary with temperature, much like other membrane sampling devices.
A study was performed to determine the effect of sample temperature on target VOC species. This was key to compensating for the impact of sample temperature on MS results and allowed correction factors to be implemented in Sentinel PRO’s analysis method.
A 1 ppm by volume sample of each VOC was circulated in water through a sample system containing the SCMS. This allowed the Sentinel PRO 710 Mass Spectrometer’s response to be characterized over a range of temperatures.
The results showed that sample temperature had a significant impact. For example, the recorded concentration was found to be 47% higher for EDC and 28% higher for VCM at 40 °C versus 30 °C. Figure 3 displays the study’s generated response for EDC.
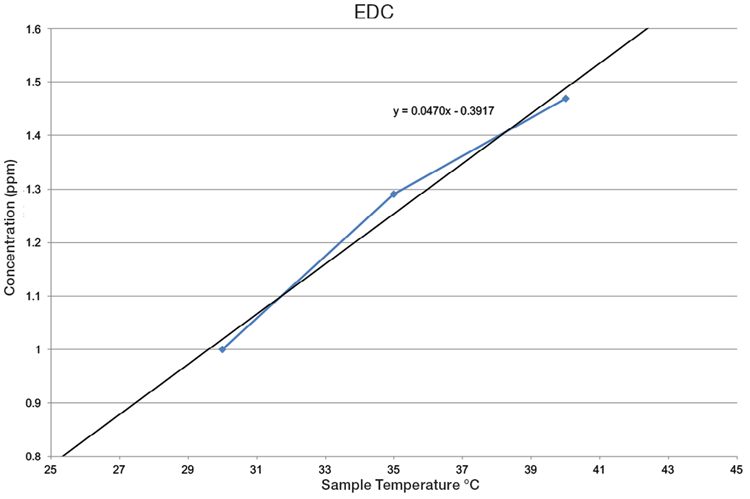
Figure 3. Effect of temperature on response of EDC. Image Credit: Thermo Fisher Scientific – Environmental and Process Monitoring Instruments
The GasWorks® software can be configured with VOC correction factors using temperature measurements from analog inputs. This allows real-time compensation for water temperature effects. Conversion factors typically range from 0.01 to 0.1, depending on the VOC, the probe, and the temperature.
Magnetic Sector Mass Spectrometry
A membrane inlet can be used to increase the relative concentrations of VOCs entering the MS, further improving the Sentinel PRO 710 Mass Spectrometer’s sensitivity to VOCs. Like the SCMS membrane, VOCs exhibit increased permeability through the Sentinel PRO membrane compared to inorganic air gases.
Electron impact ionization is then used to ionize and fragment the molecules, with each molecule generating a unique ‘fragmentation pattern’ that can be used to identify and quantify the various gas components present in a characteristic chemical plant atmosphere.
Figure 4 displays the mass spectra fragmentation patterns of VCM and EDC from the National Institute of Standards and Technology (NIST) library, providing an example of the complex composite spectrum of all the various fragmentation and isotope possibilities that exist for the various VOCs.
Figure 4 shows peaks at mass 98 and mass 100 that are unique to EDC, but there is also considerable overlap at all the main peaks.
The MS must also be able to accurately measure the interfering fragmentation patterns to differentiate the two VOCs. These fragmentation patterns must also be stable over time; otherwise, the MS will need frequent recalibrations, reducing its availability.
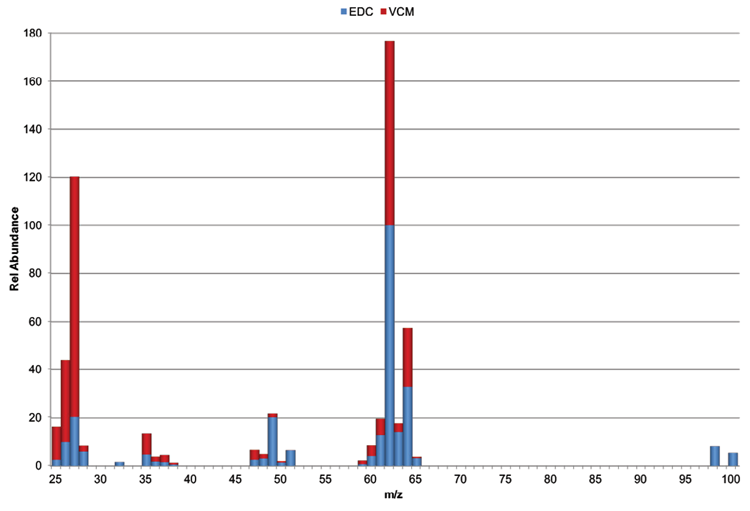
Figure 4. Composite mass spectrum of ethylene dichloride and vinyl chloride (NIST). Image Credit: Thermo Fisher Scientific – Environmental and Process Monitoring Instruments
Benefits of Magnetic Sector Mass Spectrometry
Two MS types have been used in process and environmental monitoring, quadrupole and magnetic sector applications, with both types manufactured by Thermo Fisher Scientific.
The company’s more than 30 years of industrial experience has confirmed that optimal performance in both process and environmental industrial gas analysis is offered by the magnetic-sector-based analyzer.
Key benefits of magnetic sector analyzers include contamination resistance, enhanced precision and accuracy, and long intervals between required calibrations.
Analytical precision is generally between two and 10 times better than that of a quadrupole analyzer, depending on the complexity of the mixture and the specific gases analyzed.
Figure 5 displays the Sentinel PRO 710 Mass Spectrometer’s magnetic sector analyzer alongside its characteristic flat-top peaks. The peak’s height is directly proportional to concentration, meaning it is possible to obtain the correct result by measuring peak height anywhere across the peak top. This powerful characteristic means that the magnetic sector analyzer is inherently fault-tolerant.
Dynamic Range
The system is required to detect traces of the designated VOCs, but in the event of a major leak, it must also offer a sufficiently wide dynamic range to accommodate much higher levels.
Figure 6 showcases the wide dynamic range of the Sentinel PRO 710 Mass Spectrometer with the SCMS for EDC. In the example presented here, the system was challenged across three orders of magnitude of EDC concentrations, ranging from 10 ppb to 10 ppm.
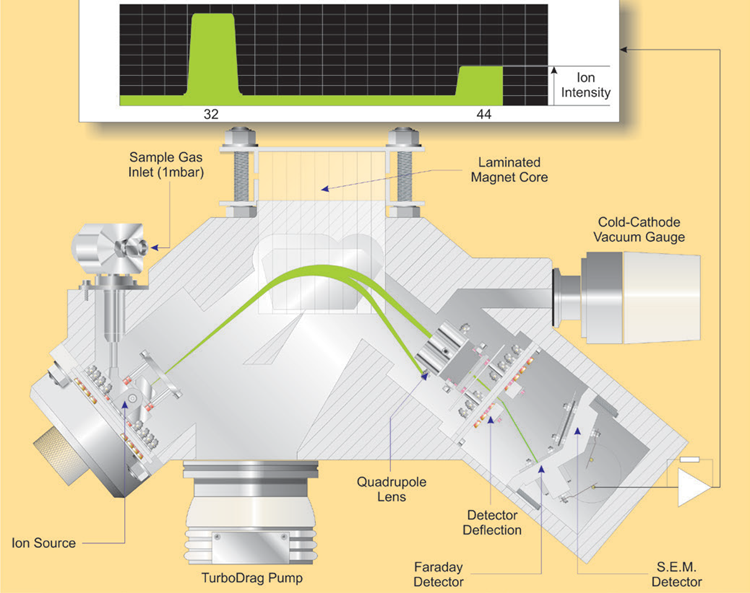
Figure 5. Sentinel PRO’s magnetic sector analyzer showing characteristic flat-top peaks. Image Credit: Thermo Fisher Scientific – Environmental and Process Monitoring Instruments
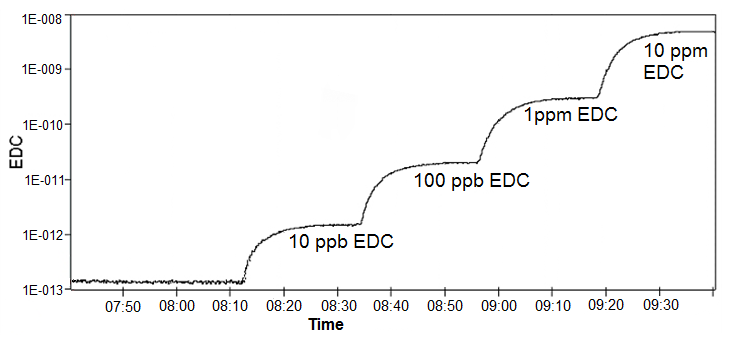
Figure 6. Linear measurement from 10 ppb to 10 ppm of EDC. Image Credit: Thermo Fisher Scientific – Environmental and Process Monitoring Instruments
Selectivity and Flexibility
EDC continues to be the most commonly monitored VOC using the Sentinel PRO 710 Mass Spectrometer, although some processes also require monitoring of other chlorinated compounds. For instance, Table 1 features the analysis specification for vinyl chloride, ethylene dichloride, and chloroform.
Table 1. Analysis specification for VCM, EDC, and chloroform. Source: Thermo Fisher Scientific – Environmental and Process Monitoring Instruments
| Component |
Air |
VCM |
EDC |
Chloroform |
| Molecular weight |
|
62.50 |
98.95 |
119.37 |
| Typical relative sensitivity |
1 |
15,000 |
50,000 |
70,000 |
| m/z 34 |
100 |
|
|
|
| m/z 62 |
|
100 |
100 |
0.1 |
| m/z 83 |
|
|
|
100 |
| m/z 98 |
|
|
30 |
0.1 |
Sentinel PRO/SCMS detection
limit in isolation (ppb by weight) |
|
10 |
10 |
10 |
The settling time needed when switching between different inlets is only 100 seconds, while the analysis time for the three VOCs is generally 12 seconds.
The GasWorks software supports multiple analysis methods and enables different methods to be applied to different sample streams. These capabilities allow the Sentinel PRO 710 Mass Spectrometer to be configured to measure different sets of VOCs at different sample locations.
For example, Figure 7 shows two analysis configurations for different cooling water streams. One configuration measures five VOCs, while the other measures three.
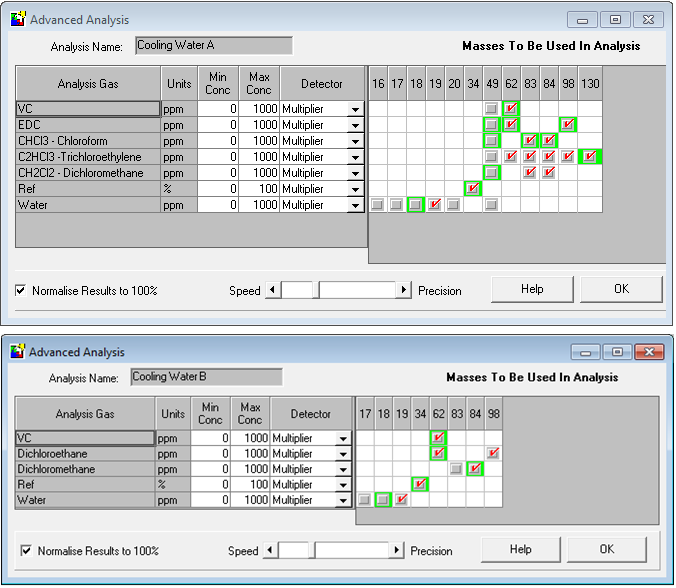
Figure 7. GasWorks analysis configurations for two different cooling water streams. Image Credit: Thermo Fisher Scientific – Environmental and Process Monitoring Instruments
It should be noted that mass 19 is used to measure water to indicate the state of the SCMS membrane. A damaged membrane may allow carrier gas to bring water into the MS, but it is possible to configure a high water alarm to disable analysis on that specific stream.
Another reason for using a mass 19 isotopic ion is to avoid overloading the MS detector. This is because the mass 19 peak’s relative intensity is just 0.1% of the intensity of the mass 18 peak, which is more than sufficient to function as an alarm indicator.
Figure 8 features 30 days of data acquired using the ‘Cooling Water A’ method. This was used to monitor ethylene dichloride, vinyl chloride, chloroform, trichloroethylene, and dichloromethane. The data was reviewed using GasWorks’ data review facility in this example.
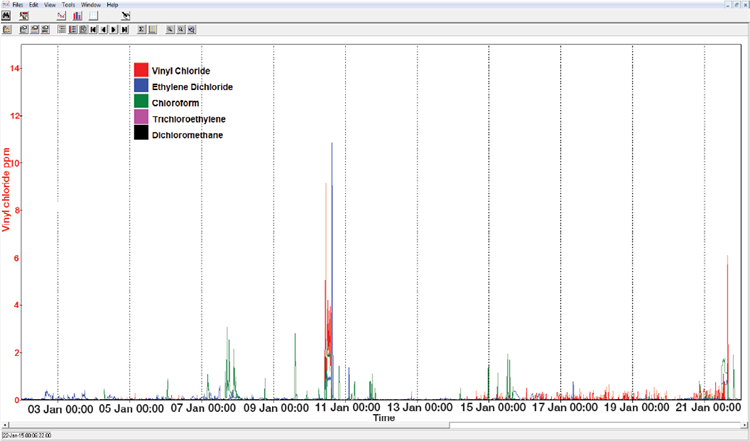
Figure 8. 30-day process data for five VOCs. Image Credit: Thermo Fisher Scientific – Environmental and Process Monitoring Instruments
Summary
The Sentinel PRO 710 Mass Spectrometer has a proven track record of monitoring point-source and fugitive VOC emissions across a diverse range of industrial plant atmospheres. The addition of a proven SCMS extends the range of applications supported by the Sentinel PRO 710 Mass Spectrometer for monitoring VOCs in process water at ppb and ppm levels.
The Sentinel PRO offers a range of other benefits, including:
- Real-time compensation for water sample temperature via the GasWorks software’s Derived Value facility
- A membrane inlet offering high sensitivity
- High precision and stability, thanks to the magnetic sector MS
- A single system to monitor multiple compounds
- A standard three-year warranty
References and Further Reading
- Merriman, D. (2025). Continuous Monitoring of Vinyl Chloride and Ethylene Dichloride in the Air. Identifying Threats. Available at: https://www.thermofisher.com/blog/identifying-threats/continuous-monitoring-of-vinyl-chloride-and-ethylene-dichloride-in-the-air/.
- WFO. 1,2-Dichloroethane in Drinking-water Background document for development of WHO Guidelines for Drinking-water Quality. Available at: https://cdn.who.int/media/docs/default-source/wash-documents/wash-chemicals/1-2-dichloroethane.pdf?sfvrsn=d7e6c0e0_4.
- US Patent 5,317,932 dated June 7, 1994
Acknowledgments
Produced from materials originally authored by Graham Lewis from Thermo Scientific.

This information has been sourced, reviewed, and adapted from materials provided by Thermo Fisher Scientific – Environmental and Process Monitoring Instruments.
For more information on this source, please visit Thermo Fisher Scientific – Environmental and Process Monitoring Instruments.