Thermo Scientific™ NanoDrop QC™ Software, designed for use with the Thermo Scientific™ NanoDrop™ OneC Microvolume UV-Vis Spectrophotometer, facilitates real-time chemometric analysis of high absorbance chemical samples, without the need for dilutions.
This article describes how to develop and validate a chemometric method for determining dye concentrations in a complex mixture. It will also demonstrate how NanoDrop QC Software can be used to collect quantitative data in samples with many components and UV-Vis spectra that greatly overlap.
Thermo Fisher Scientific has developed a technology that identifies the distinct concentrations of sunset yellow and tartrazine in mixes with varying ratios of each component and estimates the percentage of the two dyes.
NanoDrop QC Software extends the patented NanoDrop OneC Spectrophotometer measurement platform's application to a wide range of industries, including food dye producers, petrochemical companies, and polymer manufacturers, which require an efficient and precise method for evaluating sample quality.
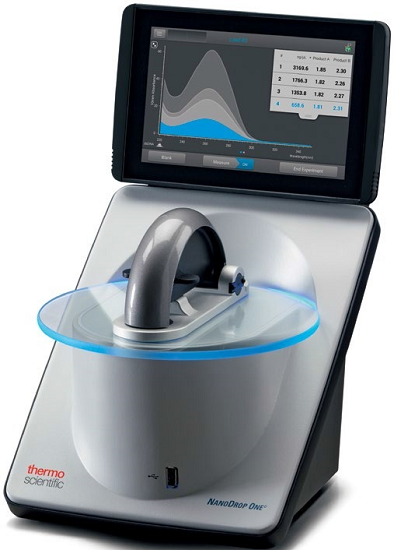
Thermo Scientific NanoDrop Onec Microvolume UV-Vis Spectrophotometer. Image Credit: Thermo Fisher Scientific - UV-Vis Spectroscopy
Introduction
UV-visible (UV-Vis) spectroscopy is a commonly used analytical method for obtaining quantitative data about chemical species. This is thanks to its low cost, efficiency, and precision.
When the wavelength-dependent extinction coefficient is known in pure chemical samples, Beer's Law can be used to calculate the concentration.
Beer's Law has a key limitation: it only provides precise results for samples that do not include any other chemical species with overlapping absorbance at the analyzed wavelength.1 Chemometrics is commonly used to analyze UV-Vis data from complex chemical samples (such as mixtures).
Relevant information about chemical systems can be provided through chemometrics by analyzing measured chemical data.2 It offers a productive approach for determining the concentrations of chemical species with overlapping spectra.
Chemometrics is the application of a variety of statistical approaches and multivariate mathematical models to determine quantitative concentration data for several components at the same time.3
The advanced nature of the multivariate calibration models used in chemometrics has limited their application to those with a thorough understanding of the topic. After the data has been collected, the majority of the analysis is carried out by a competent chemometrics professional.
The NanoDrop QC Software combines effective chemometric analysis with the NanoDrop OneC microvolume measuring instrument. The measurement platform has a novel sample retention method that employs surface tension between two fiber optic cables to hold 1–2 μL samples in situ (Figure 1).4
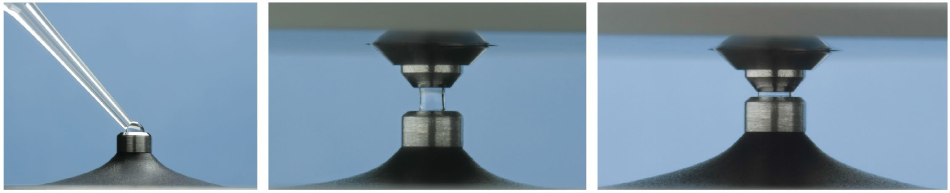
Figure 1. NanoDrop Microvolume Sampling platform Left: Loading of a 1 μL sample on the measurement pedestal Middle: Sample measurement at 1 mm pathlength Right: Sample measurement at 0.2 mm. Image Credit: Thermo Fisher Scientific - UV-Vis Spectroscopy
The measurement platform also supports a variety of pathlengths (1.0, 0.2, 0.1, 0.05, and 0.03 mm). They adjust in real time during sample measurement, resulting in a wide dynamic range spanning from 0.04 to 550 absorbance units (10 mm equivalent absorbance units).
These capabilities make the instrument's platform suitable for a wide range of industrial applications, including industrial dye analysis, polymer QA/QC, petrochemical analysis, and other material science applications.
To demonstrate the NanoDrop QC Software's efficacy in real-time chemometric investigation, two common dyes (sunset yellow and tartrazine) were combined, and a multivariate calibration model was built to determine each component's concentration and percentage of composition in the mixture.
Dyes with highly overlapping UV-Vis absorption spectra were chosen to demonstrate the utility of this method. The manufacturing and verification of the chemometric approach will also be outlined.
Materials and Methods
An experimental system was created using mixes of two water-soluble azo dyes, sunset yellow and tartrazine, to demonstrate the efficacy of chemometric analysis performed on Thermo Fisher Scientific's microvolume UV-Vis platform.
These two dyes were chosen for the experimental framework because considerable portions of their spectra overlapped. Sunset yellow has three UV-Vis peaks (238 nm, 315 nm, and 476 nm), whereas tartrazine has two unique peaks (259 nm and 425 nm) (Figure 2).
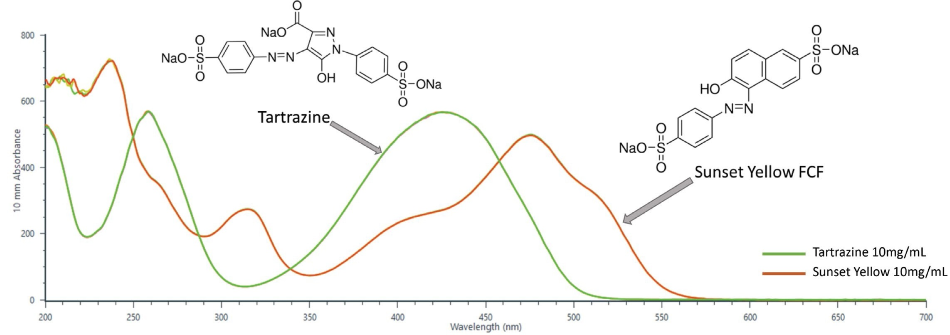
Figure 2. Full UV-Vis spectra of pure tartrazine and sunset yellow (200–700 nm). Spectra were collected with the UV-Vis module of the NanoDrop QC Software and were baseline-corrected at 800 nm. Solutions of each dye were prepared at 10 mg/mL and 2 µL aliquots were measured on the instrument. Image Credit: Thermo Fisher Scientific - UV-Vis Spectroscopy
Experimental Flow Chart
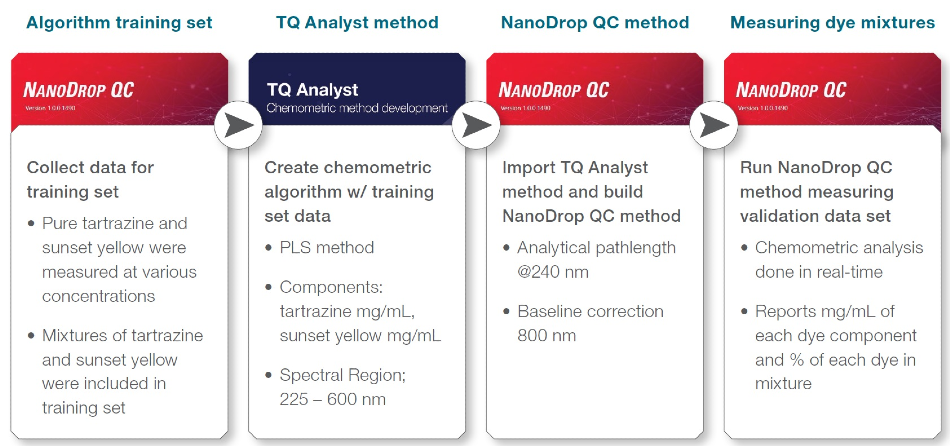
Figure 3. Experimental steps followed to create and test a NanoDrop QC chemometric method to determine tartrazine and sunset yellow dye concentration in a mixture. Image Credit: Thermo Fisher Scientific - UV-Vis Spectroscopy
Algorithm Training Set
Table 1 displays the training set samples created to develop the chemometric approach and determine the quantities of sunset yellow and tartrazine dye in a mixture.
The 100 mg/mL dye solutions were serially diluted in ddH2O to produce the following stocks: 10 mg/mL, 2.5 mg/mL, and 0.5 mg/mL. To create 100 µL dye mixtures, appropriate volumes of each stock were pipetted.
NanoDrop QC Software was used to quantify 2 µL aliquots using its UV-Vis application. Pathlength control was set at an analytical wavelength of 240 nm, and baseline correction was performed at 800 nm. Each sample underwent three replications.
Table 1. Samples created for the chemometric algorithm training set. The training data set consisted of randomly determined mixtures of tartrazine and sunset yellow. The concentration range spanned from 0 mg/mL to 10 mg/mL. Source: Thermo Fisher Scientific - UV-Vis Spectroscopy
| Mixture training set |
| Training set sample # |
Description |
Tartrazine
(mg/mL) |
Sunset yellow
(mg/mL) |
| 1 |
Mixture |
7.46 |
2.54 |
| 2 |
Mixture |
0.38 |
9.62 |
| 3 |
Mixture |
5.92 |
4.08 |
| 4 |
Mixture |
2.43 |
7.57 |
| 5 |
Mixture |
8.00 |
2.00 |
| 6 |
Mixture |
3.74 |
6.26 |
| 7 |
Mixture |
5.22 |
4.78 |
| 8 |
Mixture |
2.07 |
0.43 |
| 9 |
Mixture |
0.42 |
2.08 |
| 10 |
Mixture |
1.61 |
0.89 |
| 11 |
Mixture |
1.88 |
0.62 |
| 12 |
Mixture |
1.03 |
1.47 |
| 13 |
Mixture |
1.54 |
0.96 |
| 14 |
Mixture |
0.09 |
0.41 |
| 15 |
Pure |
0.00 |
0.50 |
| 16 |
Mixture |
0.19 |
0.31 |
| 17 |
Mixture |
0.15 |
0.35 |
| 18 |
Mixture |
0.36 |
0.14 |
| 19 |
Mixture |
0.22 |
0.28 |
TQ Analyst Method
The training data was imported into Thermo Scientific™ TQ Analyst™ Software, where a partial least squares (PLS) approach was established. The calibration was produced using the spectral range of 225–600 nm, with a baseline correction at 800 nm.
No extra spectral processing was performed on the data. The two components used were sunset yellow concentration (mg/mL) and tartrazine concentration (mg/mL).
Two composite calculations were also developed to establish composition percentages, such as the percentage of tartrazine and sunset yellow.
The method uses three factors to determine the concentration of tartrazine and four factors to determine the concentration of sunset yellow.
NanoDrop QC method
To produce a NanoDrop QC technique, the TQ method described above was imported into the NanoDrop QC software. The analytical wavelength of 240 nm was used to determine the best pathlength for the measurement results.
Method Validation
Measuring Dye Mixtures
Table 2 shows the validation samples produced to validate the technique. The stocks in Table 2 were produced by serially diluting 100 mg/mL dye solutions in ddH2O to yield 0.5, 1.0, 2.5, 5.0, and 10 mg/mL stocks.
A sufficient volume of each stock was pipetted to get 100 µL of dye mixes or pure samples. The NanoDrop OneC equipment was used to quantify 2 µL aliquots using a chemometric technique. Pathlength control was set to the analytical wavelength of 240 nm.
All samples underwent three replications. The expected (Table 2) and measured amounts of each color in the mixes were compared to ensure the chemometric approach was accurate.
Table 2. Samples created to validate the chemometric method described above. Samples spanned the concentration range from 0 mg/mL to 8.21 mg/mL. Source: Thermo Fisher Scientific - UV-Vis Spectroscopy
| Validation samples |
| Validation sample # |
Description |
Tartrazine
(mg/mL) |
Sunset yellow
(mg/mL) |
| 1 |
Mixture |
4.19 |
5.81 |
| 2 |
Mixture |
1.79 |
8.21 |
| 3 |
Mixture |
5.17 |
4.83 |
| 4 |
Pure sunset yellow |
0.00 |
5.00 |
| 5 |
Mixture |
1.34 |
3.66 |
| 6 |
Mixture |
4.59 |
0.41 |
| 7 |
Mixture |
0.32 |
2.18 |
| 8 |
Mixture |
1.61 |
0.89 |
| 9 |
Mixture |
1.91 |
0.59 |
| 10 |
Mixture |
0.39 |
0.61 |
| 11 |
Pure tartrazine |
1.00 |
0.00 |
| 12 |
Mixture |
0.30 |
0.20 |
| 13 |
Mixture |
0.25 |
0.25 |
| 14 |
Mixture |
0.31 |
0.19 |
Results
The Nanodrop QC Software enabled the researchers to run samples and conduct a chemometric analysis in real time. Figure 4 shows how the data is represented by the software.
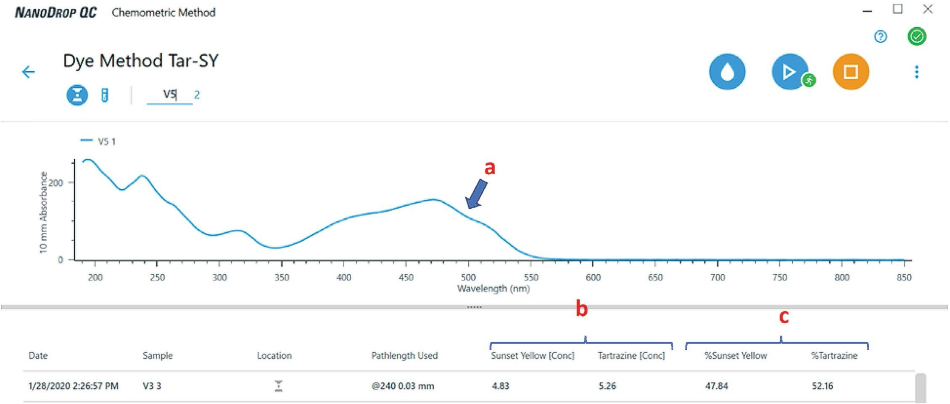
Figure 4. View of the chemometric method application contained within the NanoDrop QC Software. Note that the component (dye concentration) and composite results are reported directly on the screen in real time. There is no need to perform any post-run data processing. For each mixture, the software displays (a) the spectrum of the mixture, (b) the concentration, and (c) % composition of each dye in that mixture. Image Credit: Thermo Fisher Scientific - UV-Vis Spectroscopy
Figures 5 and 6 show a close match between the expected and calculated dye concentrations for the 14 dye mixes. The validation samples comprised a wide concentration range (0–8.21 mg/mL), allowing the whole range of dye concentrations used in the training set to be assessed.
In each case (Figures 5 and 6), the chemometric prediction for the highest dye concentrations showed the most significant differences. Sunset yellow had a higher rate of prediction error than tartrazine.
The difference between expected and reported concentrations remained small, ranging from 0.04 mg/mL to 0.28 mg/mL.
The aforementioned disparities highlighted the importance of validating chemometric approaches by testing algorithm performance with independent data.
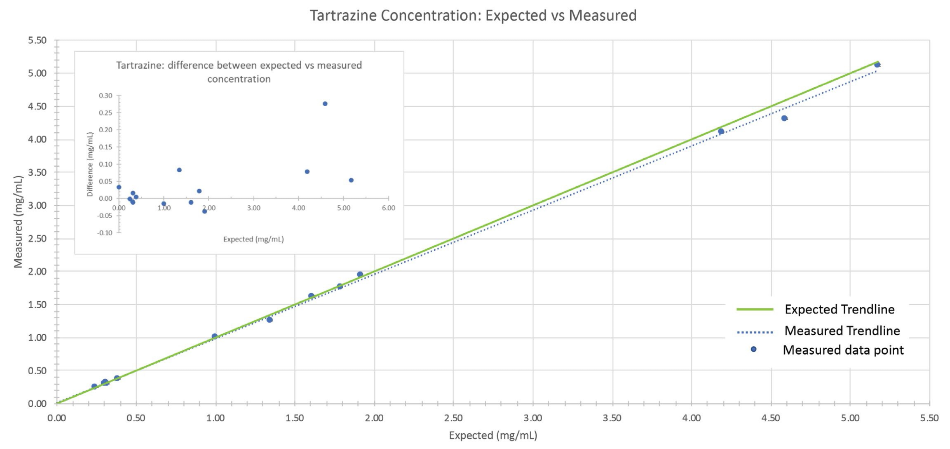
Figure 5. Comparison between expected vs. measured tartrazine concentration of the validation sample set. The green line represents the trendline when expected concentrations are plotted against themselves (i.e., measured values perfectly match expected values). The dotted blue line is the observed trendline when the measured concentrations are plotted against the expected concentrations. Image Credit: Thermo Fisher Scientific - UV-Vis Spectroscopy
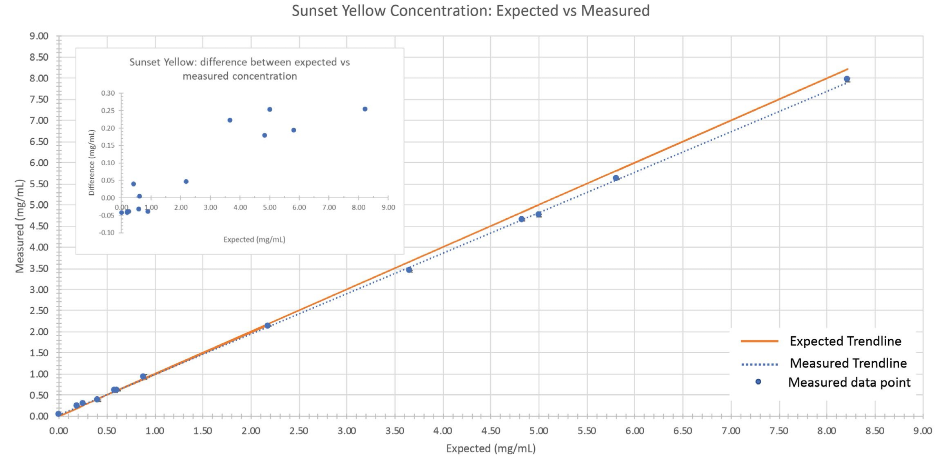
Figure 6. Comparison between expected vs. measured sunset yellow concentration of the validation sample set. The orange line represents the trendline when expected concentrations are plotted against themselves (i.e., measured values perfectly match expected values). The dotted blue line is the observed trendline when the measured concentrations are plotted against the expected concentrations. Image Credit: Thermo Fisher Scientific - UV-Vis Spectroscopy
Conclusion
NanoDrop QC Software, when combined with the NanoDrop OneC microvolume sampling platform, offers numerous advantages to scientists, including the capacity to:
- Quantify highly absorbing samples (> 500 A) without the need for specialized flow cells, short-path length cuvettes, or time-consuming dilutions
- Provide comprehensive UV-Vis spectral information in a 10-second measurement (1300 data points)
- Perform real-time chemometric analysis to improve data processing efficiency
Chemometric analysis was created and applied to a variety of combinations, including very concentrated dyes.
UV-Vis measurements, when combined with chemometric analysis, are a highly beneficial solution for a wide range of applications, including drug purity,5 petrochemical chemical analysis, food dye applications, polymer manufacturing, and a host of other chemometric analysis requirements.
References and Further Reading
- Olivieri, A.C., et al. (2006). Uncertainty estimation and figures of merit for multivariate calibration (IUPAC Technical Report). Pure and Applied Chemistry, 78(3), pp.633–661. doi: DOI: 10.1351/pac200678030633. https://www.ingentaconnect.com/content/degruyter/pac/2006/00000078/00000003/art00004.
- Wold, S. (1995). Chemometrics; what do we mean with it, and what do we want from it? Chemometrics and Intelligent Laboratory Systems, 30(1), pp.109–115. DOI: 10.1016/0169-7439(95)00042-9. https://www.sciencedirect.com/science/article/abs/pii/0169743995000429.
- Kramer R. Chapter 2: Basic Approach. Chemometric techniques for quantitative analysis. Marcel Dekker; 1998.
- Desjardins, P. and Conklin, D. (2010). NanoDrop Microvolume Quantitation of Nucleic Acids. Journal of Visualized Experiments, 45(2565). DOI: 10.3791/2565. https://www.jove.com/t/2565/nanodrop-microvolume-quantitation-of-nucleic-acids.
- Biancolillo, A. and Marini, F. (2018). Chemometric Methods for Spectroscopy-Based Pharmaceutical Analysis. Frontiers in Chemistry, 6. DOI: 10.3389/fchem.2018.00576. https://www.frontiersin.org/journals/chemistry/articles/10.3389/fchem.2018.00576/full.

This information has been sourced, reviewed and adapted from materials provided by Thermo Fisher Scientific - UV-Vis Spectroscopy.
For more information on this source, please visit Thermo Fisher Scientific - UV-Vis Spectroscopy.