In May, a team of Goddard scientists will begin measuring greenhouse gases over the Mid-Atlantic region — an area chosen in part because it encompasses a range of vegetation, climate, and soil types that would influence the exchange of carbon dioxide and methane between the Earth and the atmosphere.
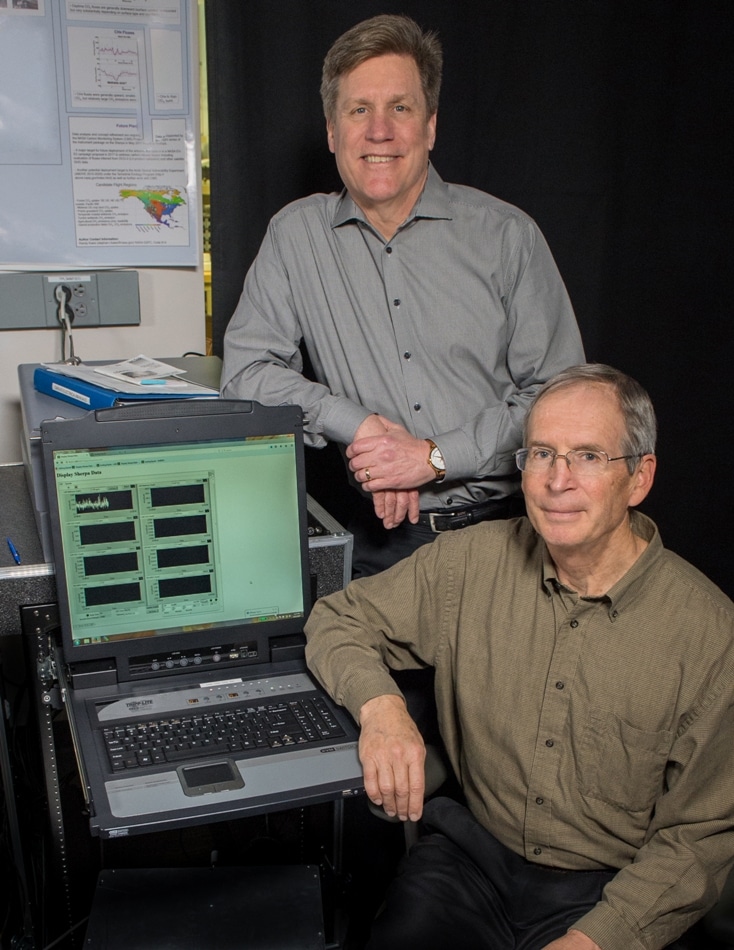 Goddard scientists Randy Kawa (seated) and Paul Newman will be flying modified, commercial-off-the-shelf methane/carbon-dioxide analyzers, wind sensors, camera, and GPS on a C-23 Sherpa aircraft to obtain regional carbon-flux measurements. They are pictured here with the computer in front and one of the instruments behind the screen. (Credits: NASA/W. Hrybyk)
The airborne campaign, called the Carbon Airborne Flux Experiment, or CARAFE, could help scientists better understand the exchange process, also known as flux, and improve computer models that predict Earth’s carbon sinks, natural or artificial areas that absorb carbon dioxide or methane.
What Scientists Know
Scientists know how much carbon dioxide is produced annually through the burning of fossil fuels. They also know that about 44 percent of these emissions stay in the atmosphere and that the oceans and land sinks take up the rest. What they don’t know as well is what biological mechanisms currently control the uptake and storage in grasses, crops, and trees. They also don’t know whether these sinks will continue, considering ever-increasing emissions and changing climate.
Currently, most flux data are gathered at towers or inferred from atmospheric carbon measurements, including those from satellites. Unfortunately, towers typically measure only the conditions occurring within their general vicinities.
CARAFE will help rectify that. The team will use CARAFE data to determine how well computer models represent regional flux variations and compare actual surface flux rates against those inferred from satellite data — both of which will help improve existing atmospheric and ecosystem computer modeling. These analyses can help improve representations of the land surface in both weather and climate models.
“Hopefully we will be able to demonstrate the value of these measurements,” said CARAFE Principal Investigator Randy Kawa, an expert in carbon modeling. “We want to build a confident and consistent picture of both carbon-dioxide and methane fluxes and their dependence on underlying biological, geological, weather, and chemical processes. This will allow decision makers to make better informed decisions about greenhouse gas policy and impacts.”
Month-Long Campaign
During the month-long campaign, a NASA C-23 Sherpa aircraft from the Wallops Flight Facility on Virginia’s Eastern Shore will fly at various altitudes over the Pocomoke Forest area on the Eastern Shore of Maryland; agricultural areas and tidal marshlands from the Eastern Shore of Virginia to southern Delaware; the Chesapeake Bay and the Atlantic Ocean; southern Maryland; the New Jersey Pine Barrens in the southern portion of the state; and the Alligator River and the Great Dismal Swamp in eastern North Carolina and southeastern Virginia.
While flying “low and slow,” the campaign’s modified, commercial-off-the-shelf methane/carbon-dioxide analyzers, wind sensors, camera, and GPS will gather 10 carefully synchronized measurements per second. Specifically, the instruments will measure both greenhouse gas levels along tree lines and vertical wind speeds, which when combined reveal how fast these gases transfer to or from the atmosphere.
“If the GPS data is off by even a half second, the flux measurements are off,” said CARAFE Co-Principal Investigator Paul Newman, adding that the team used Goddard Internal Research and Development program funding to modify the instruments and develop the data system.
“What we’re trying to determine is how fast are trees taking up carbon dioxide,” he said. “This rate differs for different trees, shrubs, grasses, and other conditions. All have different uptake levels. It changes if the vegetation doesn’t have enough water, for example, or if it is healthy. We must represent that in or models. We have to understand the rates.”